. 2020 Jun 5;126(12):1685-1702.
doi: 10.1161/CIRCRESAHA.119.316100. Epub 2020 Mar 26.

A Critical Role for Estrogen-Related Receptor Signaling in Cardiac Maturation

Affiliations

A Critical Role for Estrogen-Related Receptor Signaling in Cardiac Maturation

Tomoya Sakamoto et al. Circ Res. .

Abstract

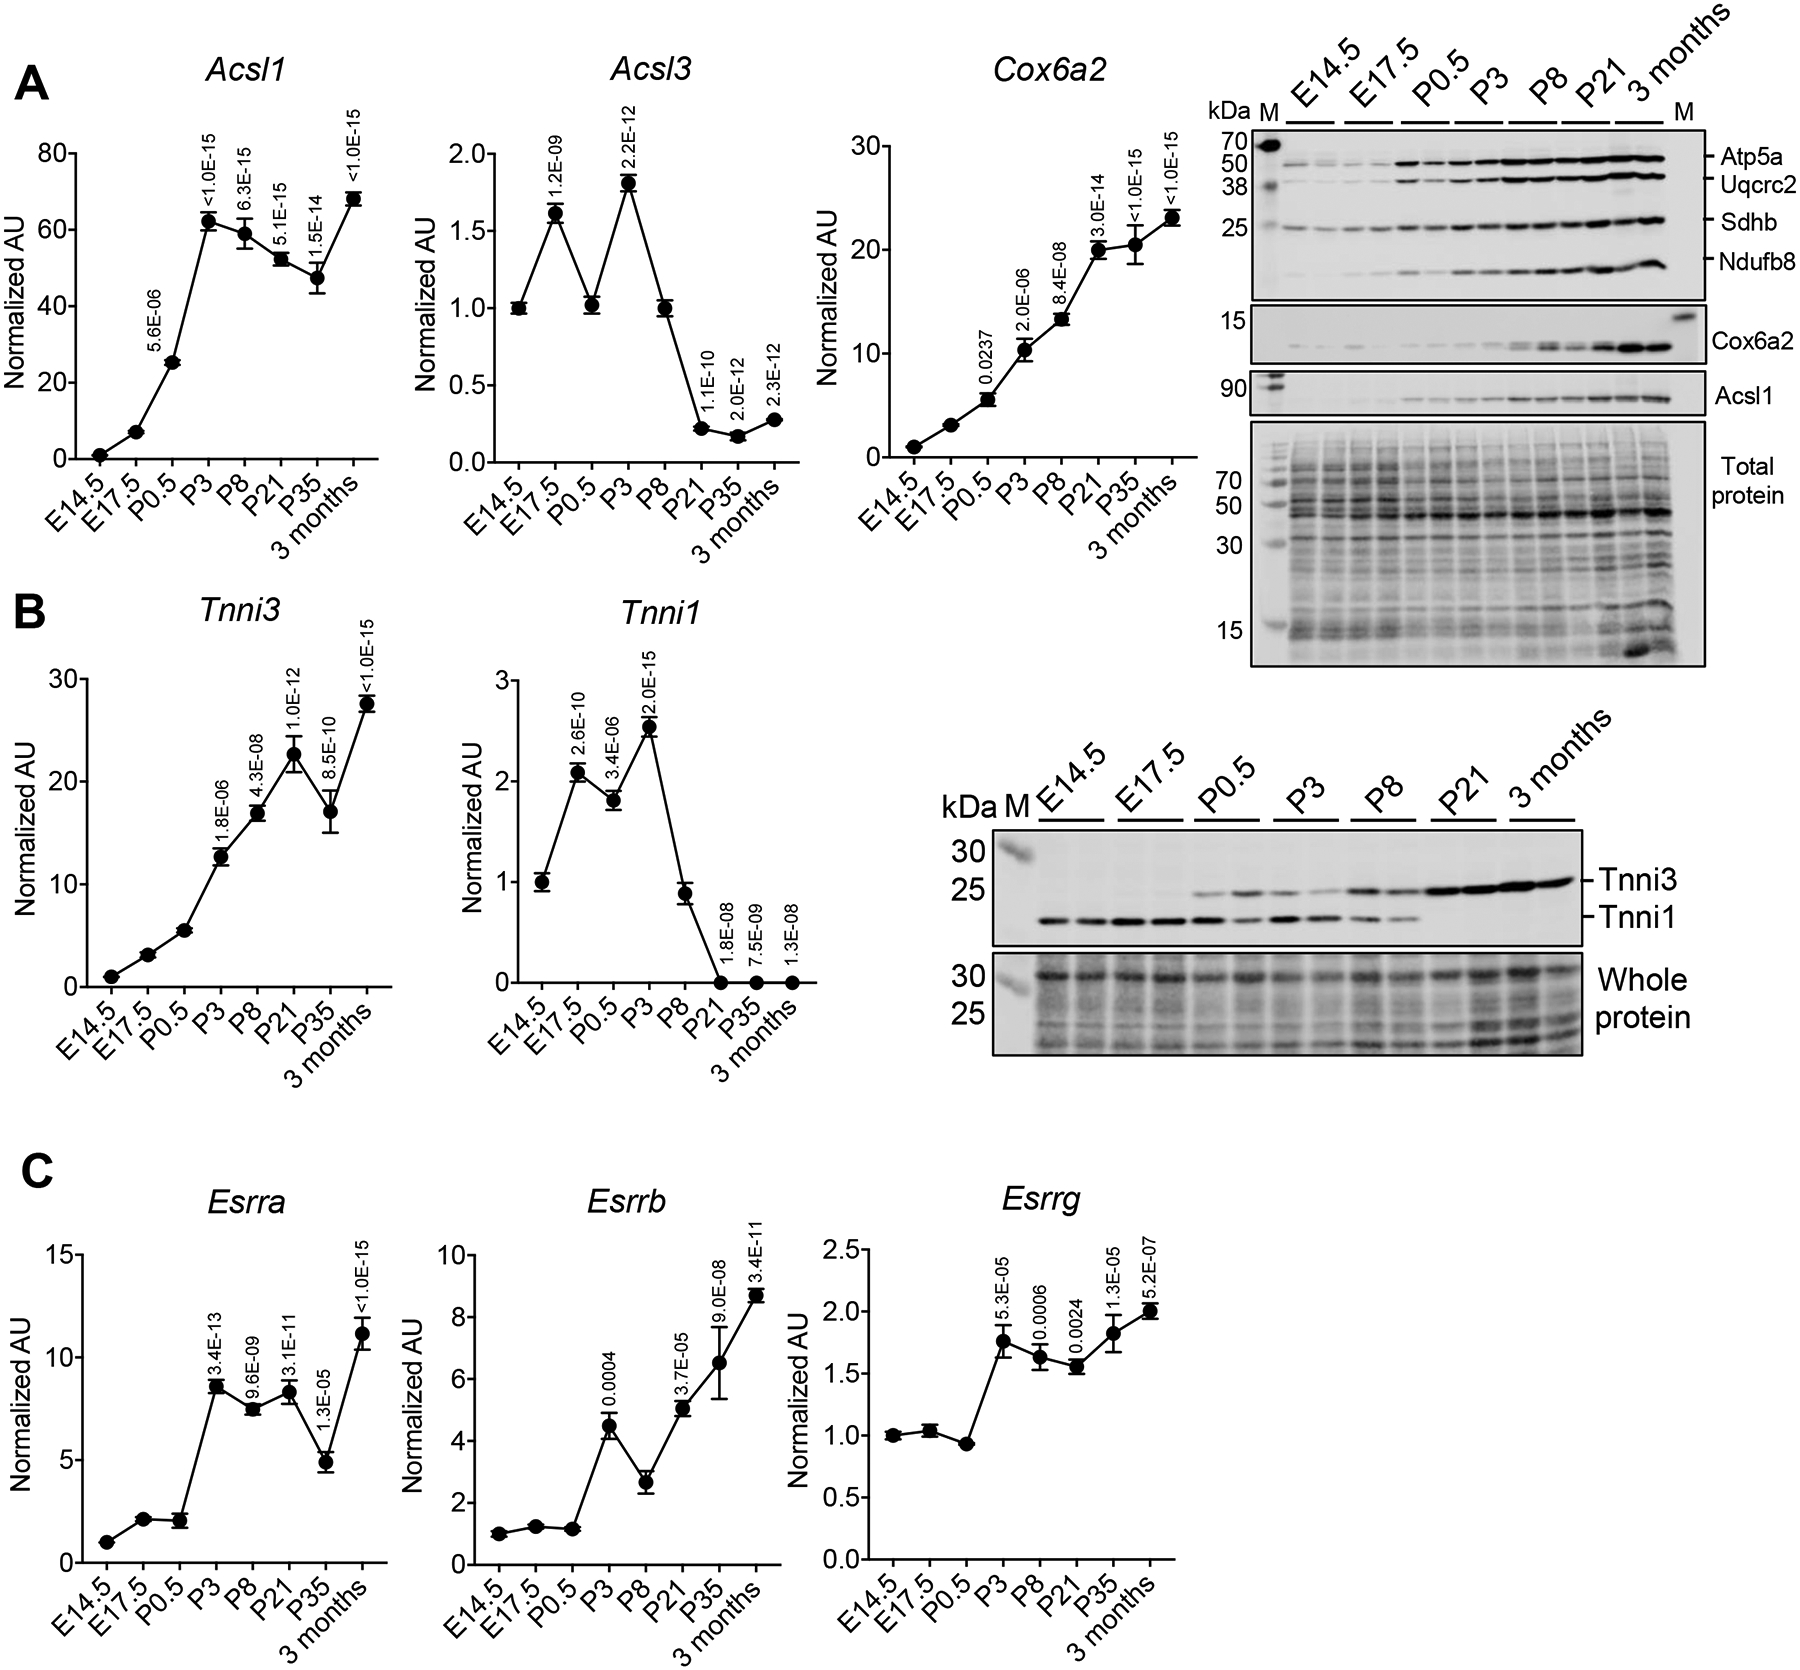
Rationale: The heart undergoes dramatic developmental changes during the prenatal to postnatal transition, including maturation of cardiac myocyte energy metabolic and contractile machinery. Delineation of the mechanisms involved in cardiac postnatal development could provide new insight into the fetal shifts that occur in the diseased heart and unveil strategies for driving maturation of stem cell-derived cardiac myocytes.

Objective: To delineate transcriptional drivers of cardiac maturation.

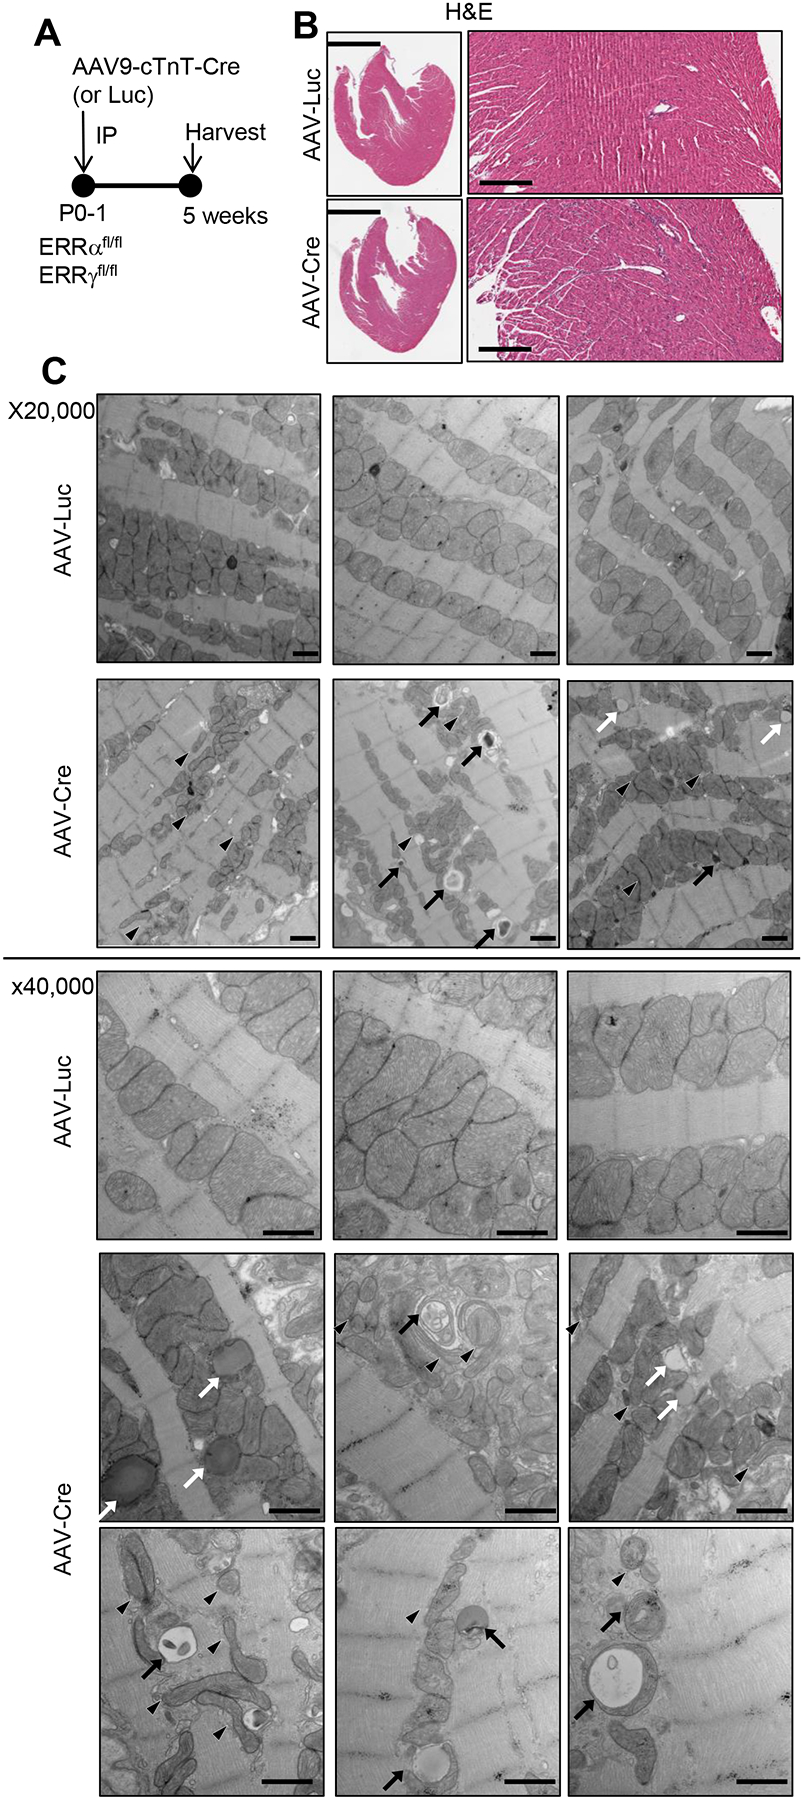
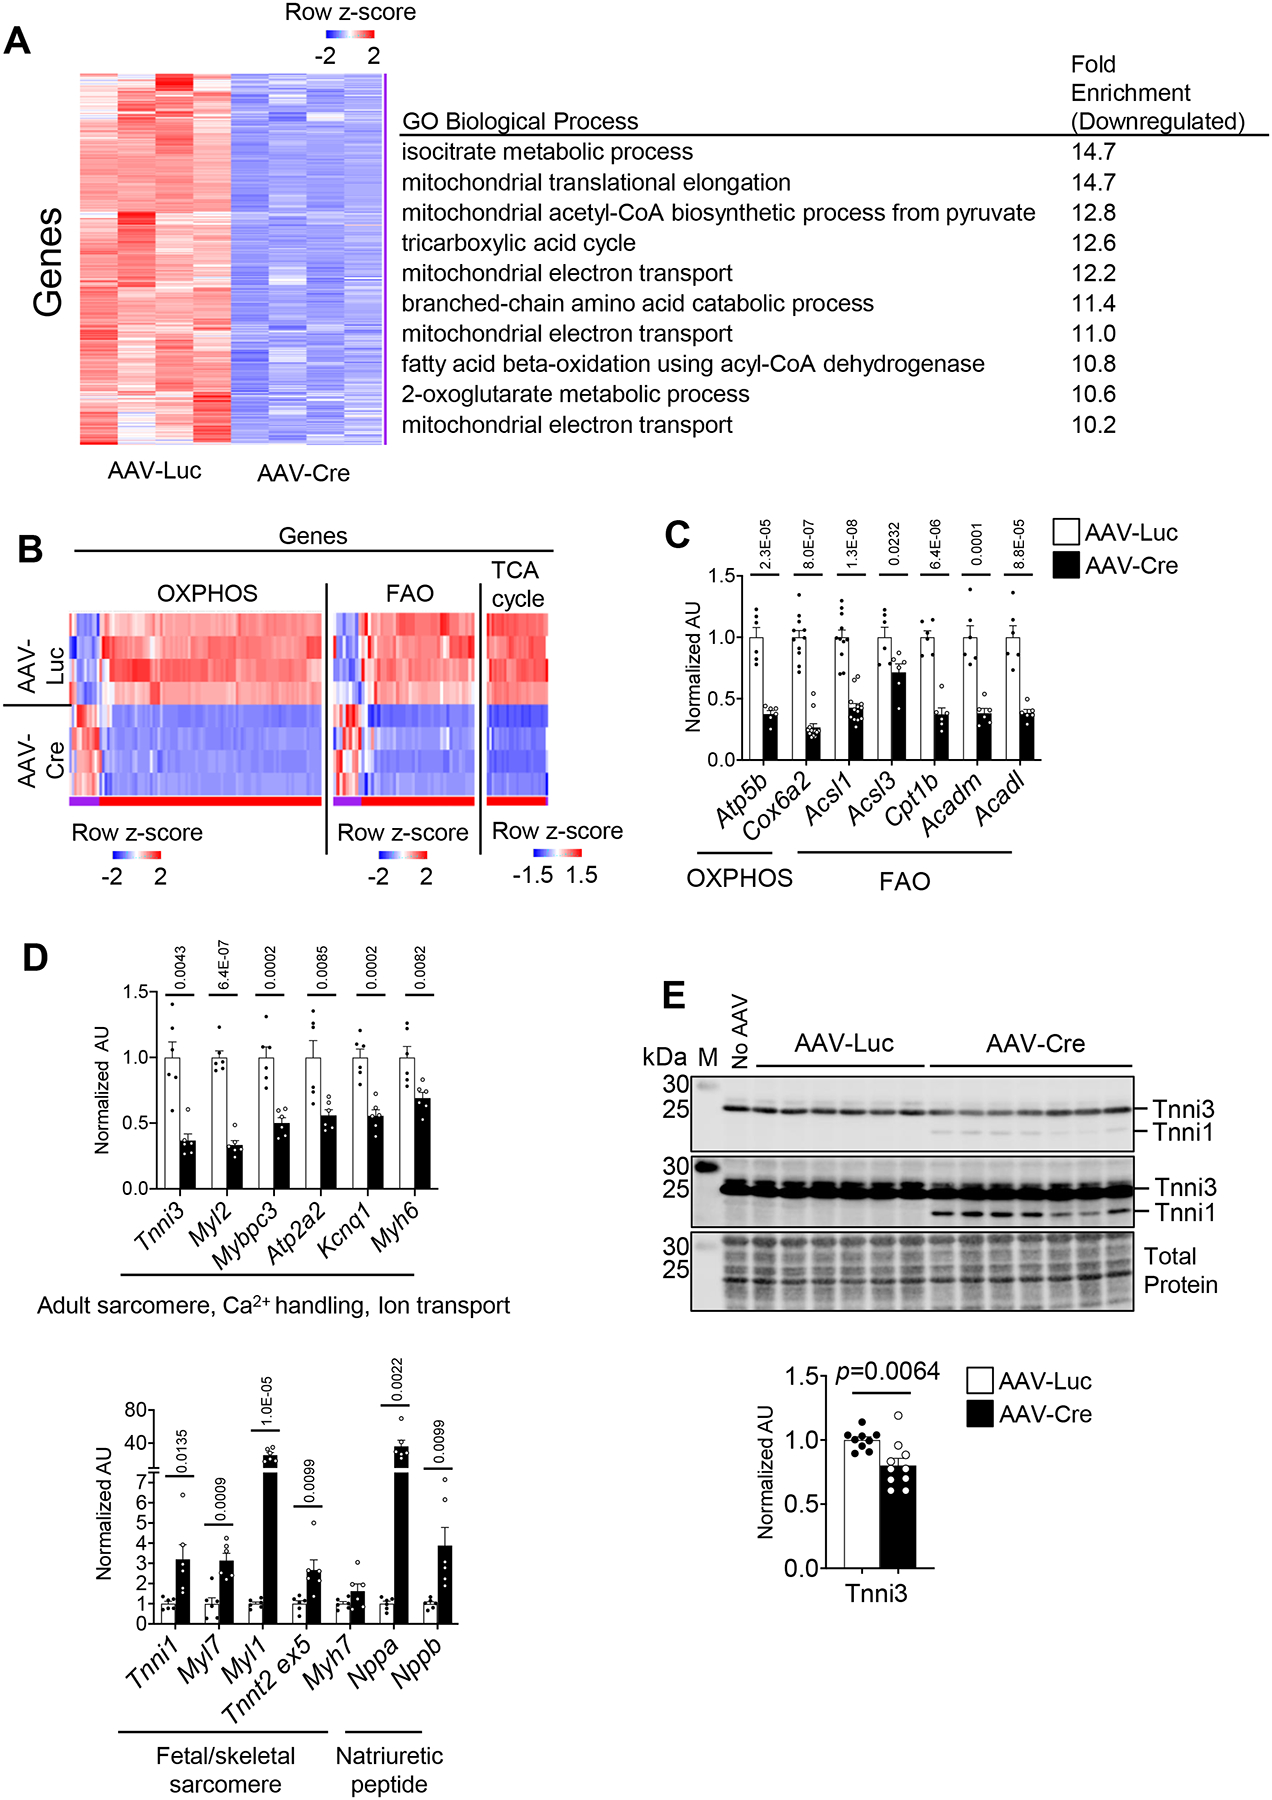
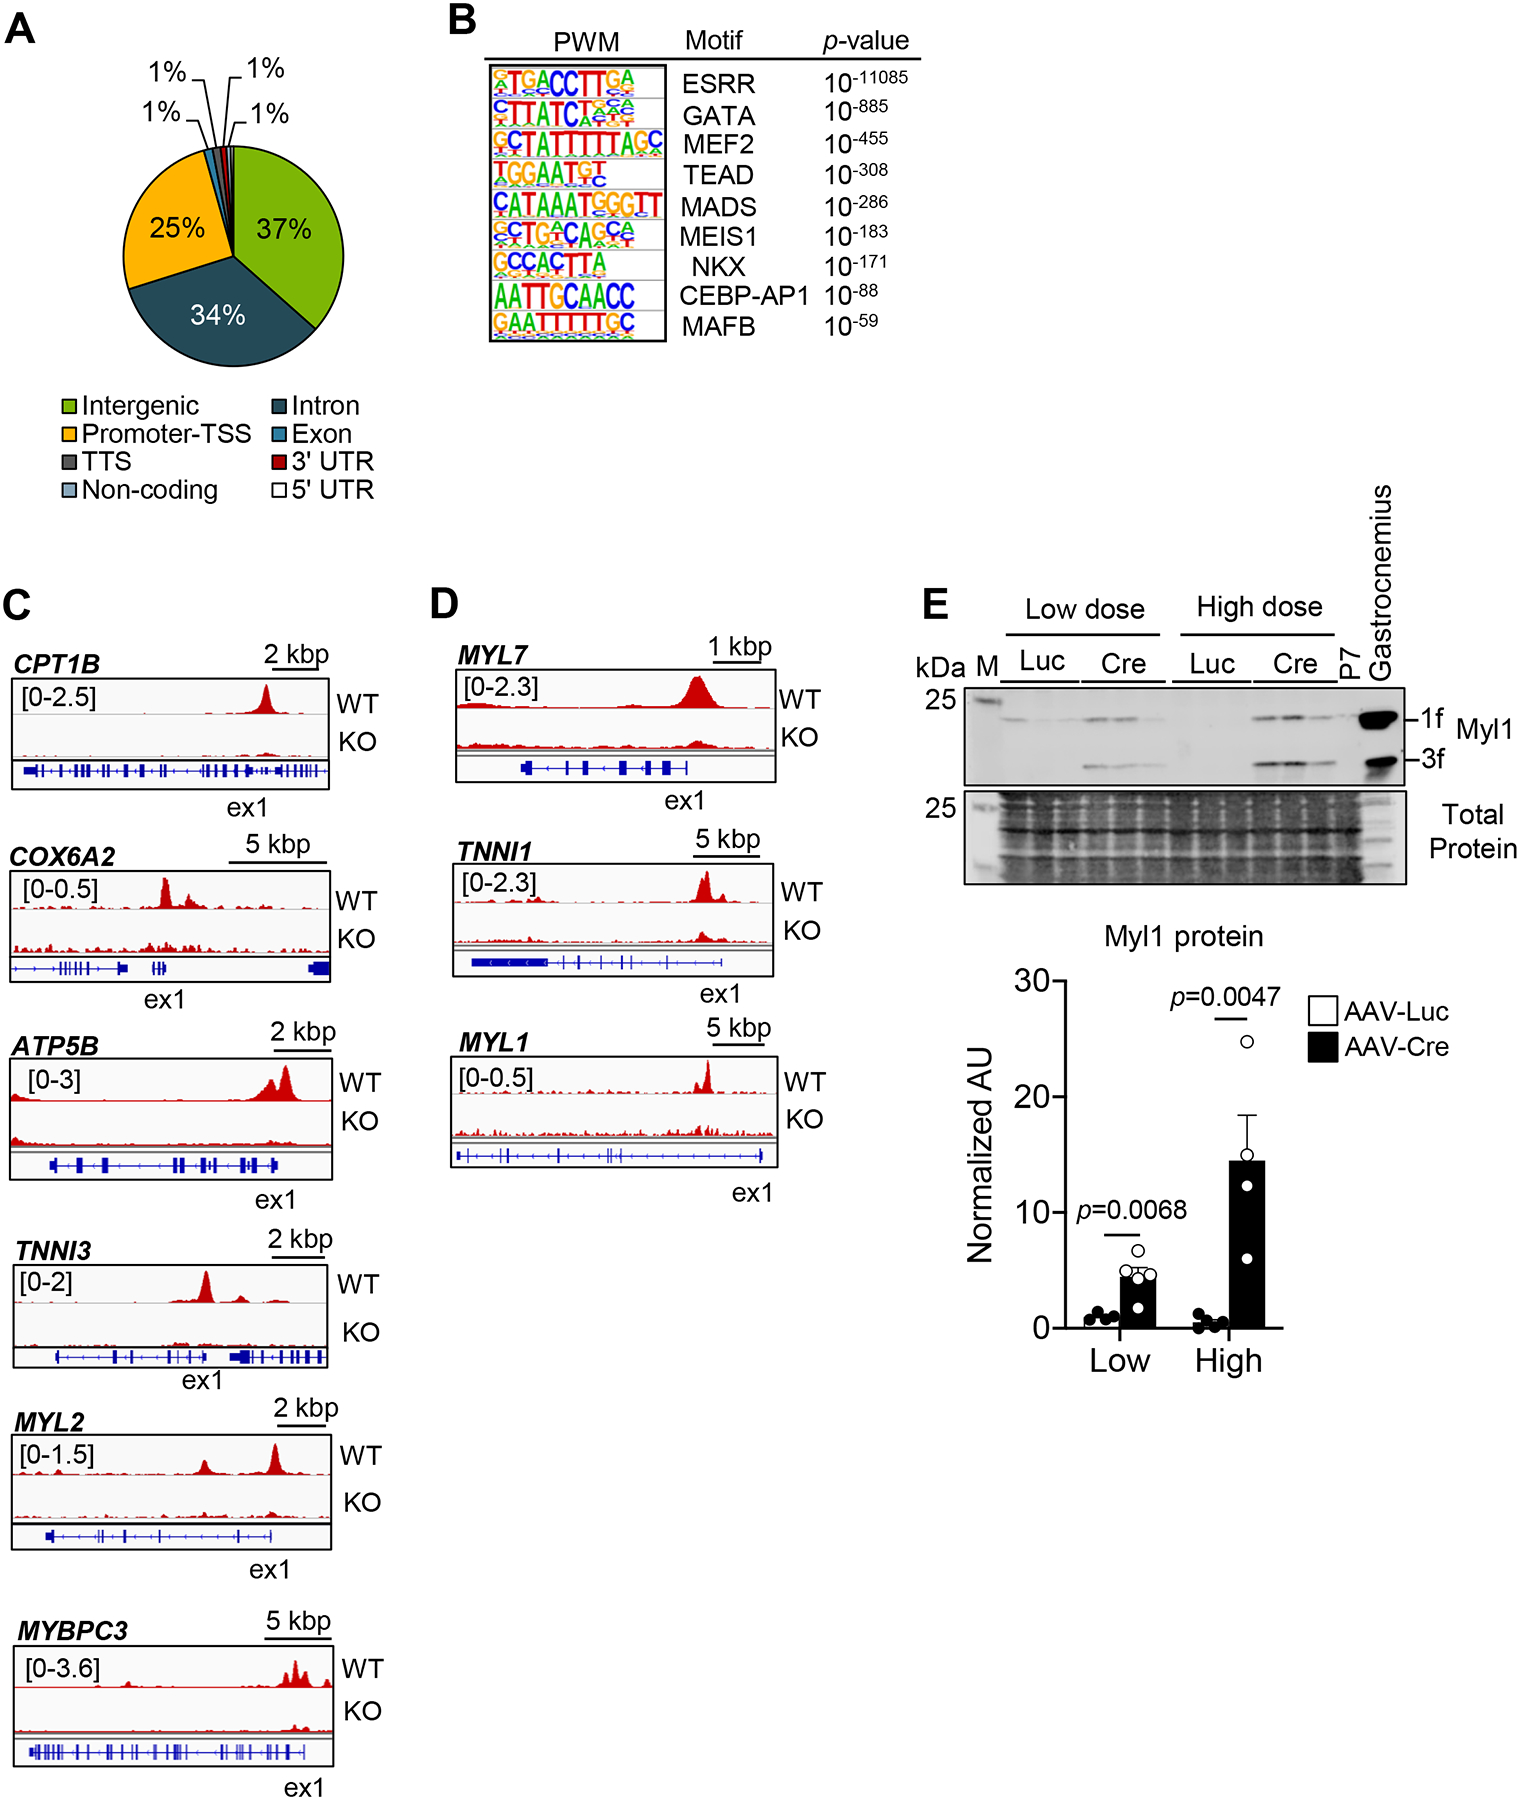
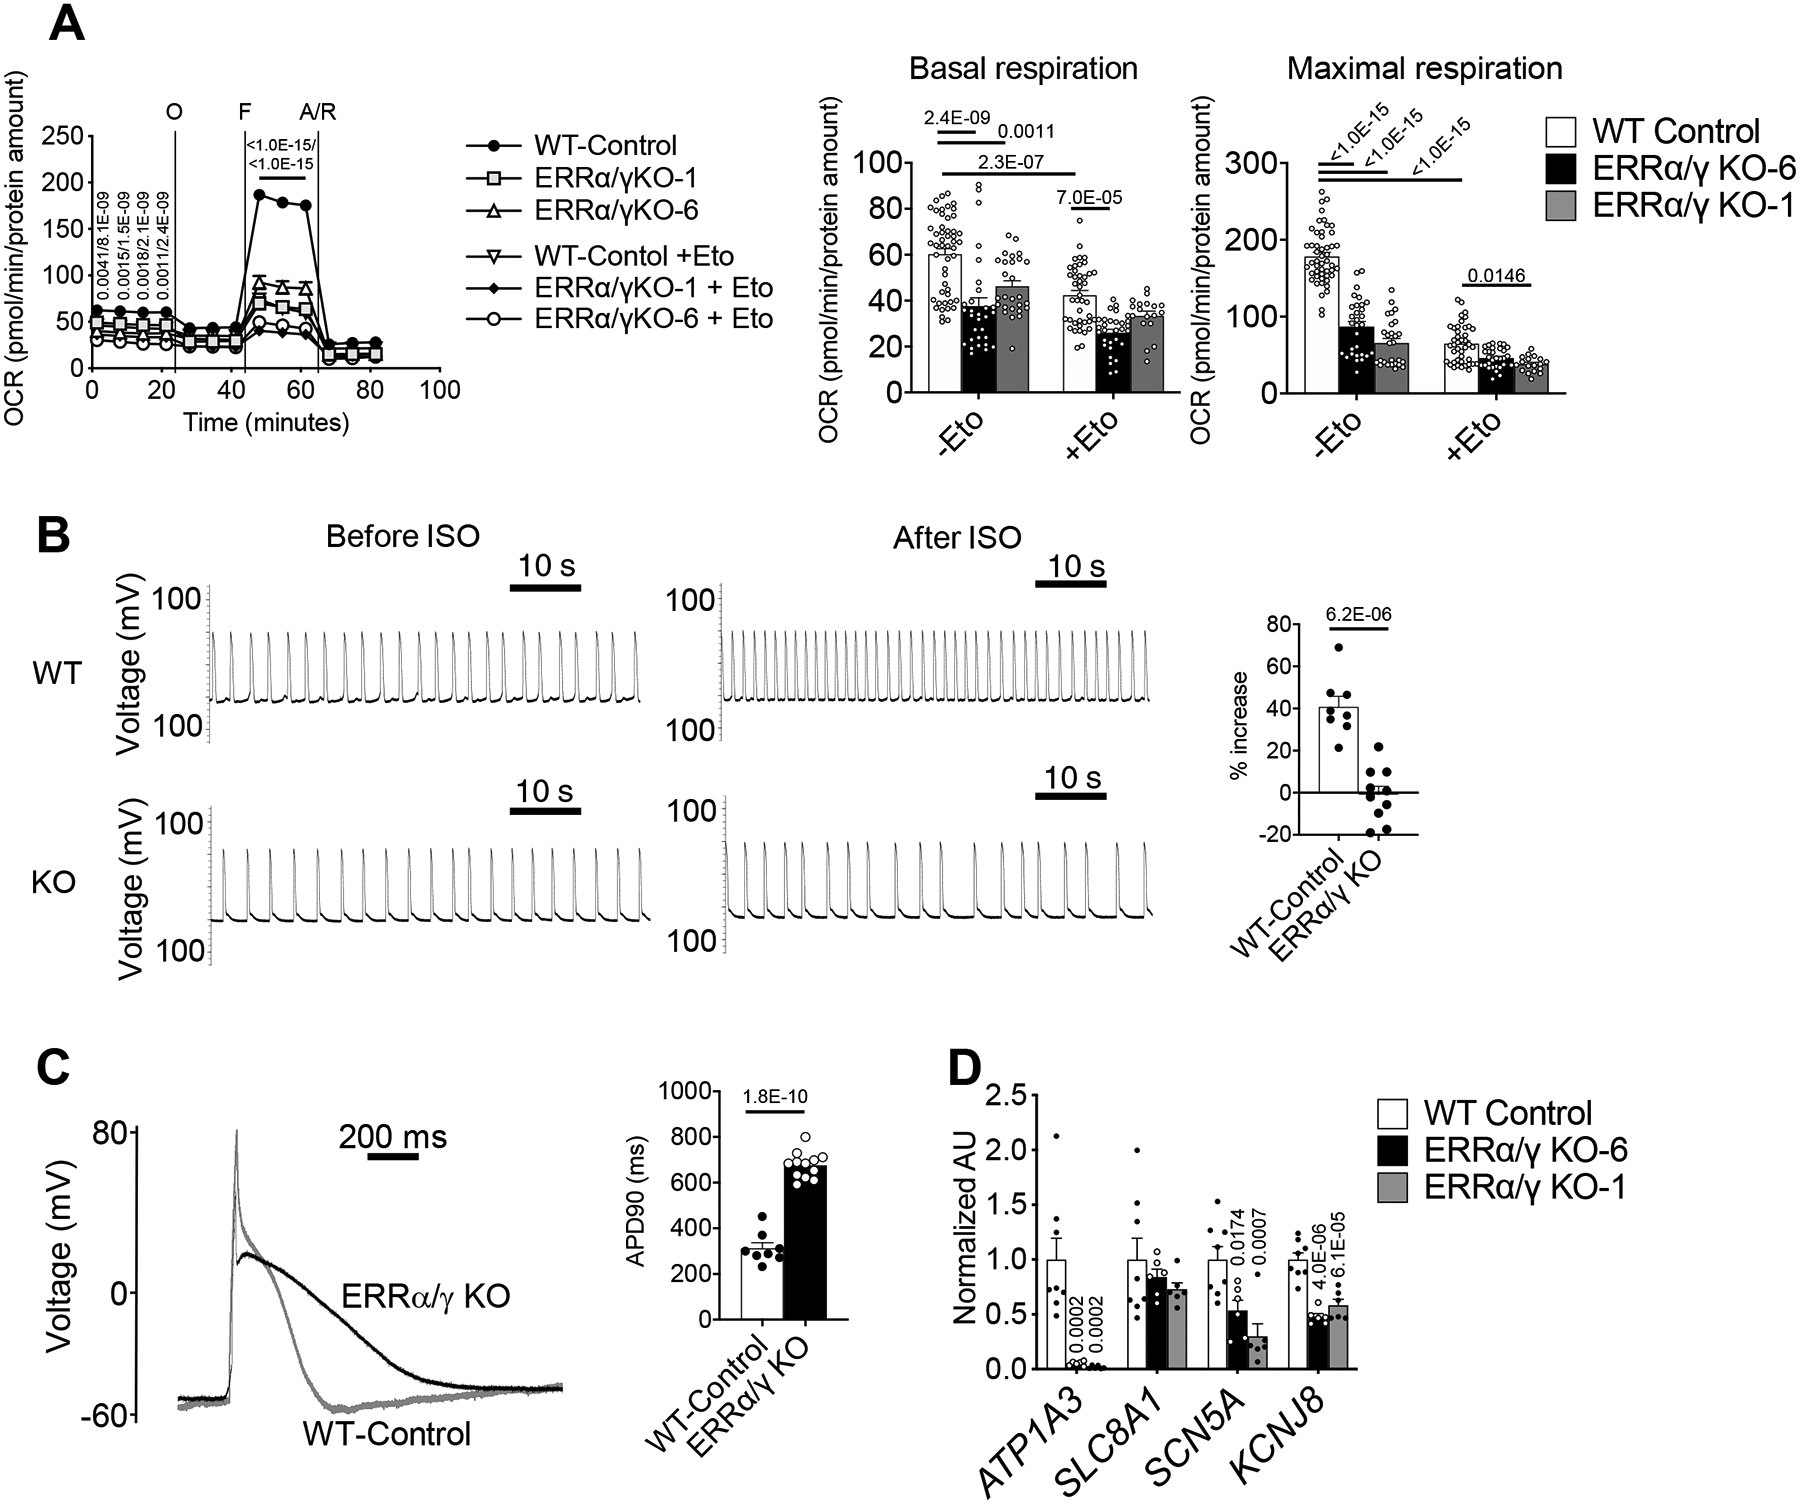
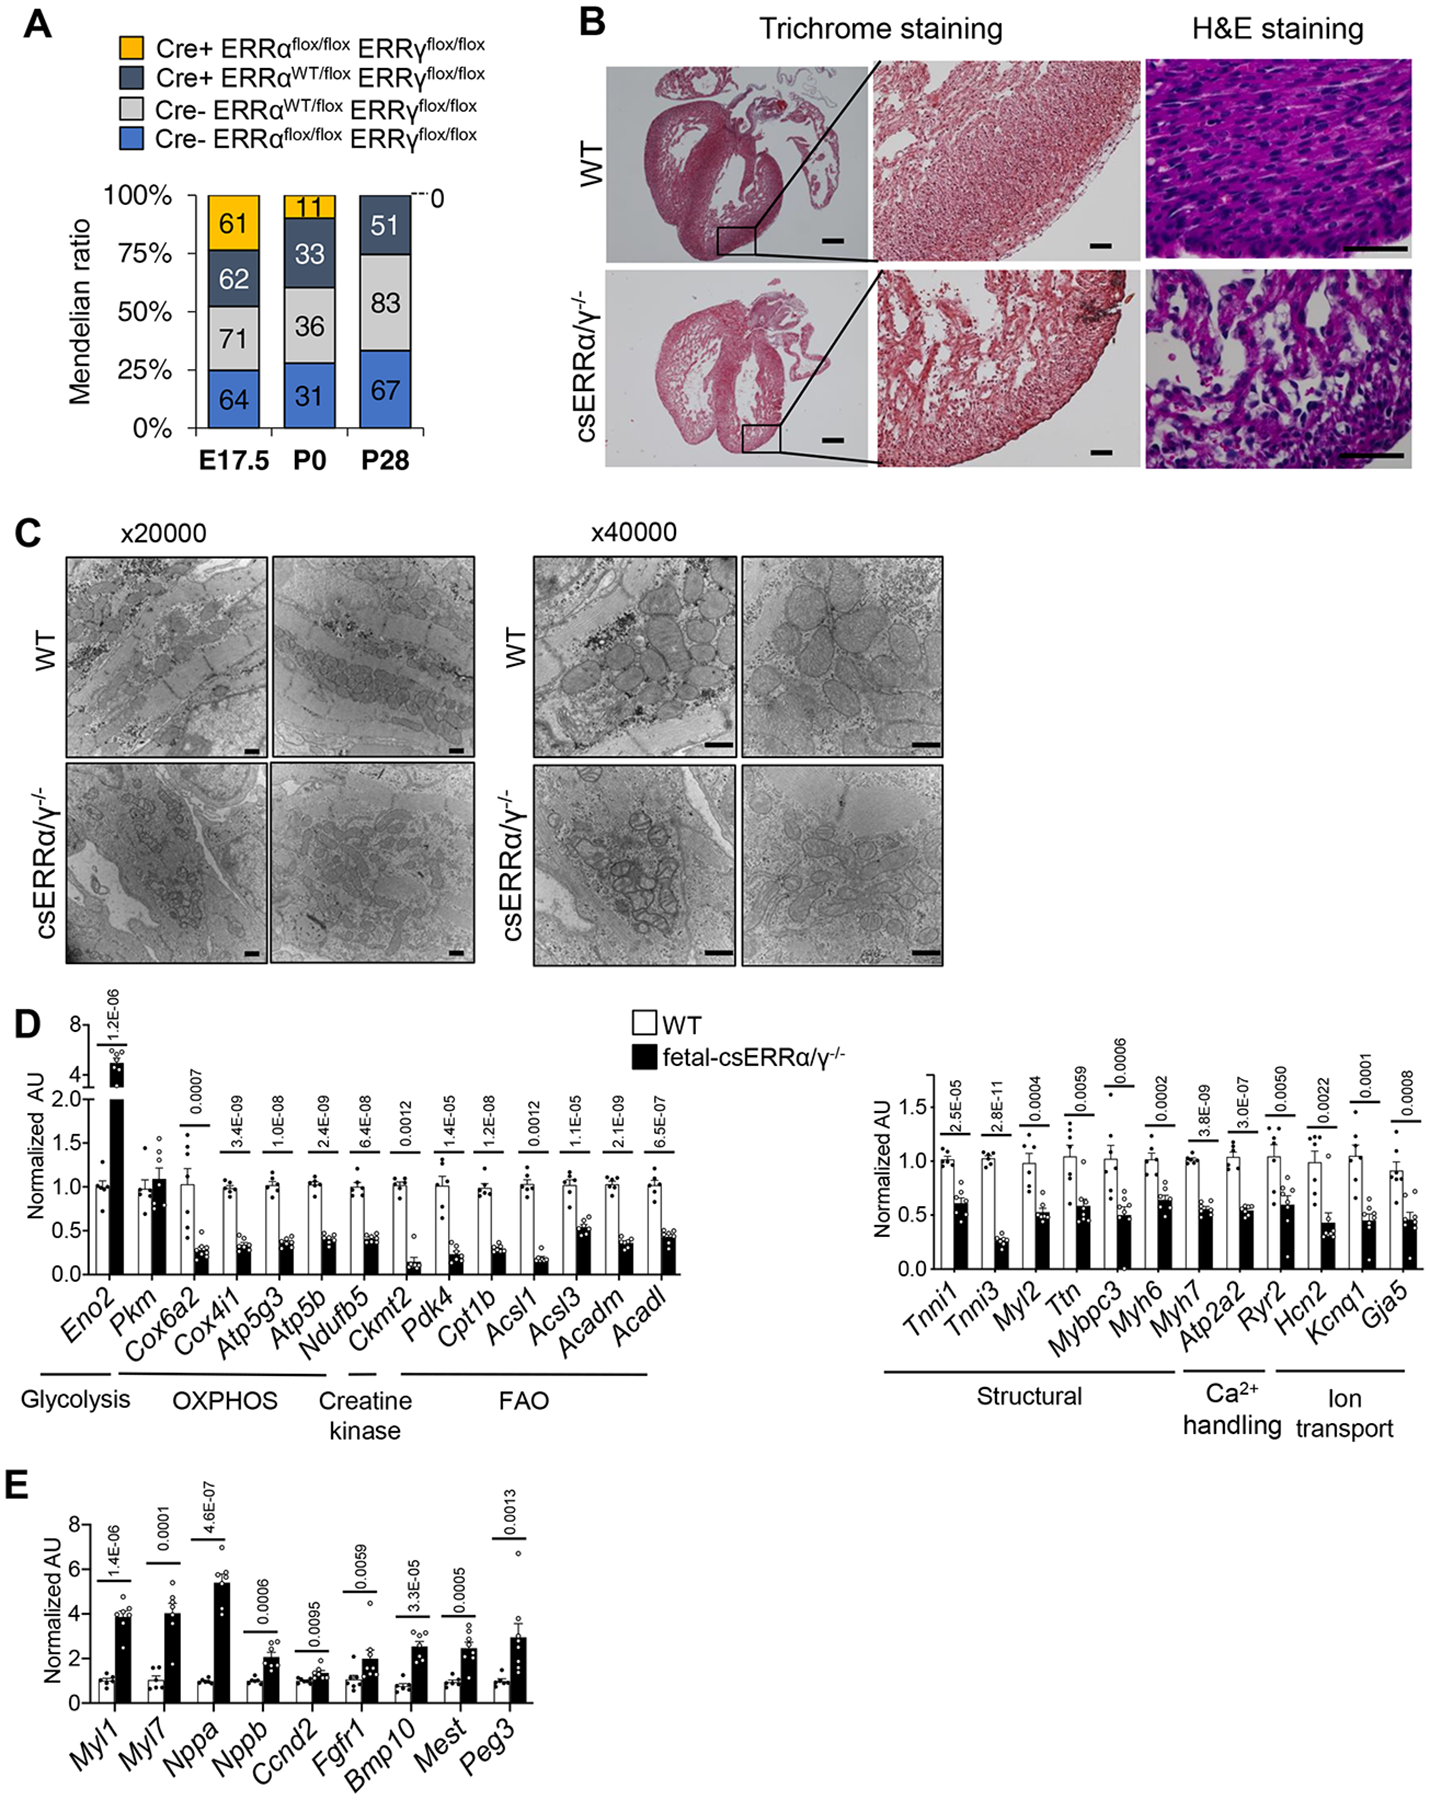
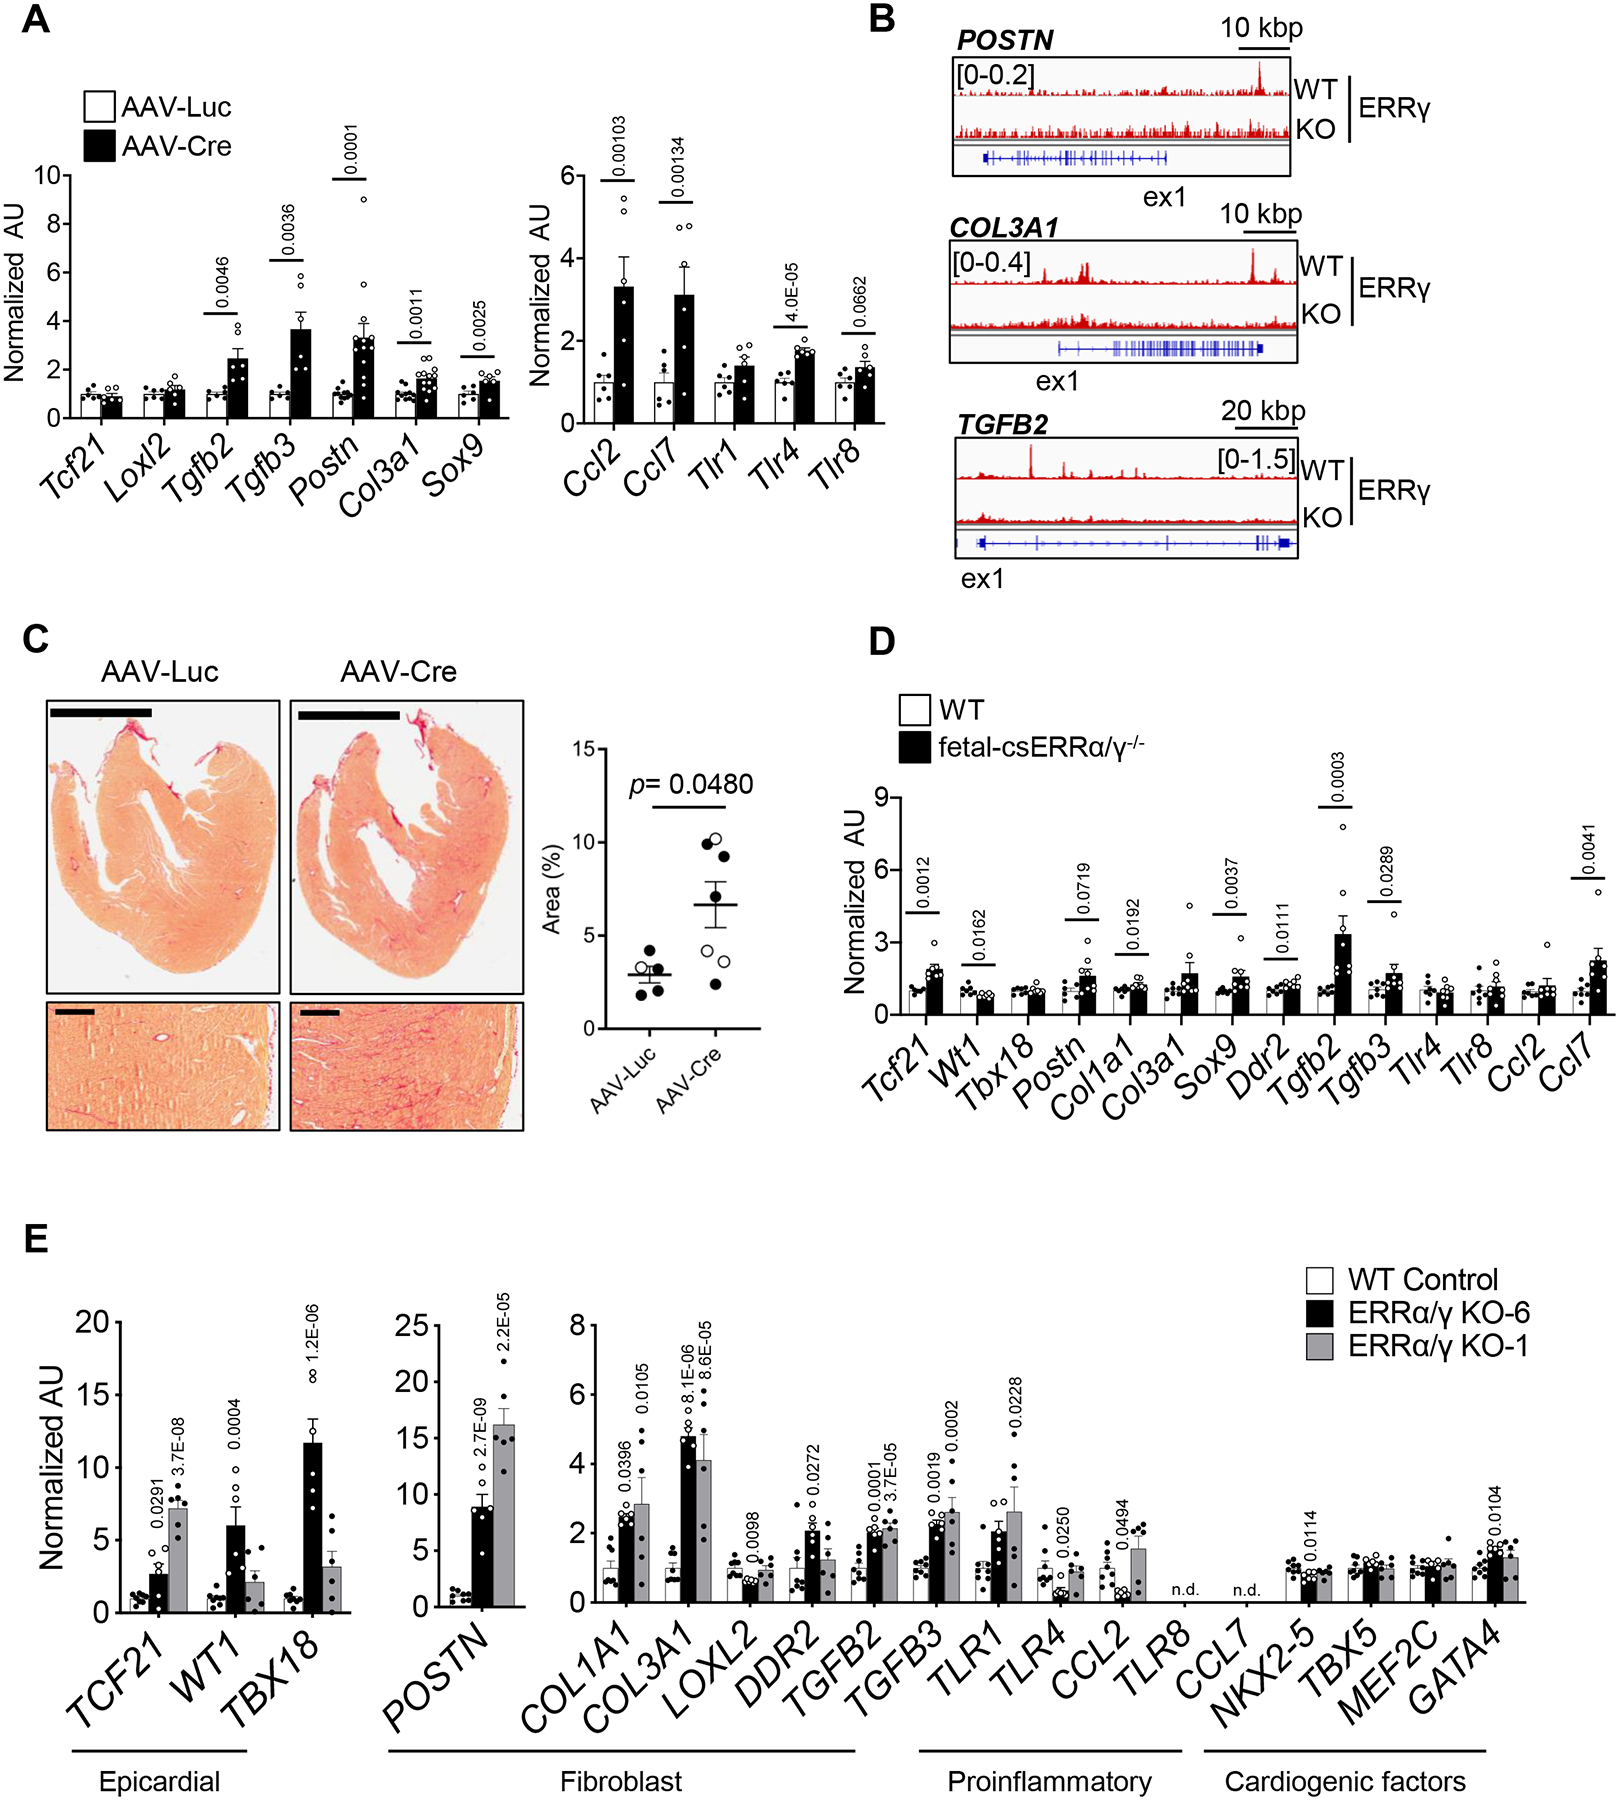
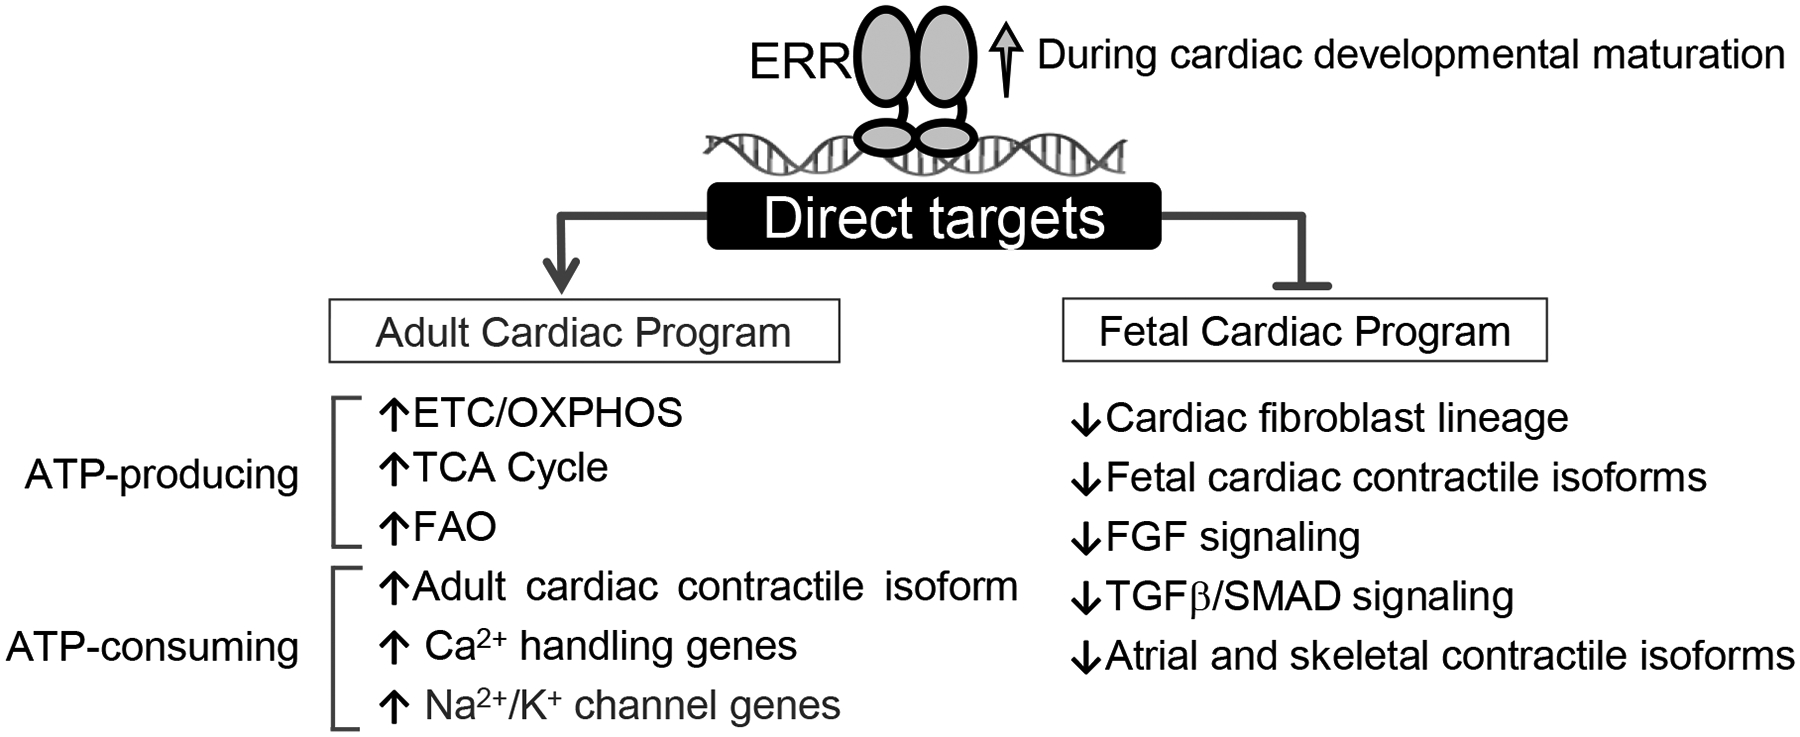
Methods and results: We hypothesized that ERR (estrogen-related receptor) α and γ, known transcriptional regulators of postnatal mitochondrial biogenesis and function, serve a role in the broader cardiac maturation program. We devised a strategy to knockdown the expression of ERRα and γ in heart after birth (pn-csERRα/γ [postnatal cardiac-specific ERRα/γ]) in mice. With high levels of knockdown, pn-csERRα/γ knockdown mice exhibited cardiomyopathy with an arrest in mitochondrial maturation. RNA sequence analysis of pn-csERRα/γ knockdown hearts at 5 weeks of age combined with chromatin immunoprecipitation with deep sequencing and functional characterization conducted in human induced pluripotent stem cell-derived cardiac myocytes (hiPSC-CM) demonstrated that ERRγ activates transcription of genes involved in virtually all aspects of postnatal developmental maturation, including mitochondrial energy transduction, contractile function, and ion transport. In addition, ERRγ was found to suppress genes involved in fibroblast activation in hearts of pn-csERRα/γ knockdown mice. Disruption of Esrra and Esrrg in mice during fetal development resulted in perinatal lethality associated with structural and genomic evidence of an arrest in cardiac maturation, including persistent expression of early developmental and noncardiac lineage gene markers including cardiac fibroblast signatures. Lastly, targeted deletion of ESRRA and ESRRG in hiPSC-CM derepressed expression of early (transcription factor 21 or TCF21) and mature (periostin, collagen type III) fibroblast gene signatures.

Conclusions: ERRα and γ are critical regulators of cardiac myocyte maturation, serving as transcriptional activators of adult cardiac metabolic and structural genes, an.d suppressors of noncardiac lineages including fibroblast determination.

Keywords: cardiomyocytes; cell differentiation; fibroblasts; genetic transcription; mitochondria; postnatal cardiac development.


Conflict of interest statement

DISCLOSURES

The authors declare no competing interests.

Figures

Figure 1.
Figure 1.. Induction of Esrr gene expression during postnatal cardiac development.
RT-qPCR-determined levels of the designated mRNAs during mouse postnatal cardiac development (from E14.5 to 3 months, n=3–5 per timepoint). Levels are shown as arbitrary units (AU) normalized to levels at E14.5 (A) Left: Levels of mRNA encoding Acsl1, Acsl3, and Cox6a2. Right: Representative immunoblot images of OXPHOS, Cox6a2, and Acsl1 proteins. Whole protein is shown as a control for loading. (B) Left: Levels of mRNA encoding Tnni3 and Tnni1. Right: Representative immunoblot image of Tnni3 and Tnni1 proteins. (C) Levels of mRNA encoding Esrra, Esrrb and Esrrg. p-values are indicated on the graphs, 1 way-ANOVA followed by Dunnett’s multiple comparisons test vs E14.5. All bars represent the mean ± SEM. Total protein staining at the corresponding molecular weight position was presented as a loading control for the representative immunoblot images. M indicates the protein marker lane. All immunoblot images were obtained with LI-COR Odyssey Fc. The qPCR raw data for Acsl1, Cox6a2, Tnni3, and Esrra are available in Online Table VIII.
Figure 2.
Figure 2.. Inducible cardiac ERRϖ/γ deficiency results in abnormalities in mitochondrial density and structure.
(A) Schematic showing the experimental timeline. AAV-Cre or AAV-Luc (control) was administered to P1 ERRα/γflox/flox pups at a dose that does not cause cardiac dysfunction as described in the text. (B) Representative H&E images of male AAV-Luc or AAV-Cre-injected 5 week-old LV. Scale bars represent 2 mm in lower magnification and 300 mm in higher magnification. (C) Representative electron microscope images of LV wall of the male or female postnatal ERR KD hearts (x20,000 and 40,000) magnification. Arrows indicate structurally abnormal mitochondria including engulfed organelles indicative of mitophagy (black arrows), and elongated or fragmented (black arrowheads). White arrows indicate droplet-like structures that may represent lipid. Scale bars represent 800 nm.
Figure 3.
Figure 3.. ERRα/γ is necessary for the postnatal cardiac maturation transcriptional program.
Whole genome RNA-seq was performed on ventricles from AAV-Luc or Cre-injected ERRα/γflox/flox. (A) Left: Heat map represents z-score of mRNA levels significantly downregulated from RNA-seq data performed on ventricles from AAV-Luc or Cre-injected ERRα/γflox/flox. 2032 genes downregulated in the Cre group are shown. Right: Significantly enriched GO Biological Process using transcripts downregulated in the AAV-Cre ventricles as compared to AAV-Luc controls. (B) Heat map represents z-score of mRNA levels of metabolic transcripts encoding OXPHOS, TCA cycle, and FAO proteins. (C) Levels of mRNA transcripts encoding energy metabolic genes, and (D) sarcomere proteins, ion channels, and natriuretic peptides in ventricles from male AAV-Luc (n=6–11) or Cre (n=6–13) -injected ERRα/γflox/flox mice as measured by RT-qPCR. p-values are indicated on the bar graphs comparing AAV-Luc vs AAV-Cre. Student’s t-test or Mann-Whitney U test was used (see Detailed Methods). Bars represent the mean ± SEM. (E) Upper: Representative immunoblot images of Tnni1/3 in 5-week old injected ERRα/γflox/flox ventricles subjected to AAV-Luc (n=6), AAV-Cre (n=7) or without AAV injection (No AAV) using an anti-pan Tnni antibody at two different exposures. Bottom: Bar graphs show the amount of Tnni3 protein expression in ERRα/γflox/flox ventricles injected with AAV-Luc (n=9) or AAV-Cre (n=10). Student’s t-test was used. M indicates the protein marker lane. Total protein staining was used as a loading control. All immunoblot images were obtained with LI-COR Odyssey Fc.
Figure 4.
Figure 4.. Analysis of the ERRγ cistrome indicates direct transcriptional control of adult cardiac metabolic and contractile protein genes.
(A) Pie chart of ERRγ peak distribution determined from whole genome ChIP-seq data. Promoter transcription start site (TSS) was defined as −5 kbp or within the first intron. (B) Significantly enriched ERRγ binding motifs as defined by PWM motif analysis. Representative genome browser tracks of ERRγ peaks on the activated-targets (C) and the suppressed-targets (D) in WT and ERRγ KO hiPSC- CMs. Number in brackets indicates RPM (reads per million). (E) Left: Representative immunoblot images of Myl1 in 5-week old injected ERRα/γflox/flox ventricles subjected with low dose AAV-Luc or AAV-Cre. Right: Bar graphs depict quantification of Myl1 immunoblot analysis conducted on samples prepared from ERRα/γflox/flox ventricles subjected to low or high dose AAV-Luc (n=4) or AAV-Cre (n=4–5). Student’s t-test was used. Gastrocnemius muscle from aged-match wild type mouse was used as a positive control for Myl1. Total protein staining was used as a loading control. M indicates the protein marker lane. All immunoblot images were obtained with LI-COR Odyssey Fc.
Figure 5.
Figure 5.. ERRα/γ drives hiPSC-CM metabolic and structural maturation.
(A) Line graph represents oxygen consumption rates (OCR) in ERRα/γ KO hiPSC-CMs and controls (WT) with or without Etomoxir from 3–5 independent experiments, WT-Control (n=50), KO-6 (n=30), KO-1 (n=27), WT-Control + Eto (n=42), KO-1 + Eto (n=18), and KO-6 + Eto (n=30) were combined. Bar graphs show the mean basal (upper) and maximal (lower) respiration with ± SEM. p-values are indicated on each graph, 2-way ANOVA with Tukey’s multiple comparison test. p-values within the line graph indicate comparisons between WT-Control vs KO-1/ WT-Control vs KO-6. The OCR raw data is available in Online Table IX. (B) Representative spontaneous (left) and isoproterenol (Iso)-stimulated (right) action potential tracings of WT and ERRα/γ iPSC-CMs (line 1). Bar graph represents % rate increase to 1 μmol/L Iso in WT (n=8) and ERRα/γ iPSC-CMs line 1 (n=10). Error bars indicate SEM. Student’s t-test was used. (C) Representative tracing of the alteration in cell membrane potential during whole-cell patch clamp analysis. Quantification of the APD90 in WT (n=8) and ERRα/γ KO hiPSC-CMs line 1 (n=10) is presented in the bar graph. Student’s t-test was used. (D) Levels of mRNA transcripts encoding ion transport in ERRα/γ hiPSC-CMs as measured by RT-qPCR. p-values are indicated on each graph vs WT, 1-way ANOVA with Dunnet’s multiple comparisons test. Bars represent the mean ± SEM.
Figure 6.
Figure 6.. ERRα/γ is necessary for the cardiac developmental maturation in vivo.
(A) Distribution of genotypes at indicated gestational ages in Cre- ERRαflox/flox ERRγflox/flox (WT), Cre- ERRαWT/flox ERRγflox/flox, Cre+ ERRαWT/flox ERRγflox/flox and Cre+ ERRαflox/flox ERRγflox/flox (fetal-csERRα/γ−/−) at E17.5 (n=258), P0 (n=111) and P28 (n=201). The numbers in each bar graph indicate the actual viable embryo or mouse number observed. Mendelian ratio (%) is shown on y-axis. At P0, chi squared =13.937 with 3 degrees of freedom. The two-tailed p value = 0.0030. At P28, chi squared = 48.467 with 3 degrees of freedom. The two-tailed p value < 0.0001. (B) Representative Masson Trichrome and H&E images of E17.5 hearts of littermate WT and fetal-csERRα/γ−/− mice. Scale bars represent 250 mm and 50 mm in the lower and higher magnification images respectively. (C) Representative electron microscope images of LV wall of E17.5 fetal-csERRα/γ−/− mice (x20,000 and 40,000) magnification. Scale bars represent 500 nm. Levels of mRNA transcripts encoding (D) energy metabolic, sarcomeric, ion transport, and Ca2+ handling protein genes as well as (E) the genes related to early cardiac development in E17.5 ventricles of control WT (n=6–7) and littermate fetal-csERRα/γ−/− mice (n=7–8) as measured by RT-qPCR. p-values are indicated on each graph vs WT. Student’s t-test or Mann-Whitney U test was used (see Detailed Methods). Bars represent the mean ± SEM.
Figure 7.
Figure 7.. Loss of ERRα/γ induced fibroblast-lineage gene expression in cardiomyocytes.
(A) Levels of mRNA transcripts encoding fibroblast and proinflammatory genes determined by RT-qPCR in ventricles from male pn-csERRα/γ KD mice and AAV-Luc-injected littermate controls (n=5–11) or Cre (n=7–13)-injected ERRα/γflox/flox mice as measured by RT-qPCR. p-values are indicated on the bar graphs vs AAV-Luc. Student’s t-test or Mann-Whitney U test was used (see Detailed Methods). Bars represent the mean ± SEM. (B) Representative genome browser tracks of ERRγ peaks on the suppressed-targets in WT and ERRγ KO hiPSC- CMs. Number in brackets indicates RPM (reads per million). (C) Left: Representative images of Picro Sirius Red staining of whole ventricles and LV free wall from AAV-Luc or Cre-injected ERRα/γflox/flox . Scale bars represent 2 mm (lower magnification) and 200 mm (higher magnification). Right: Bar graphs show the amount of % of Picro Sirius Red staining in ERRα/γflox/flox ventricles subjected with AAV-Luc or AAV-Cre. Open symbol indicates female, closed symbol indicates male. Mann-Whitney U test was used. (D) Levels of transcripts of ERR suppressed-targets involved in early development including genes involved in fetal contractile machinery, epicardial development, signaling and fibroblast processes in E17.5 ventricles of control WT (n=6–7) and littermate fetal-csERRα/γ−/− (n=7–8) mice as measured by RT-qPCR. p-values are indicated on the bar graphs vs WT. Student’s t-test or Mann-Whitney U test was used (see Detailed Methods). Bars represent the mean ± SEM. (E) Levels of mRNA transcripts encoding fibroblast, epicardial, and cardiac lineage markers in WT (n=8) or ERRα/γ KO hiPSC-CMs from two distinct ERRα/γ KO hiPSC lines (KO6, KO1; n=6) as measured by RT-qPCR. p-values are indicated on the bar graphs vs WT, 1-way ANOVA with Dunnet’s multiple comparisons test. Bars represent the mean ± SEM. n.d equals non-detectable.
Figure 8.
Figure 8.. Activation of ERRα/γ is required for cardiomyocyte maturation.
Schematic for proposed ERR functions as transcriptional activator and suppressor during cardiac developmental maturation.

Comment in

  • ERRing on the Side of a Mature Heart.
    Major JL, Bagchi RA, McKinsey TA. Major JL, et al. Circ Res. 2020 Jun 5;126(12):1703-1705. doi: 10.1161/CIRCRESAHA.120.317052. Epub 2020 Jun 4. Circ Res. 2020. PMID: 32496915 No abstract available.

References

    1. Galdos FX, Guo Y, Paige SL, VanDusen NJ, Wu SM and Pu WT. Cardiac Regeneration: Lessons From Development. Circ Res. 2017;120:941–959. - PMC - PubMed
    1. Kannan S and Kwon C. Regulation of cardiomyocyte maturation during critical perinatal window. J Physiol. 2018. - PMC - PubMed
    1. Srivastava D and Olson EN. A genetic blueprint for cardiac development. Nature. 2000;407:221–6. - PubMed
    1. Srivastava D Making or breaking the heart: from lineage determination to morphogenesis. Cell. 2006;126:1037–48. - PubMed
    1. Sahara M, Santoro F and Chien KR. Programming and reprogramming a human heart cell. EMBO J. 2015;34:710–38. - PMC - PubMed

Publication types

MeSH terms

Substances