. 2020 May 7;78(3):554-565.e7.
doi: 10.1016/j.molcel.2020.03.003. Epub 2020 Mar 25.

Ultrastructural Details of Mammalian Chromosome Architecture

Affiliations

Ultrastructural Details of Mammalian Chromosome Architecture

Nils Krietenstein et al. Mol Cell. .

Abstract

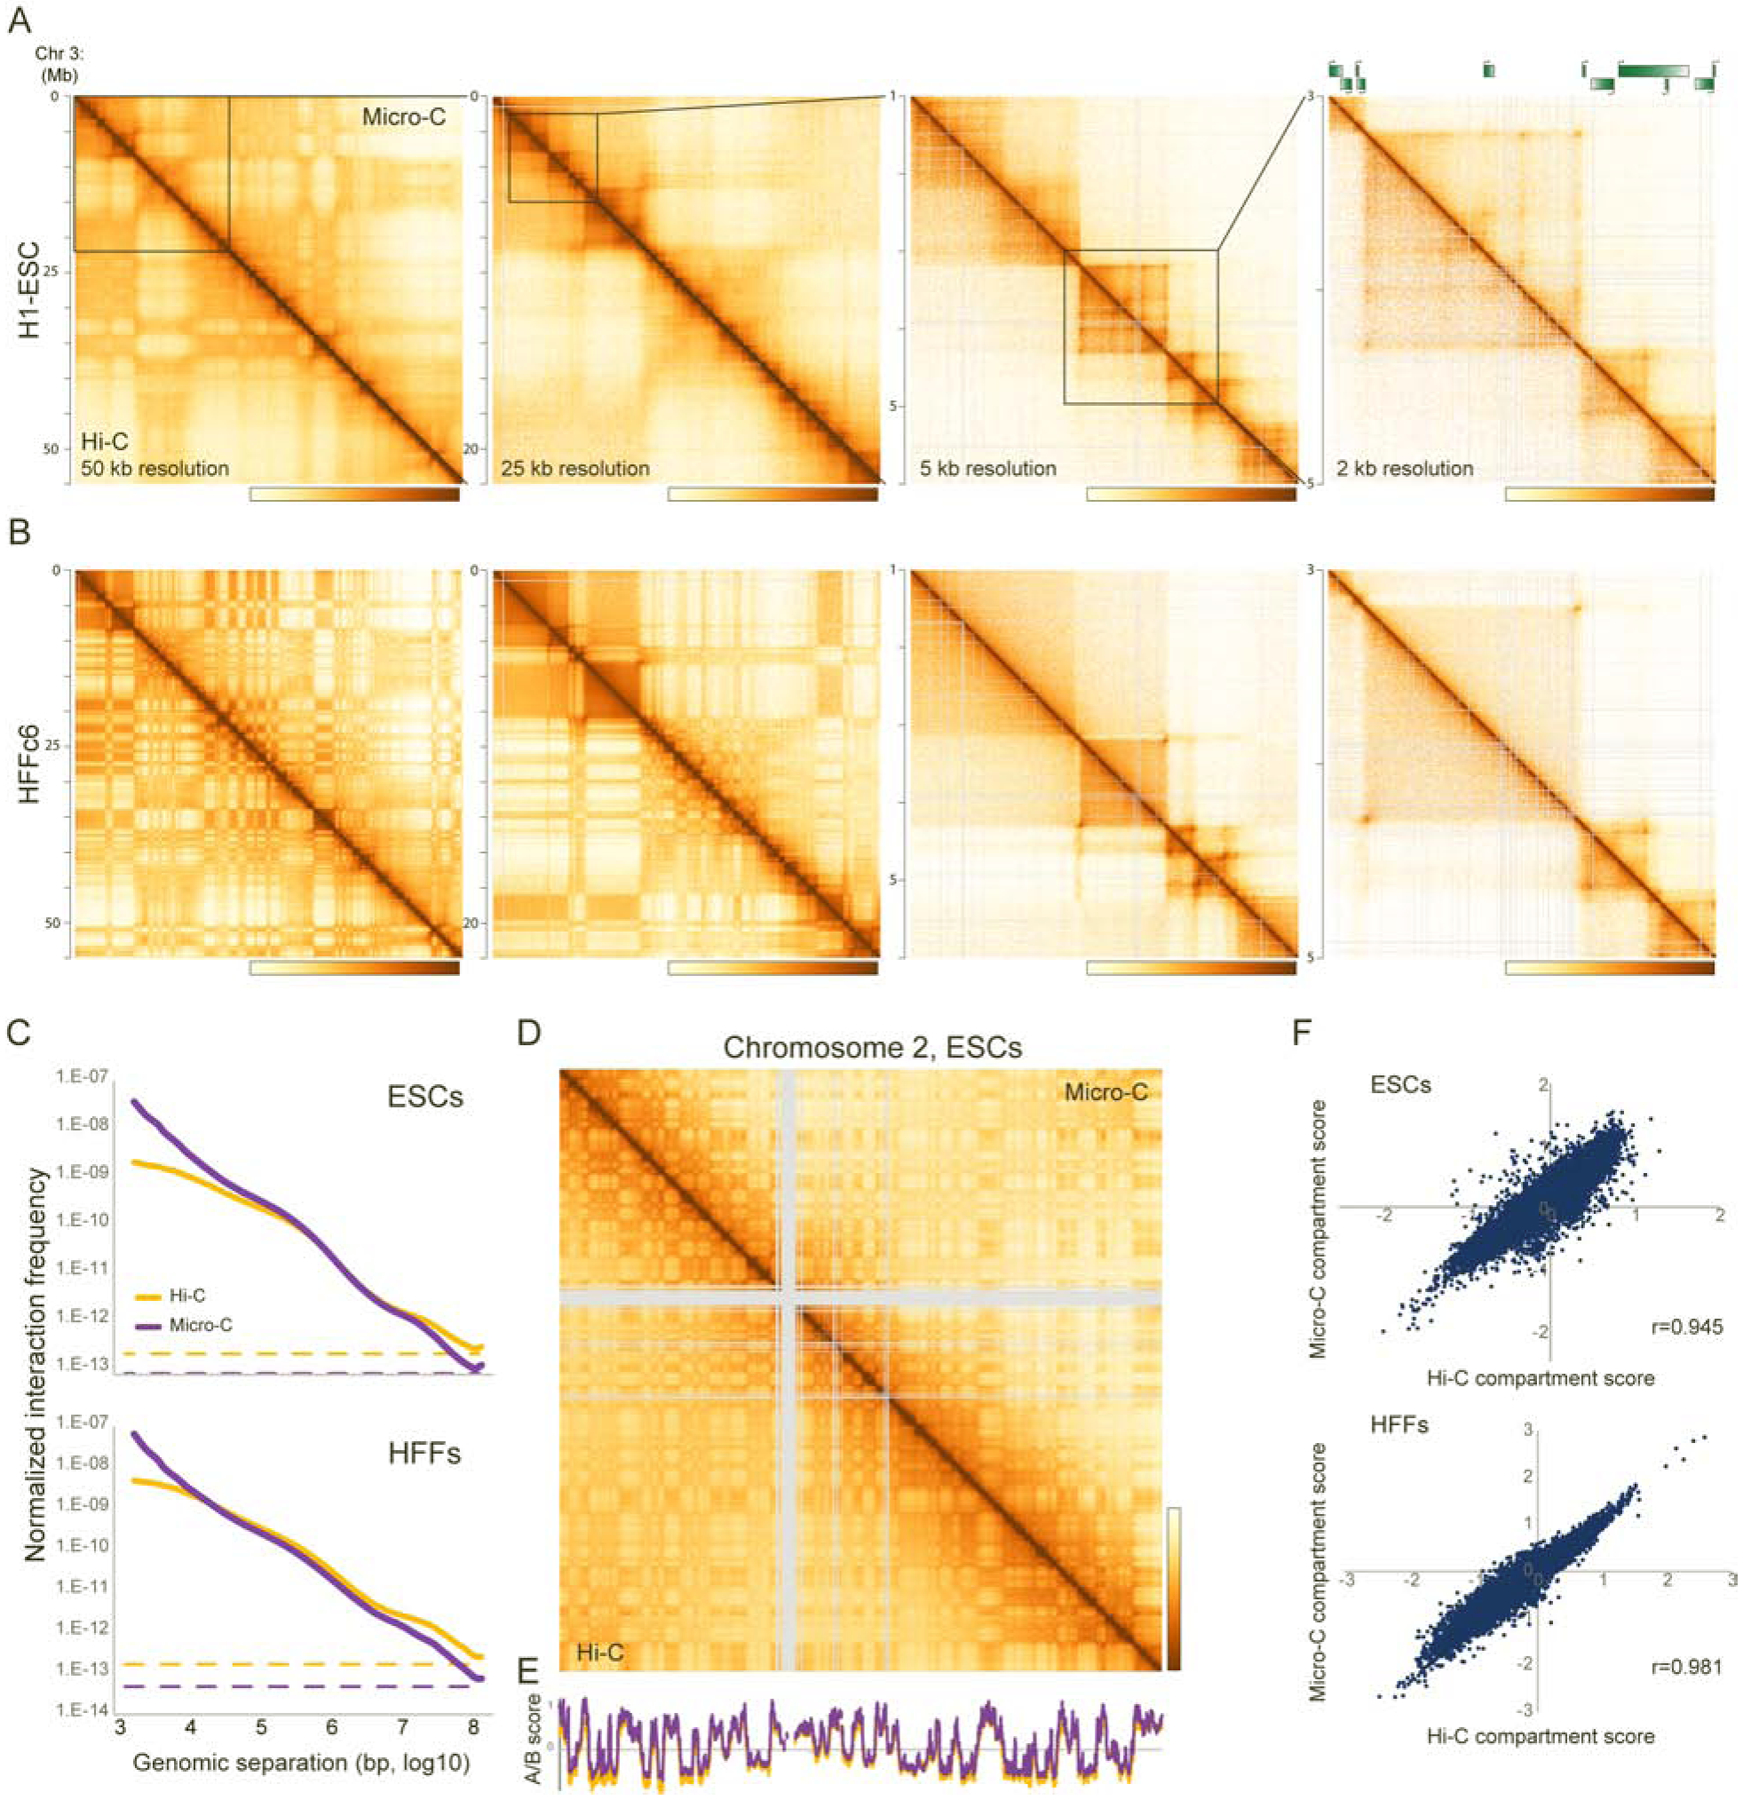
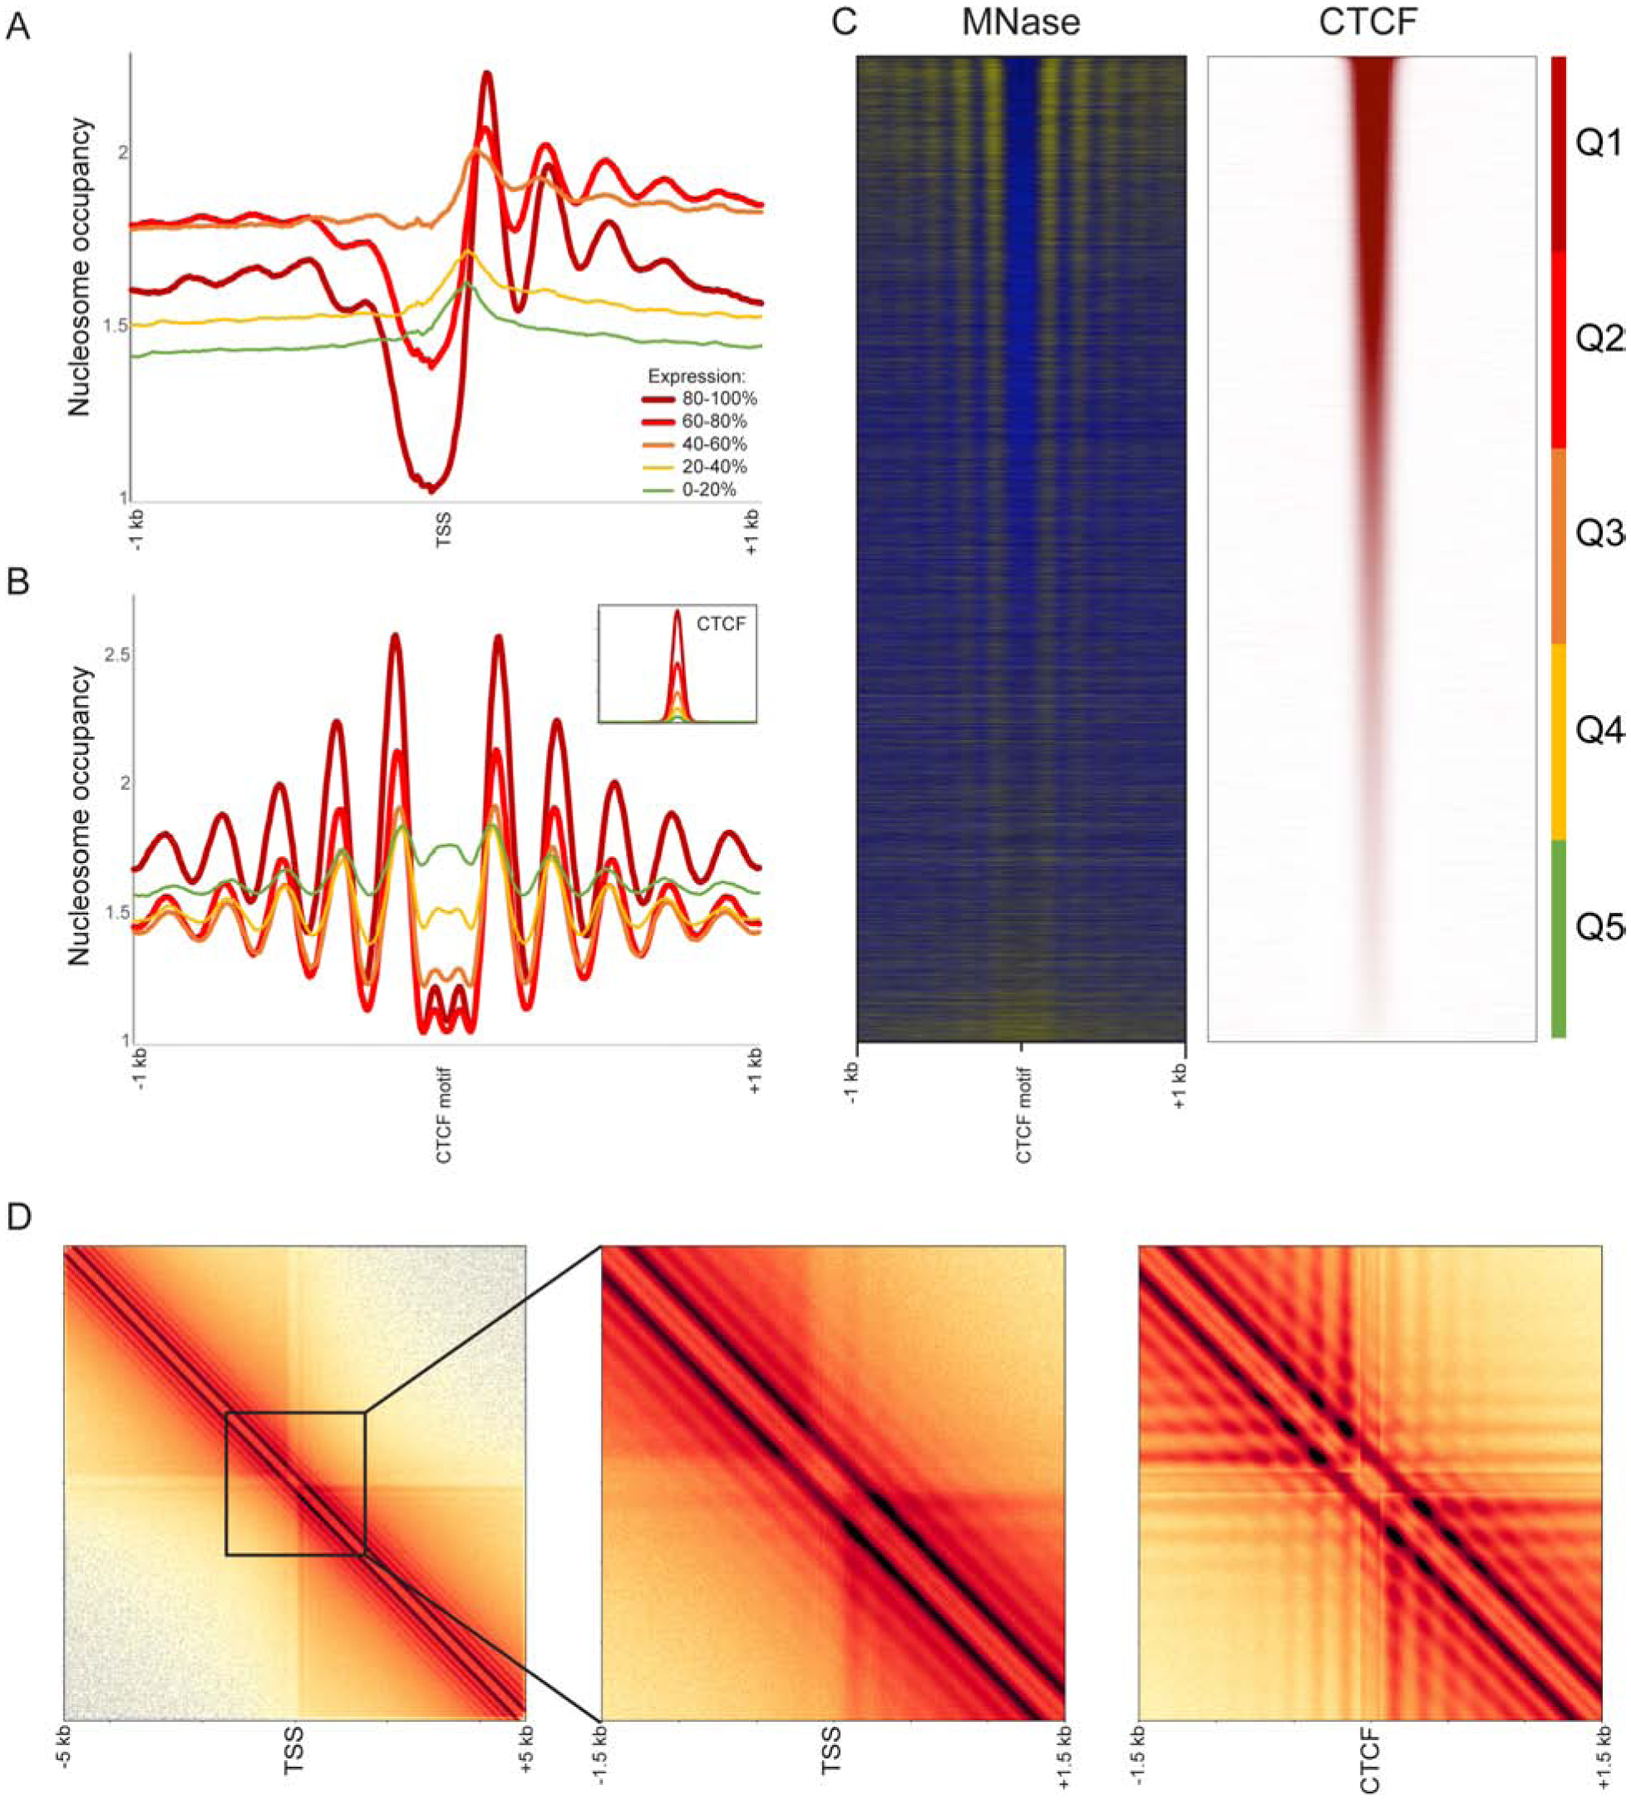
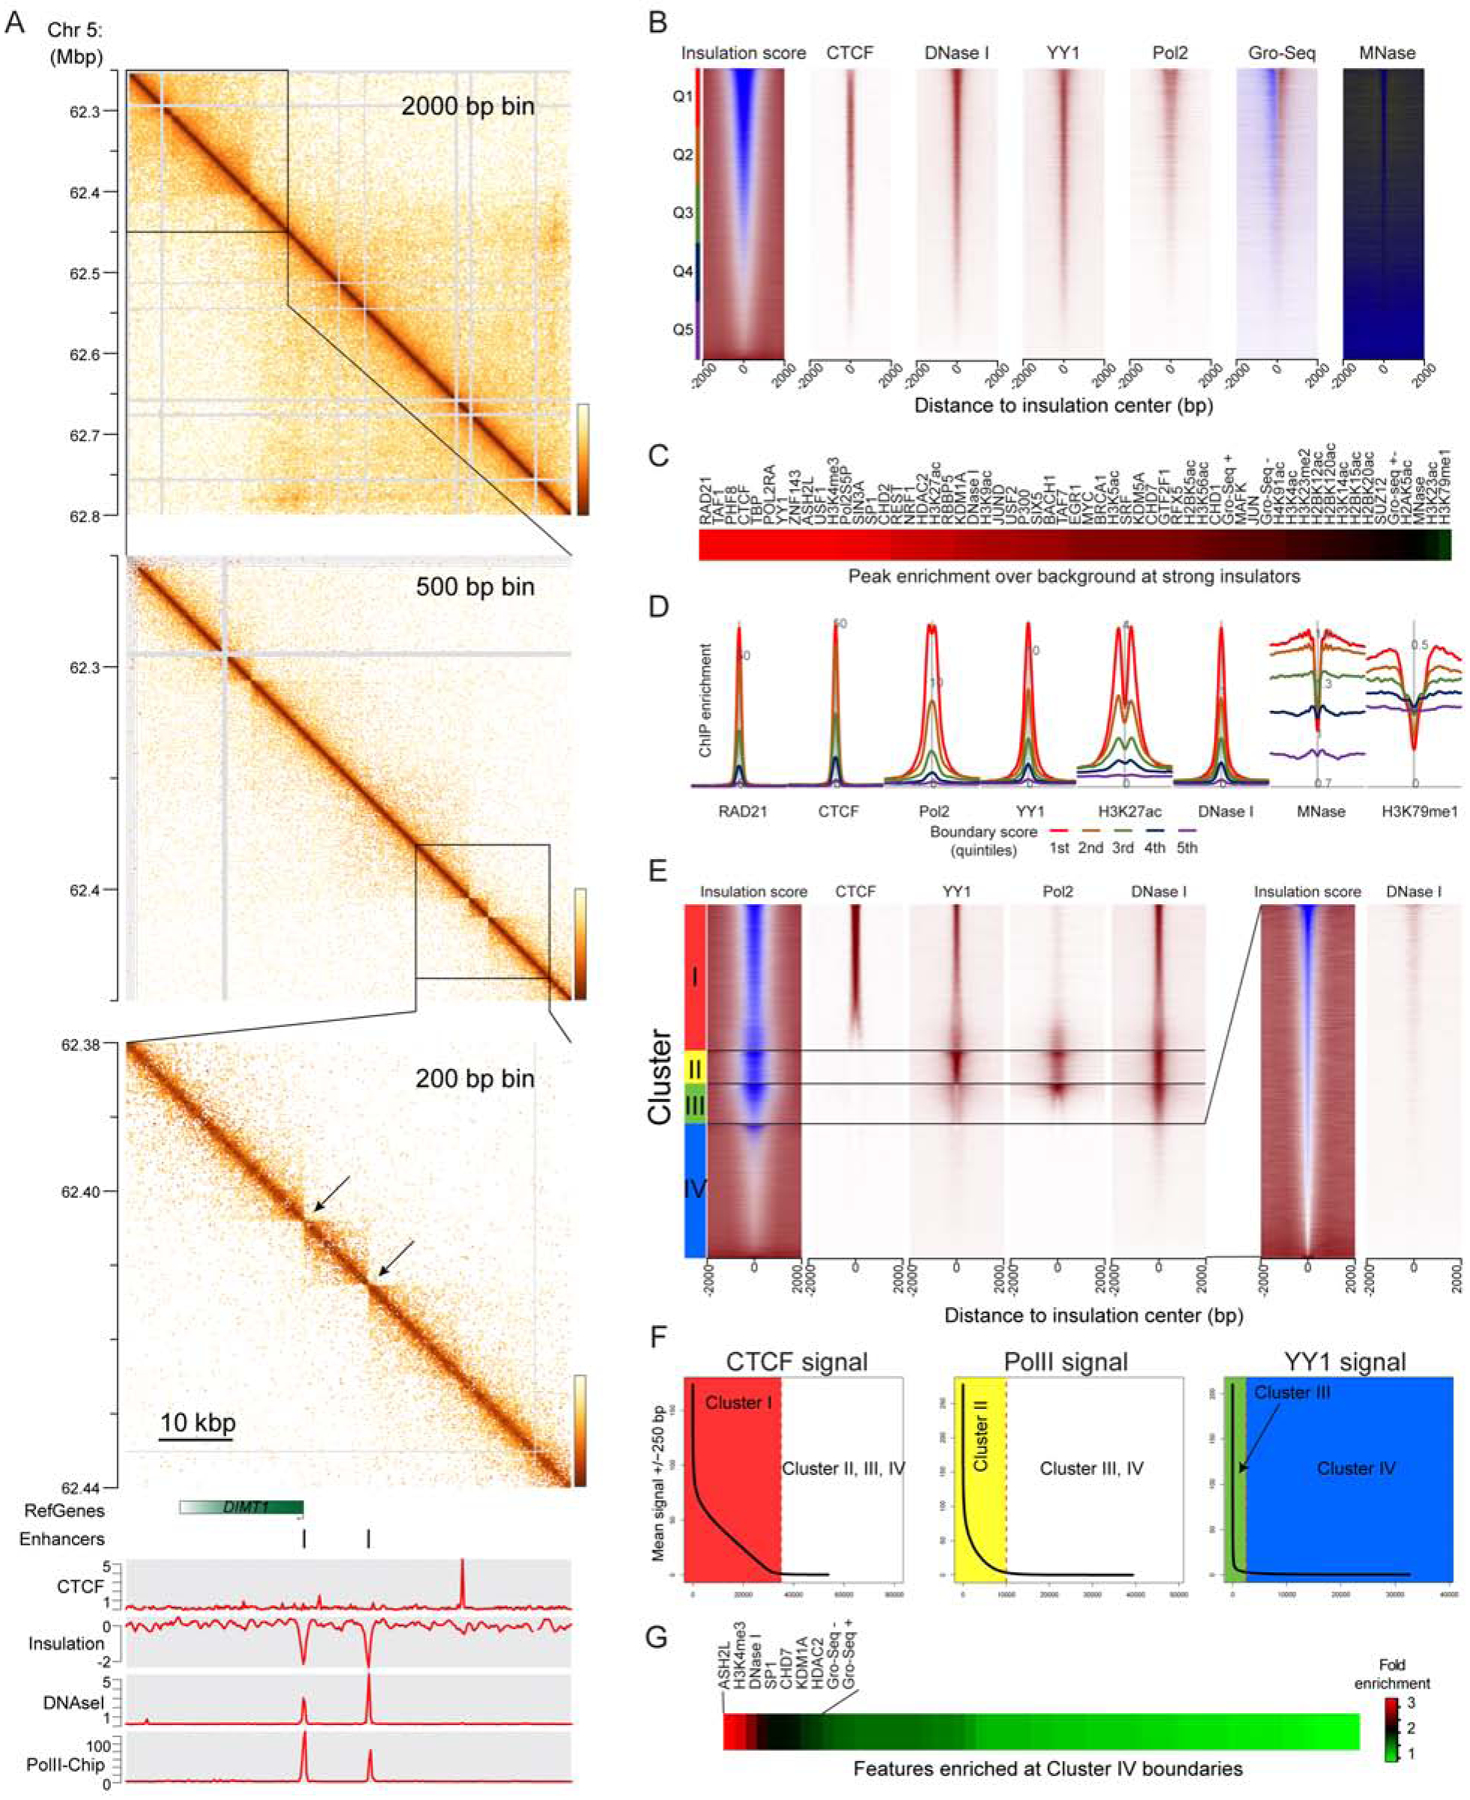
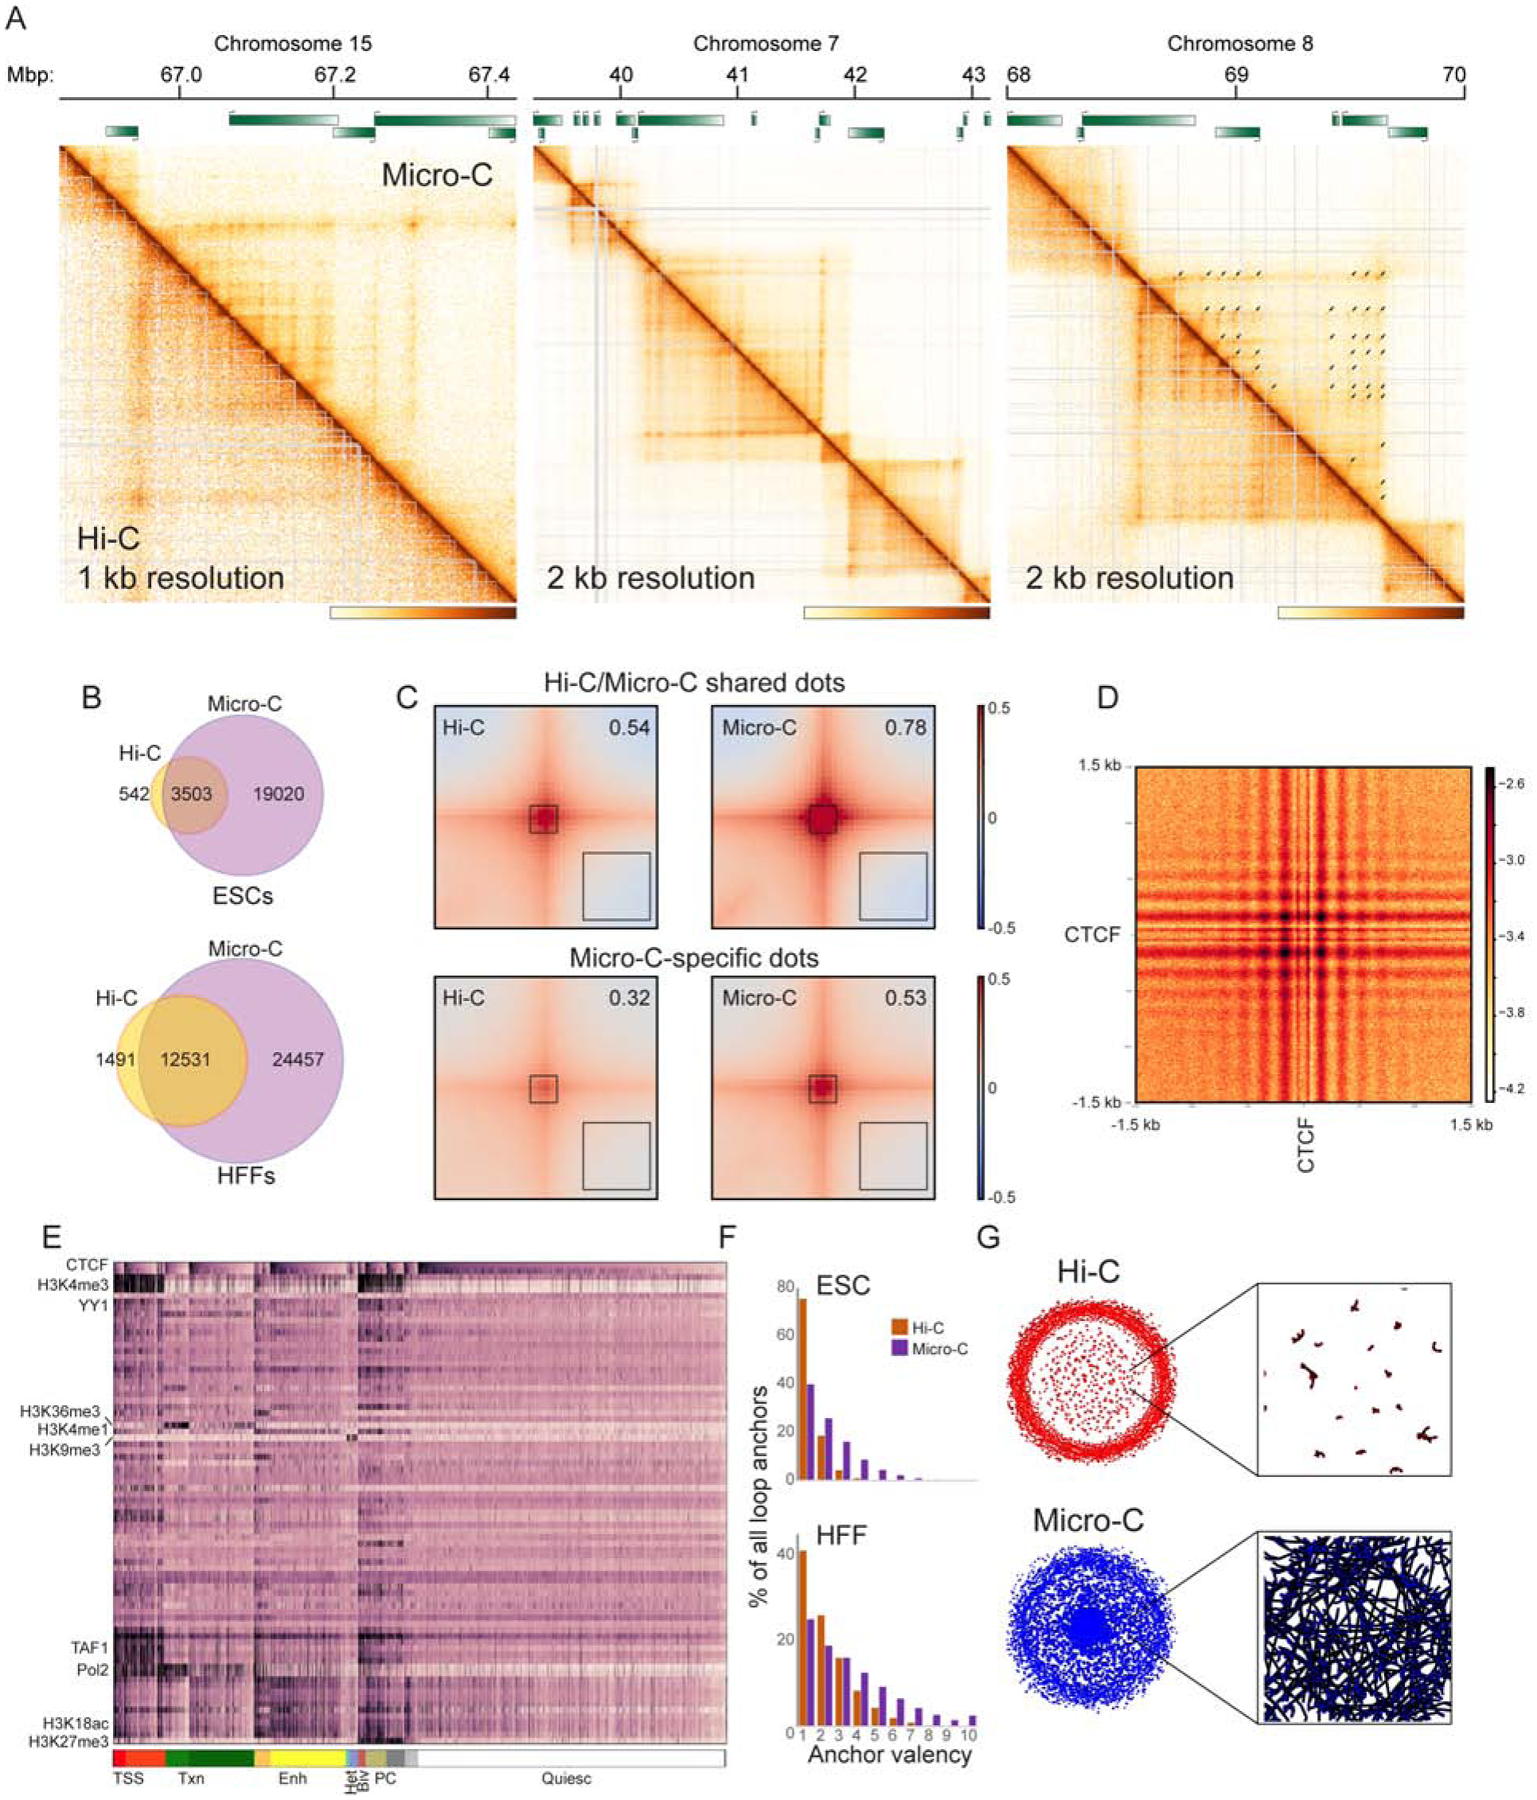
Over the past decade, 3C-related methods have provided remarkable insights into chromosome folding in vivo. To overcome the limited resolution of prior studies, we extend a recently developed Hi-C variant, Micro-C, to map chromosome architecture at nucleosome resolution in human ESCs and fibroblasts. Micro-C robustly captures known features of chromosome folding including compartment organization, topologically associating domains, and interactions between CTCF binding sites. In addition, Micro-C provides a detailed map of nucleosome positions and localizes contact domain boundaries with nucleosomal precision. Compared to Hi-C, Micro-C exhibits an order of magnitude greater dynamic range, allowing the identification of ∼20,000 additional loops in each cell type. Many newly identified peaks are localized along extrusion stripes and form transitive grids, consistent with their anchors being pause sites impeding cohesin-dependent loop extrusion. Our analyses comprise the highest-resolution maps of chromosome folding in human cells to date, providing a valuable resource for studies of chromosome organization.

Keywords: CTCF; Chromatin; Chromosomes; Loop extrusion; Micro-C.


Conflict of interest statement

Declaration of Interests The authors declare no competing interests.

Figures

Figure 1.
Figure 1.. Micro-C of human pluripotent and differentiated cell types recovers coarse features of chromosome folding.
(A-B) Chromosome contact maps for four successive zoom-ins across human chromosome 3, for H1 ESCs (A) and HFFs (B). Each panel shows Micro-C data above the diagonal, with Hi-C data for the same cell line below the diagonal. All four datasets represent two biological replicates, with technical replicate numbers provided in Table S1. Here, and for all other contact maps throughout the manuscript, color scale is set to saturate at no detectable interactions (yellow) to the 99th percentile of interaction values (brown) in the selected region. (C) Interaction frequency is plotted for Micro-C and Hi-C on the y axis as a function of genomic distance between interacting fragments (x axis), for ESCs and HFFs. Both axes are in log10 scale. In both cases, dotted lines show the genome-wide average interaction frequency between loci located on different chromosomes, an estimate of nonspecific dataset noise. See also Supplementary Figures S1B–D. (D) Micro-C robustly captures A/B compartment organization. Heatmap shows Hi-C and Micro-C interaction maps (binned at 100 kb resolution) for Chromosome 2 in ESCs, illustrating the nearly identical A/B “checkerboard” pattern captured by both methods. See also Supplementary Figure S2. (E) Eigenvector scores for chromosome 2 in ESCs compared for the Hi-C dataset (orange) vs. the Micro-C dataset (purple). (F) Eigenvector scores are globally correlated between Hi-C and Micro-C maps. Scatterplots show A/B scores for 100 kb genomic tiles in Hi-C (x axis) vs. Micro-C (y axis) maps of ESCs and HFFs.
Figure 2.
Figure 2.. Nucleosome-resolution views of chromatin organization
(A-C) Micro-C recovers nucleosome-resolution chromatin organization. In these panels, read pairing information was discarded, and single-end Micro-C reads (representing nucleosome ends) were shifted 73 bp to the nucleosome dyad axis. (A-B) show nucleosome occupancy profiles aligned according to TSSs (A) or CTCF binding sites (B) and averaged according to quintiles of transcription rate (using Pol2 occupancy as a proxy) or CTCF occupancy. Panel (C) shows nucleosome occupancy and CTCF ChIP enrichment (Davis et al., 2018) at CTCF binding sites sorted from high (top) to low (bottom) CTCF occupancy. (D) Nucleosome resolution contact maps surrounding TSSs (left two panels) or CTCF binding sites (right panel). Promoters and CTCF sites act as boundaries between contact domains, as seen in the clearing of contacts in the upper right and lower left quadrants. Also apparent at this resolution is the nucleosome phasing surrounding these regulatory elements, manifest as a grid-like structure superimposed on the contact maps. See also Supplementary Figure S3A.
Figure 3.
Figure 3.. High resolution identification of interaction boundaries
(A) Successive zooms into the ESC Micro-C dataset show a boundary between selfassociating domains, located at a promoter. Bottom panel shows genomic tracks for CTCF, insulation score, DNaseI signal, and Pol2 ChIP. (B) Gross features of boundary elements in ESCs (all systematic comparisons are performed in ESCs given the abundant ChIP-Seq data available in this cell type). Boundaries were identified as described in Methods, and the strongest 100,000 boundaries are sorted according to insulation score (left panel). See also Supplementary Figure S3B. Right panels show ChIP-Seq enrichment for key boundary factors, DNase- and MNase-Seq data, and GRO-Seq as a readout of active transcription. (C) Survey of factors enriched at strong boundaries. For the indicated ChIP-Seq (and DNase- and MNase- Seq) datasets, the peak to trough (ChIP signal at the central 500 bp vs. the baseline, 2 kb distant) ratio was calculated, and factors are ordered by enrichment score. (D) Examples of boundary-enriched (CTCF, etc.) and -depleted (H3K79me2) factors. (E-G) Independence of key boundary elements. Boundaries were successively sorted by CTCF, YY1, and Pol2 to group boundaries into four classes – CTCF-associated, CTCF-negative/Pol2-positive, CTCF/Pol2-depleted/YY1-positive, and weak CTCF/YY1/Pol2-depleted boundaries. Panel (E) shows heatmaps of relevant signals at the four boundary types, along with a zoom-in of insulation score and DNase I signal at Cluster IV boundaries. See Supplementary Figure S3F for more Cluster IV-associated features. Panel (F) shows the distribution of signal for CTCF, Pol2, and YY1 at all boundaries (left panel), CTCF-depleted boundaries (middle panel), and CTCF- and Pol2-depleted boundaries (right panel). For each distribution, the threshold for calling factor depletion is indicated as a dotted vertical line. (G) shows enrichment of a various proteins or other features at Cluster IV boundaries – full set of labels is provided in Supplementary Figure S3E.
Figure 4.
Figure 4.. TADs are composed of a heterogeneous network of internal looping interactions
(A) Examples of Micro-C-specific peaks of looping interactions in HFFs. In each case Micro-C contact map is shown above the diagonal, along with corresponding Hi-C heatmap below the diagonal (see also Supplementary Figures S4A–B for ESC examples). Arrows in the right panel show “dots” called in the Micro-C dataset. (B) Venn diagrams show presumed looping interaction peaks (dots) identified by MicroC and Hi-C in ESCs and HFFs, as indicated. (C) Heatmaps showing average contact frequency in ESCs for dots called in both Hi-C and Micro-C (top), or in Micro-C only. Heatmaps show data for 200 kb (100 kb upstream and 100 kb downstream) surrounding loop anchors. Number in the upper right hand corner represents the signal strength at the loop base (heatmap center) over the nearby background (black box, lower right corner). See also Supplementary Figure S4C for HFF dataset. (D) Heatmap showing average contact frequency, at nucleotide resolution, for all pairs of CTCF ChIP-Seq peaks associated with convergently-oriented CTCF motifs at separations between 100 kb and 1 Mb. See also Supplementary Figure S5. (E) Global view of dot anchor sites. For all anchor sites, enrichment for various chromatin proteins or histone modifications (Davis et al., 2018) was computed. Anchor sites are first sorted according to chromatin state (broad chromatin types indicated at bottom, from left: Transcription Start Sites, Transcribed chromatin, Enhancers, Heterochromatin, Bivalent, Polycomb, and “Quiescent” chromatin depleted of characteristic proteins/modifications), then sorted according to CTCF enrichment within each subcluster. See also Supplementary Figures S6–7. (F)Micro-C identifies genomic loci with multiple looping interaction peaks. Histograms show the number of looping interaction peaks for any given genomic locus, revealing a clear shift towards multiple peaks in Micro-C compared to Hi-C datasets. (G)Grid completeness. Left panels show networks constructed from Hi-C (top) and Micro-C (bottom) looping interaction peaks, while right panels show a zoom in from the center of the network. Here, nodes represent genomic loci (anchors), while edges represent interaction peaks between anchor sites (dots).

Comment in

References

    1. Beagrie RA, Scialdone A, Schueler M, Kraemer DC, Chotalia M, Xie SQ, Barbieri M, de Santiago I, Lavitas LM, Branco MR, et al. (2017). Complex multi-enhancer contacts captured by genome architecture mapping. Nature 543, 519–524. - PMC - PubMed
    1. Belaghzal H, Dekker J, and Gibcus JH (2017). Hi-C 2.0: An optimized Hi-C procedure for high-resolution genome-wide mapping of chromosome conformation. Methods 123, 56–65. - PMC - PubMed
    1. Boettiger AN, Bintu B, Moffitt JR, Wang S, Beliveau BJ, Fudenberg G, Imakaev M, Mirny LA, Wu CT, and Zhuang X (2016). Super-resolution imaging reveals distinct chromatin folding for different epigenetic states. Nature 529, 418–422. - PMC - PubMed
    1. Bonev B, Mendelson Cohen N, Szabo Q, Fritsch L, Papadopoulos GL, Lubling Y, Xu X, Lv X, Hugnot JP, Tanay A, et al. (2017). Multiscale 3D Genome Rewiring during Mouse Neural Development. Cell 171, 557–572 e524. - PMC - PubMed
    1. Carone BR, Hung JH, Hainer SJ, Chou MT, Carone DM, Weng Z, Fazzio TG, and Rando OJ (2014). High-resolution mapping of chromatin packaging in mouse embryonic stem cells and sperm. Developmental cell 30, 11–22. - PMC - PubMed

Publication types