. 2020 Apr 7;31(4):837-851.e10.
doi: 10.1016/j.cmet.2020.03.003. Epub 2020 Mar 25.

Microbiota-Derived Metabolites Suppress Arthritis by Amplifying Aryl-Hydrocarbon Receptor Activation in Regulatory B Cells

Affiliations

Microbiota-Derived Metabolites Suppress Arthritis by Amplifying Aryl-Hydrocarbon Receptor Activation in Regulatory B Cells

Elizabeth C Rosser et al. Cell Metab. .

Abstract

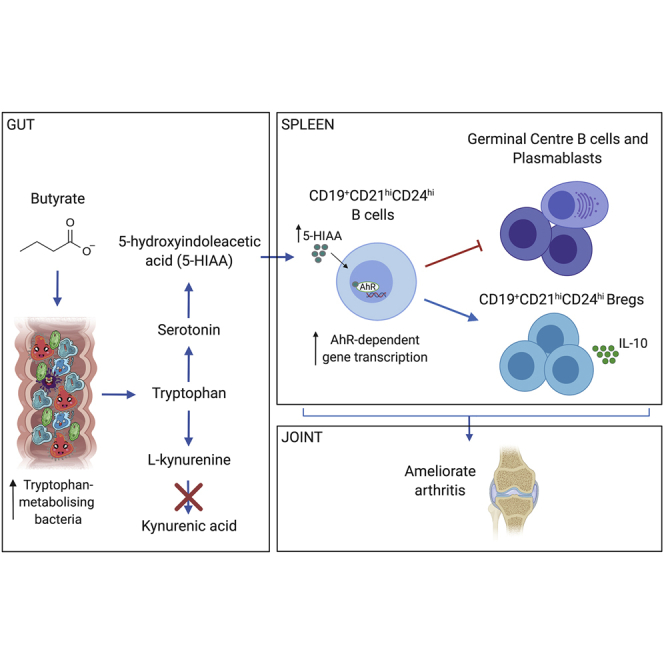
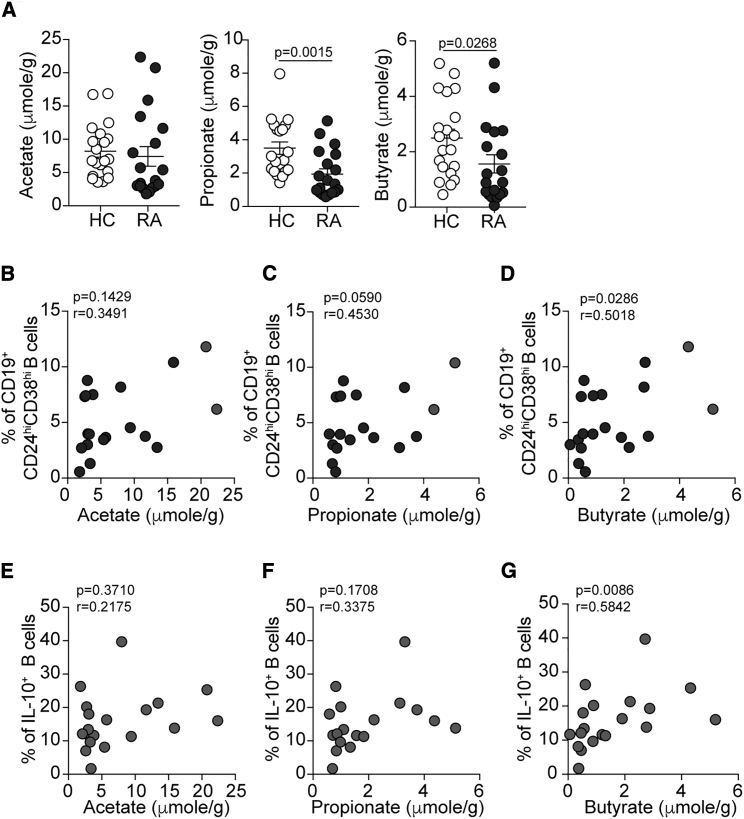
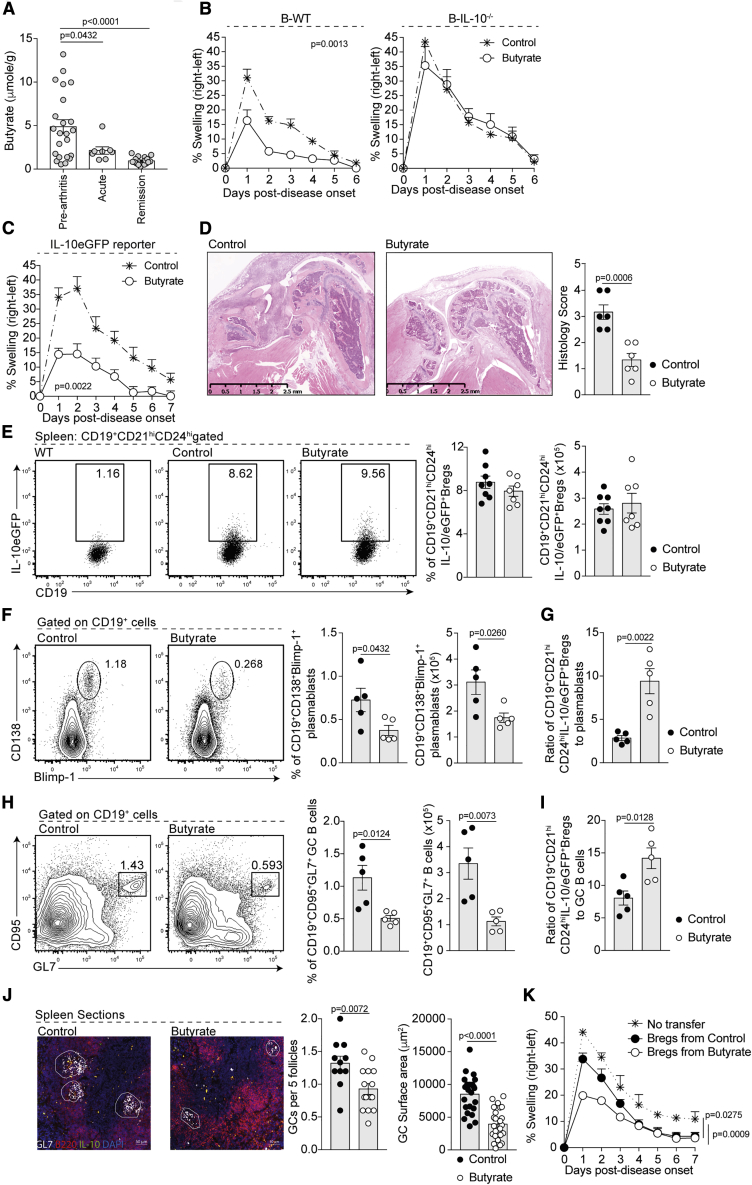
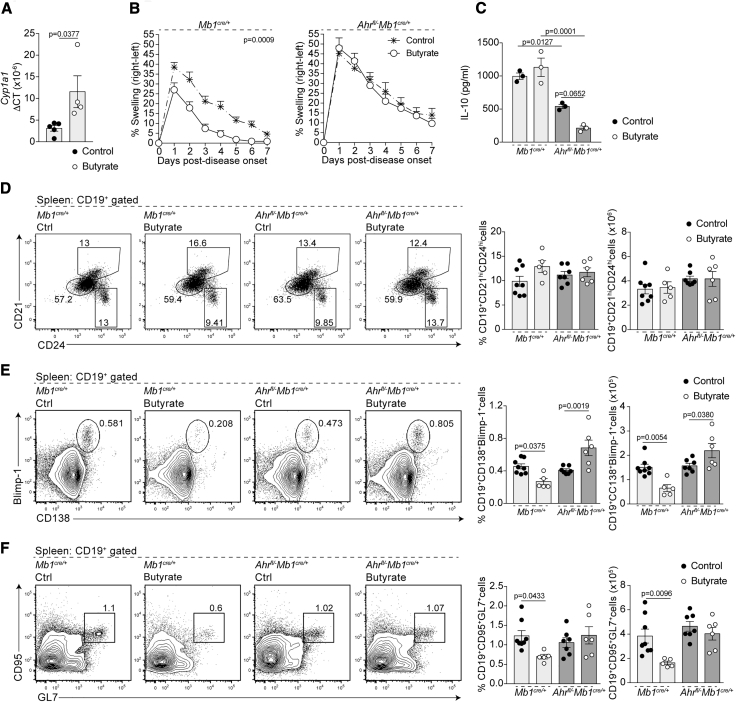
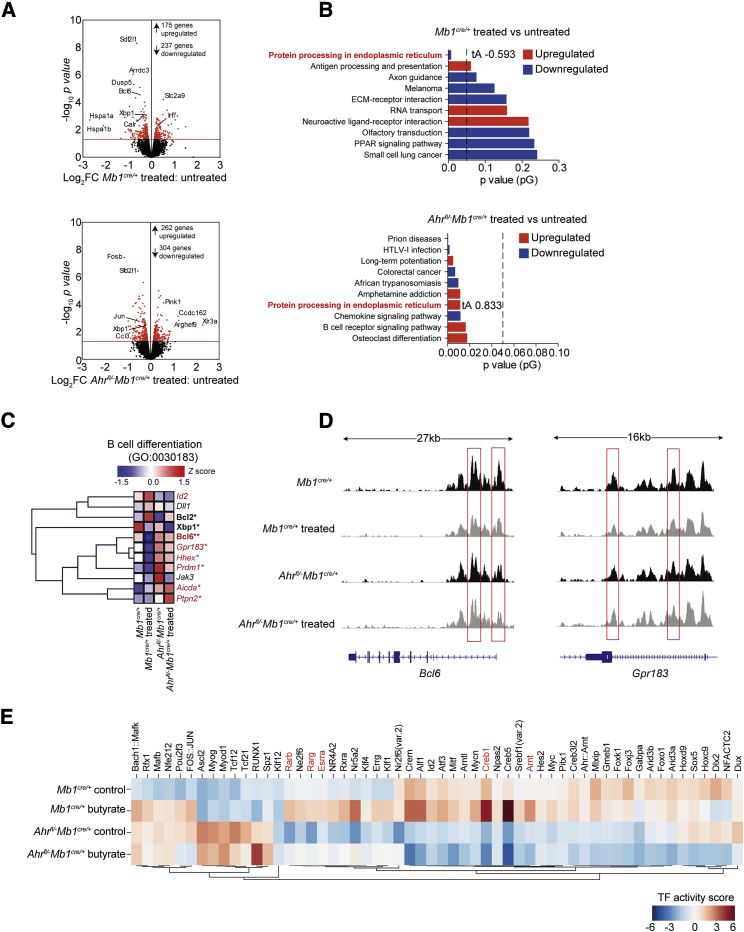
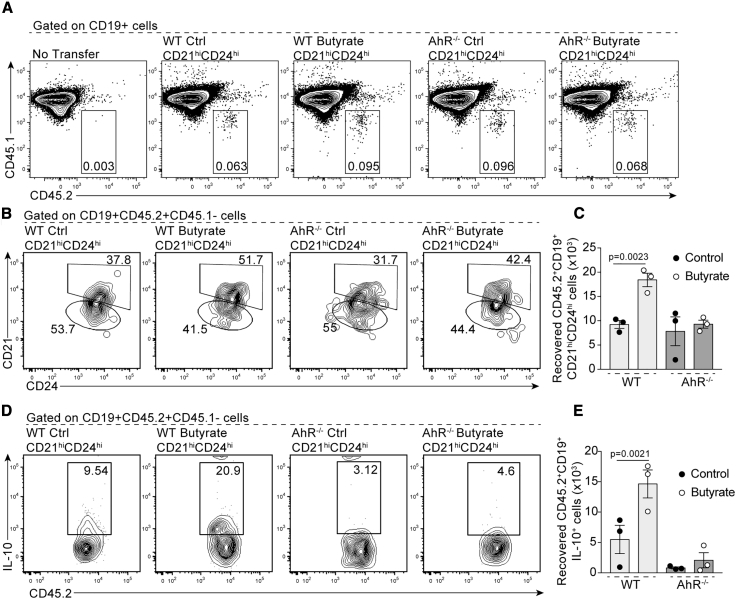
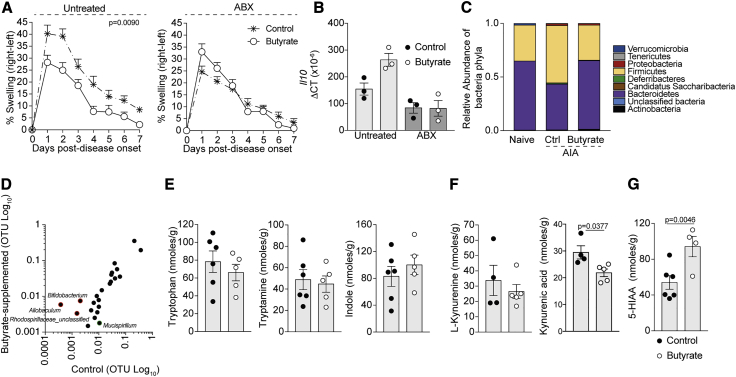
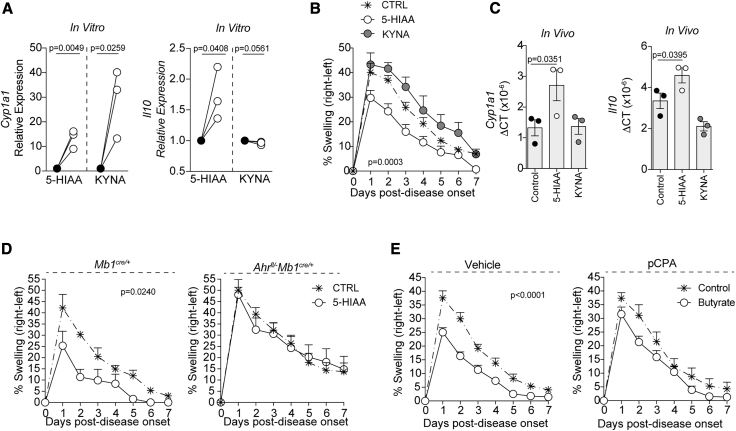
The differentiation of IL-10-producing regulatory B cells (Bregs) in response to gut-microbiota-derived signals supports the maintenance of tolerance. However, whether microbiota-derived metabolites can modulate Breg suppressive function remains unknown. Here, we demonstrate that rheumatoid arthritis (RA) patients and arthritic mice have a reduction in microbial-derived short-chain fatty acids (SCFAs) compared to healthy controls and that in mice, supplementation with the SCFA butyrate reduces arthritis severity. Butyrate supplementation suppresses arthritis in a Breg-dependent manner by increasing the level of the serotonin-derived metabolite 5-Hydroxyindole-3-acetic acid (5-HIAA), which activates the aryl-hydrocarbon receptor (AhR), a newly discovered transcriptional marker for Breg function. Thus, butyrate supplementation via AhR activation controls a molecular program that supports Breg function while inhibiting germinal center (GC) B cell and plasmablast differentiation. Our study demonstrates that butyrate supplementation may serve as a viable therapy for the amelioration of systemic autoimmune disorders.

Keywords: 5-Hydroxyindole-3-acetic acid; B cells; aryl-hydrocarbon receptor; autoimmunity; butyrate; regulatory B cells; rheumatoid arthritis; serotonin; short chain fatty acid; tryptophan metabolism.


Conflict of interest statement

Declaration of Interests The authors declare no competing interests.

Figures

None
Graphical abstract
Figure 1
Figure 1
Butyrate Levels Correlate with Immature B Cells in Patients with Inactive Rheumatoid Arthritis (A) Representative histograms show stool acetate, propionate, and butyrate levels in healthy controls (HC, n = 20) and RA patients (n = 19) as measured by high-performance liquid chromatography. (B–D) Scatterplots show correlation between stool (B) acetate, (C) propionate, and (D) butyrate levels and CD19+CD24hiCD38hiB cell frequency in the peripheral blood of RA patients (n = 19). (E–G) Scatterplots show correlation between stool (E) acetate, (F) propionate, and (G) butyrate levels and IL-10+B cell frequency in the peripheral blood of RA patients (n = 19). Data represent mean ± SE (A, Mann-Whitney test; B–G, Spearmen correlation). See also Figure S1.
Figure 2
Figure 2
Butyrate Supplementation Suppresses Arthritis by Skewing the B Cell Compartment in Favor of a Regulatory Phenotype (A) Stool butyrate levels in WT mice pre-arthritis (n = 23), with acute arthritis (n = 8), and in remission from arthritis (n = 18) as measured by high-performance liquid chromatography (cumulative data are shown). (B) Mean clinical score of control (cumulative n = 25) and butyrate-supplemented B-WT chimeric mice or B-IL-10−/−chimeric mice (n = 8 per group) (one representative experiment of two experiments is shown); y axis shows percentage swelling in antigen-injected knee compared to control knee. (C) Mean clinical score of control (cumulative n = 15) and butyrate-supplemented IL-10eGFP reporter mice (cumulative n = 13); y axis shows percentage swelling in antigen-injected knee compared to control knee (one representative experiment of two experiments is shown). (D) Representative H&E staining of knee joints from control and butyrate-supplemented IL-10eGFP reporter mice (left) and blinded histology scores (right) of joint damage. (E) Representative flow cytometry plots (left) and bar charts (right) showing CD19+CD21hiCD24hiIL-10eGFP+Breg frequency and number in control (cumulative n = 15) and butyrate-supplemented mice (cumulative n = 13) (one representative experiment of three experiments is shown). (F) Representative flow cytometry plots (left) and bar charts (right) showing CD19+CD138+Blimp-1+plasmablast frequency and number in control and butyrate-supplemented mice (cumulative n = 11 per group, one representative experiment of two experiments is shown). (G) Bar charts show ratio of CD19+CD21hiCD24hiIL-10eGFP+Bregs to plasmablast in control and butyrate-supplemented mice (cumulative n = 11 per group, one representative experiment of two experiments is shown). (H) Representative flow cytometry plots (left) and bar chart (right) shows the percentage and number of CD19+CD95+GL7+ germinal center (GC) B cells in control and butyrate-supplemented mice (cumulative n = 11 per group, one representative experiment of three experiments is shown). (I) Bar chart shows ratio of CD19+CD21hiCD24hiIL-10eGFP+Bregs to GC B cells in control and butyrate-supplemented mice (cumulative n = 11, one representative experiment of two experiments is shown). (J) Representative immunofluorescence blinded histological analysis of the number and size of GC control and butyrate-supplemented mice (original magnification 20×, n = 3). (K) Mean clinical score following transfer of CD19+CD21hiCD24hiIL-10eGFP+Bregs from control (cumulative n = 6) or butyrate-supplemented mice (cumulative n = 6), a control group that did not receive a transfer; y axis shows percentage swelling in antigen-injected knee compared to control knee (cumulative n = 8) (one representative experiment of two experiments is shown). Cells were isolated at day 7 post-disease onset. Data represent mean ± SE (A, one-way ANOVA; B, C, and K, two-way ANOVA; D–J, Student’s t test). See also Figures S2–S4.
Figure 3
Figure 3
Suppression of Arthritis by Butyrate Supplementation Depends upon AhR Activation and IL-10 Expression in B Cells (A) Bar chart shows expression of Cyp1a1 relative to β-actin in splenic B cells isolated from control or butyrate-supplemented mice (cumulative n = 5, one representative experiment of two experiments is shown). (B) Mean clinical score of control and butyrate-supplemented Mb1cre/+ mice or Ahrfl/−Mb1cre/+ mice; y axis shows percentage swelling in antigen-injected knee compared to control knee (cumulative n = 15 per group, one representative experiment of five experiments is shown). (C) IL-10 production by splenic B cells isolated from control Mb1cre/+ mice, butyrate-supplemented Mb1cre/+ mice, control Ahrfl/−Mb1cre/+ mice, and butyrate-supplemented Ahrfl/−Mb1cre/+ mice at day 7 post-disease onset as measured by ELISA (cumulative n = 3 per group). (D) Representative flow cytometry plots and bar charts showing the frequency and number of CD19+CD21hiCD24hiB cells in control Mb1cre/+ mice (cumulative n = 8), butyrate-supplemented Mb1cre/+ mice (cumulative n = 5), control Ahrfl/−Mb1cre/+ mice (n = 7), and butyrate-supplemented Ahrfl/−Mb1cre/+ mice (cumulative n = 6) at day 7 post-disease onset (cumulative data are shown). (E) Representative flow cytometry plots and bar charts showing the frequency and number of CD19+CD138+Blimp-1+B cells in control Mb1cre/+ mice (cumulative n = 8), butyrate-supplemented Mb1cre/+ mice (cumulative n = 5), control Ahrfl/−Mb1cre/+ mice (cumulative n = 7), and butyrate-supplemented Ahrfl/−Mb1cre/+ mice (cumulative n = 6) (cumulative data are shown). (F) Representative flow cytometry plots and bar charts showing the frequency and number of CD19+CD95+GL7+B cells in control Mb1cre/+ mice (cumulative n = 8), butyrate-supplemented Mb1cre/+ mice (cumulative n = 5), control Ahrfl/−Mb1cre/+ mice (cumulative n = 7), and butyrate-supplemented Ahrfl/−Mb1cre/+ mice (cumulative n = 6) (cumulative data are shown). Cells were isolated at day 7 post-disease onset. Data represent mean ± SE (A, Student’s t test; C, E, and F, one-way ANOVA; B, two-way ANOVA). See also Figures S5 and S6.
Figure 4
Figure 4
Butyrate Supplementation Modulates the Transcriptional and Epigenetic Landscape of CD19+CD21hiCD24hiB Cells in an AhR-Dependent Manner (A) Volcano plots shows log2 fold change (FC) in gene expression between CD19+CD21hiCD24hiB cells isolated from butyrate-supplemented Mb1cre/+ mice compared to control Mb1cre/+ mice (top plot) and between butyrate supplemented Ahrfl/−Mb1cre/+ compared to control Ahrfl/−Mb1cre/+ mice (bottom plot). Red dots represent significant DEGs, with the red line denoting a cut off p value of <0.05. (B) Signaling pathway impact analysis (SPIA) ranked on significance (pG) comparing the over-represented (red) and under-represented (blue) pathways in butyrate-supplemented compared to control CD19+CD21hiCD24hiB cells from Mb1cre/+ mice (top graph) and Ahrfl/−Mb1cre/+ mice (bottom graph). The total perturbation accumulation (tA) score is listed for the “protein processing in endoplasmic reticulum” pathway. (C) Heatmap shows the expression of B cell differentiation genes in CD19+CD21hiCD24hiB cells isolated from control Mb1cre/+ mice, butyrate-supplemented Mb1cre/+ mice, control Ahrfl/−Mb1cre/+ mice, and butyrate-supplemented Ahrfl/−Mb1cre/+ mice. Mean z scores were calculated from log CPM values. Samples highlighted in red are significantly differentially expressed between CD19+CD21hiCD24hiB cells isolated from butyrate-supplemented Mb1cre/+ mice compared to butyrate-supplemented Ahrfl/−Mb1cre/+ mice. Samples highlighted in bold are significantly differentially expressed between CD19+CD21hiCD24hiB cells isolated from butyrate-supplemented Mb1cre/+ mice compared to control Mb1cre/+ mice. (D) Representative ATAC-seq tracks for the Bcl6 and Gpr183 loci in CD19+CD21hiCD24hiB cells from butyrate-supplemented or control Mb1cre/+ and Ahrfl/−Mb1cre/+ mice (n = 3). Track heights between samples are normalized through group autoscaling. For RNA-seq data, n = 3 per condition and genotype. (E) Heatmap shows inferred transcription factor activity scores based on accessibility at transcription factor binding motifs in CD19+CD21hiCD24hiB cells isolated from control Mb1cre/+ mice, butyrate-supplemented Mb1cre/+ mice, control Ahrfl/−Mb1cre/+ mice, and butyrate-supplemented Ahrfl/−Mb1cre/+ mice as measured by ATAC-seq. AhR co-factors are highlighted in red. For ATAC-seq data, n = 3 for Mb1cre/+ mice and n = 2 for Ahrfl/−Mb1cre/+ mice. For RNA-seq data, n = 3 per group. Cells were isolated at day 7 post-disease onset. See also Figure S7.
Figure 5
Figure 5
CD45.2+CD19+CD21hiCD24hiB Cells from Butyrate-Supplemented WT but Not AhR−/− Mice Retain Their Phenotype and Differentiate in IL-10+Bregs upon Adoptive Transfer (A and B) Representative flow cytometry plots show (A) CD45.2+CD19+B cell and (B) CD45.2+CD19+CD21hiCD24hi B cell frequency in CD45.1 congenic WT mice that had received a transfer of CD19+CD21hiCD24hiB cells isolated from control or butyrate-supplemented WT or AhR−/− mice. (C) Bar chart shows number of CD45.2+CD19+CD21hiCD24hiB cells recovered post-transfer from CD45.1 congenic WT mice that had received a transfer of CD19+CD21hiCD24hiB cells isolated from control or butyrate-supplemented WT or AhR−/− mice. (D) Representative flow cytometry plots and bar charts show CD45.2+CD19+IL-10+B cell frequency in CD45.1 congenic WT mice that had received a transfer of CD19+CD21hiCD24hiB cells isolated from control or butyrate-supplemented WT or AhR−/− mice. (E) Bar chart shows number of CD45.2+CD19+IL-10+B cells recovered post-transfer from CD45.1 congenic WT mice that had received a transfer of control or butyrate-supplemented WT or AhR−/− mice. Cells were isolated at 48 h post-transfer (cumulative n = 3 per group, cumulative data are shown). Data represent mean ± SE (C and E, one-way ANOVA).
Figure 6
Figure 6
Butyrate Supplementation Increases the Availability of AhR Ligands (A) Mean clinical score of control and butyrate-supplemented ABX-treated or untreated mice; y axis shows percentage swelling in antigen-injected knee compared to control knee (cumulative n = 8 per group, one representative experiment of two experiments is shown). (B) Bar chart shows expression of Il10 relative to β-actin in splenic B cells isolated from ABX-treated WT or untreated mice (cumulative n = 3 per group). (C) Bar chart shows relative abundance of bacterial phyla in the stool of naive, control arthritic, or butyrate-supplemented arthritic mice (n = 4 per group). (D) XY graph shows operational taxonomic units (OTUs) of bacterial genera in butyrate-supplemented and control arthritic mice (n = 4 per group). (E–G) Bar charts shows levels of tryptophan, tryptamine, indole (E), L-Kynurenine, Kynurenic Acid (KYNA) (F), and 5-HIAA (G) in the stool of control arthritic WT and butyrate-supplemented arthritic mice (cumulative n = 5 per group). Data represent mean ± SE (A, two-way ANOVA; B, one-way ANOVA; E–G, Student’s t test). See also Figure S7.
Figure 7
Figure 7
5-Hydroxyindole-3-Acetic Acid Increases Il10 Transcription by B cells In Vivo and In Vitro by Acting as a Ligand for AhR (A) Relative expression of Cyp1a1 and Il10 in total splenic B cells following 6-h culture with 5-HIAA or kynurenic acid (KYNA) compared to vehicle alone (n = 3, one of two experiments is shown). (B) Mean clinical score of control, 5-HIAA-gavaged, or KYNA-gavaged mice; y axis shows percentage swelling in antigen-injected knee compared to control knee (cumulative n = 8 per group, one representative experiment of two experiments is shown). (C) Bar charts show expression of Cyp1a1 and Il10 relative to β-actin in splenic B cells isolated from control, 5-HIAA-gavaged, or KYNA-gavaged mice. (D) Mean clinical score of control or 5-HIAA-gavaged Mb1cre/+ mice or Ahrfl/Mb1cre/+ mice; y axis shows percentage swelling in antigen-injected knee compared to control knee (cumulative n = 8 per group, one representative experiment of two experiments is shown). (E) Mean clinical score of control and butyrate-supplemented L-para-chlorophenylalanine (PCPA)-treated (tryptophanase inhibitor, TPH) or vehicle-treated mice; y axis shows percentage swelling in antigen-injected knee compared to control knee (cumulative n = 10 per group, one representative experiment of two experiments is shown). Data represent mean ± SE (A, Student’s t test; B, two-way ANOVA; C, one-way ANOVA; D and E, two-way ANOVA).

Comment in

References

    1. Abel J., Haarmann-Stemmann T. An introduction to the molecular basics of aryl hydrocarbon receptor biology. Biol. Chem. 2010;391:1235–1248. - PubMed
    1. Alhabbab R., Blair P., Elgueta R., Stolarczyk E., Marks E., Becker P.D., Ratnasothy K., Smyth L., Safinia N., Sharif-Paghaleh E. Diversity of gut microflora is required for the generation of B cell with regulatory properties in a skin graft model. Sci. Rep. 2015;5:11554. - PMC - PubMed
    1. Anders S., Pyl P.T., Huber W. HTSeq--a Python framework to work with high-throughput sequencing data. Bioinformatics. 2015;31:166–169. - PMC - PubMed
    1. Arpaia N., Campbell C., Fan X., Dikiy S., van der Veeken J., deRoos P., Liu H., Cross J.R., Pfeffer K., Coffer P.J., Rudensky A.Y. Metabolites produced by commensal bacteria promote peripheral regulatory T-cell generation. Nature. 2013;504:451–455. - PMC - PubMed
    1. Basson A., Trotter A., Rodriguez-Palacios A., Cominelli F. Mucosal Interactions between Genetics, Diet, and Microbiome in Inflammatory Bowel Disease. Front. Immunol. 2016;7:290. - PMC - PubMed

Publication types