. 2020 Apr 24;7(2):ENEURO.0514-19.2020.
doi: 10.1523/ENEURO.0514-19.2020. Print 2020 Mar/Apr.

Time-to-Target Simplifies Optimal Control of Visuomotor Feedback Responses

Affiliations

Time-to-Target Simplifies Optimal Control of Visuomotor Feedback Responses

Justinas Česonis et al. eNeuro. .

Abstract

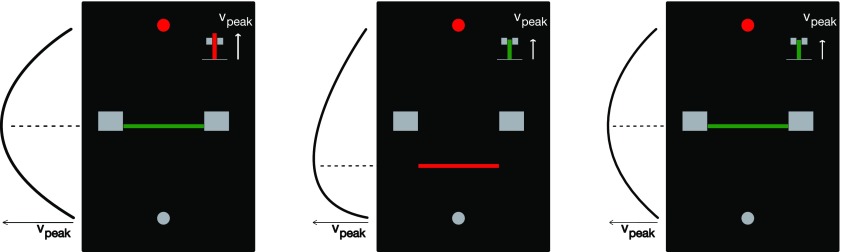
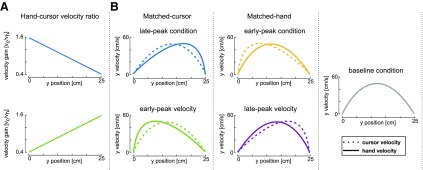
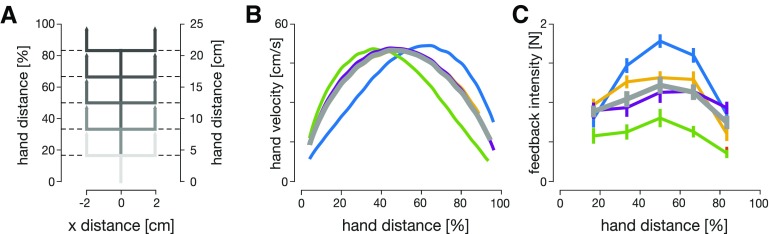
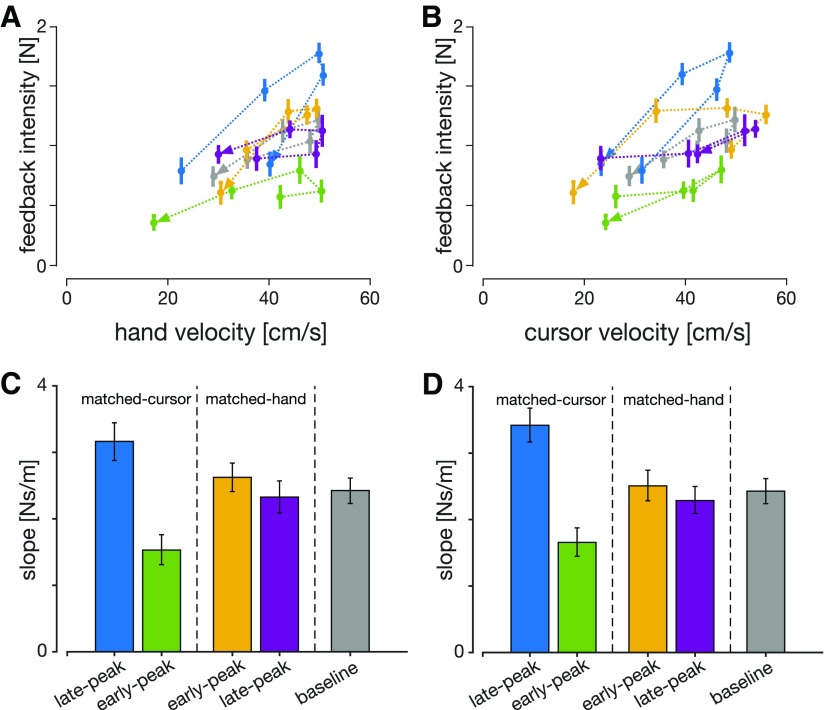
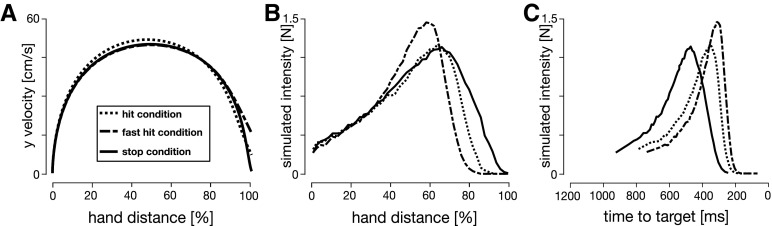
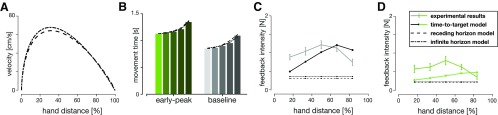
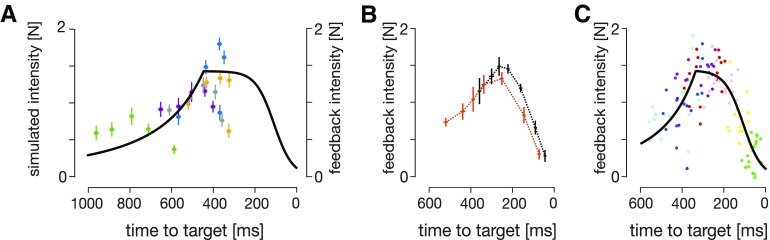
Visuomotor feedback responses vary in intensity throughout a reach, commonly explained by optimal control. Here, we show that the optimal control for a range of movements with the same goal can be simplified to a time-to-target dependent control scheme. We measure our human participants' visuomotor responses in five reaching conditions, each with different hand or cursor kinematics. Participants only produced different feedback responses when these kinematic changes resulted in different times-to-target. We complement our experimental data with a range of finite and non-finite horizon optimal feedback control (OFC) models, finding that the model with time-to-target as one of the input parameters best replicates the experimental data. Overall, this suggests that time-to-target is a critical control parameter in online feedback control. Moreover, we propose that for a specific task and known dynamics, humans can instantly produce a control signal without any additional online computation allowing rapid response onset and close to optimal control.

Keywords: motor control; optimal feedback control; reaching; time-to-target; visuomotor control; visuomotor feedback response.


Figures

Figure 1.
Figure 1.
Examples of feedback presented to the participants. Feedback regarding the peak velocity and the timing of the peak velocity was provided after each trial. Large gray blocks indicate the velocity peak location target, while the bar chart at the top-right corner indicates peak y-velocity magnitude. Feedback was provided on the modality (cursor or hand) that matched the baseline, where the horizontal line indicated the location of the peak velocity in this modality. Left, Velocity peak location is within the target, but the movement was too fast (unsuccessful trial). Middle, Velocity peak location is too early, but the movement speed is within the target (unsuccessful trial). Right, Successful trial.
Figure 2.
Figure 2.
Experimental design. A, top, Hand-cursor velocity scaling for conditions where the cursor position leads the hand position in y-axis (matched-cursor late-peak hand velocity condition, blue, and matched-hand early-peak cursor velocity condition, yellow). Bottom, Hand-cursor velocity scaling for conditions where the cursor position lags the hand position in y-axis (matched-cursor early-peak hand velocity condition, green, and matched-hand late-peak cursor velocity condition, purple). B, Hand and cursor velocity-position profiles required to achieve the ideal movement to the target. Left, Matched-cursor velocity conditions. Middle, Baseline condition, where cursor position and hand position are consistent. Right, Matched-hand velocity conditions.
Figure 3.
Figure 3.
Human visuomotor feedback responses are modulated across the five experimental conditions. A, Lateral perturbations of the cursor were applied in all five conditions. Perturbations were introduced as 2-cm cursor jumps perpendicular to the movement direction. The perturbation onset occurred at one of five equally spaced hand locations. B, Mean velocity profiles of the hand in five experimental conditions: matched-cursor early-peak (green), matched-cursor late-peak (blue), matched-hand early-peak (yellow), matched-hand late-peak (purple), and baseline (gray). Participants successfully modulated forward movement kinematics to meet task demands, velocity profiles are skewed for matched-cursor conditions, and are similar to the baseline for matched-hand conditions. C, Mean visuomotor feedback intensities (mean lateral force from 180 to 230 ms after perturbation onset) across all participants to cursor perturbations as a function of the hand distance in the movement. Error bars represent 1 standard error of the mean (SEM). Significant regulation is observed for matched-cursor early-peak and matched-cursor late-peak conditions (blue and green), but no significant regulation is seen for matched-hand conditions (yellow and purple), relative to the baseline.
Figure 4.
Figure 4.
Visuomotor feedback intensities as a function of (A) hand velocity and (B) cursor velocity at the time of perturbation for all experimental conditions. Error bars represent 1 SEM, and the arrowheads represent the order of the perturbation locations. C, D, Regression slopes of feedback intensities for each condition as a function of hand and cursor velocities, respectively. Error bars represent 95% confidence intervals of the slopes. The slopes for the two matched-cursor conditions were significantly different (based on the confidence intervals) than for the baseline condition.
Figure 5.
Figure 5.
A, Mean hand movement trajectories for matched-cursor late-peak (left), matched-cursor early-peak (middle), and baseline (right) conditions recorded in our participants, with perturbation onset at five locations [color light to dark: 4.2 cm (16.7%), 8.3 cm (33.3%), 12.5 cm (50%), 16.7 cm (66.7%), and 20.8 cm (83.4%) from the start position; dashed lines]. Corrections to rightward perturbations were flipped and combined with leftward corrections. B, Distance increase for each perturbation location recorded in our participants. Perturbation locations closest to the target required the largest increases in movement distance. Error bars represent 1 SEM.
Figure 6.
Figure 6.
A, Movement durations in maintained perturbation trials recorded by our participants in late-peak, early-peak and baseline conditions. Separate bars within the same color block represent different perturbation onset locations (left to right: 4.2, 8.3, 12.5, 16.7, and 20.8 cm from the start position). Error bars represent 1 SEM while the horizontal dashed lines represent movement durations in the same movement condition for non-perturbed movements. B, Full bars represent times-to-target (time between a perturbation onset and target interception) in maintained perturbation trials in our participants for late-peak, early-peak, and baseline conditions. White bars represent the time-to-target for a respective non-perturbed movement, at the time when the perturbation would have happened. The colored part of the bars represents the extension in times-to-target due to the perturbation in a non-constrained movement. This shows that the perturbation during the movement evokes an extension in the time-to-target and subsequently in movement duration Each of the five bars represents a different perturbation onset location, as in A. Error bars represent 1 SEM.
Figure 7.
Figure 7.
Comparison of feedback intensities between the two OFC models and experimental data. Simulated velocity profiles (A) and simulated feedback intensity profiles (B) of baseline (black), early-peak (green), and late-peak (blue) velocity condition simulations for the classical OFC model. Velocity profiles were obtained by constraining the velocity peak location and magnitude and optimizing for movement duration and activation cost function. Simulated feedback intensity profiles were obtained by applying virtual target jumps perpendicular to the movement direction during these movements and calculating the force exerted by the controller in the direction of the target jumps. The jagged appearance of the intensity traces is simply an outcome due to the simulation time step. C, Simulated feedback intensities obtained via the time-to-target OFC model. Preperturbation movements were simulated as if no perturbation would occur, to keep the controller naive to an upcoming perturbation. At the perturbation onset the remaining movement duration is adjusted to match the mean time-to-target for a similar perturbation onset in human participants (Fig. 6B). Therefore, this model only simulates the feedback intensities at the five perturbation locations in the movement. The velocity profiles for the time-to-target model match the velocity profiles of the classical model, shown in A. D, Visuomotor feedback intensities recorded in human participants.
Figure 8.
Figure 8.
OFC simulations of (A) velocity profiles and (B) simulated feedback intensity profiles for different desired peak velocities (in order from light to dark line colors: 40, 50, 60, 70, and 80 cm/s). C, Simulated feedback intensities of (B) re-mapped as a function of time-to-target at the time of perturbation. D, Simulated feedback intensities vs time-to-target for the three kinematic conditions over the five peak velocities simulated by OFC (colored dots). Solid lines represent the tuning curves (Eq. 7) fit to the data. Both the tuning curves and the simulated feedback intensity profiles are similar across a variety of different kinematics when expressed as a function of time-to-target.
Figure 9.
Figure 9.
Comparisons between hit and stop instructions. A, Velocity profiles for the stop, hit and fast-hit conditions. B, Simulated feedback intensity profiles as a function of hand position. C, Simulated feedback intensities of (B) re-mapped as a function of time-to-target at the time of target perturbation.
Figure 10.
Figure 10.
Receding horizon and infinite horizon model simulations. A, Simulated velocity profiles of receding horizon (dashed) and infinite horizon (dot-dashed) models. Both models naturally produce positively skewed velocity profiles, more closely resembling early-peak velocity, rather than the baseline condition. B, Mean experimental movement durations (bar chart) compared with the receding and infinite horizon model predictions. Both models accurately simulate the variations in the reach durations with perturbation location. Baseline (C) and early-peak velocity condition (D) simulations for receding horizon, infinite horizon and time-to-target (dot-solid lines) models, compared with the experimental data. Only the time-to-target model predicts different visuomotor feedback response intensities for different perturbation onset locations, while receding and infinite horizon models predict constant intensities. Note that models were not fit to match the intensities, only to qualitatively demonstrate the behavior.
Figure 11.
Figure 11.
Validation of the time-to-target model. A, Experimental visuomotor feedback intensities for all five experimental conditions (scatter plot) overlaid with the time-to-target tuning curve. The data and the tuning curve show similar qualitative features. Error bars represent 1 SEM. Marker colors indicate five experimental conditions as described in Figure 2B. B, Experimental data of the visuomotor feedback intensities of Dimitriou et al. (2013), mapped against the time-to-target. Black and orange traces represent mean participant data for 17.5 and 25 cm movement conditions, respectively. C, A scatter plot of individual subjects’ data from B, overlaid by the time-to-target tuning curve. Both, 17.5 and 25 cm movement conditions are combined to a single representation. Different colors represent different perturbation onset distances as in Dimitriou et al. (2013).

References

    1. Acerbi L, Ma WJ (2017) Practical Bayesian optimization for model fitting with Bayesian adaptive direct search. Adv Neural Inf Process Syst 30:1836–1846.
    1. Benguigui N, Ripoll H, Broderick MP (2003) Time-to-contact estimation of accelerated stimuli is based on first-order information. J Exp Psychol Hum Percept Perform 29:1083–1101. 10.1037/0096-1523.29.6.1083 - DOI - PubMed
    1. Corneil BD, Olivier E, Munoz DP (2004) Visual responses on neck muscles reveal selective gating that prevents express saccades. Neuron 42:831–841. 10.1016/S0896-6273(04)00267-3 - DOI - PubMed
    1. Crevecoeur F, Kurtzer I, Bourke T, Scott SH (2013) Feedback responses rapidly scale with the urgency to correct for external perturbations. J Neurophysiol 110:1323–1332. 10.1152/jn.00216.2013 - DOI - PubMed
    1. Cross KP, Cluff T, Takei T, Scott SH (2019) Visual feedback processing of the limb involves two distinct phases. J Neurosci 39:6751–6765. 10.1523/JNEUROSCI.3112-18.2019 - DOI - PMC - PubMed

LinkOut - more resources