. 2020 Apr 7;117(14):7633-7644.
doi: 10.1073/pnas.1916498117. Epub 2020 Mar 25.

Metastasis of cholangiocarcinoma is promoted by extended high-mannose glycans

Affiliations

Metastasis of cholangiocarcinoma is promoted by extended high-mannose glycans

Diane Dayoung Park et al. Proc Natl Acad Sci U S A. .

Abstract

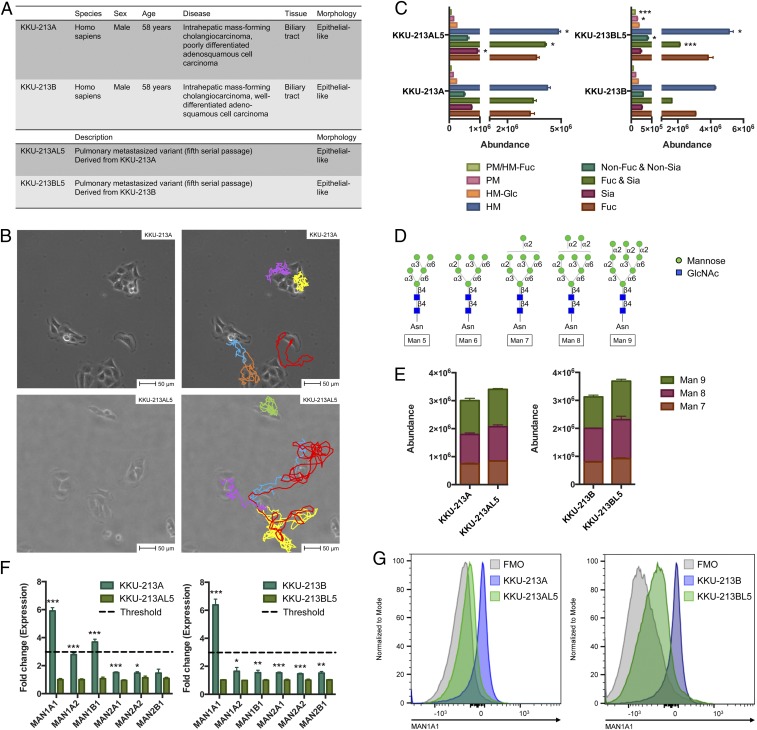
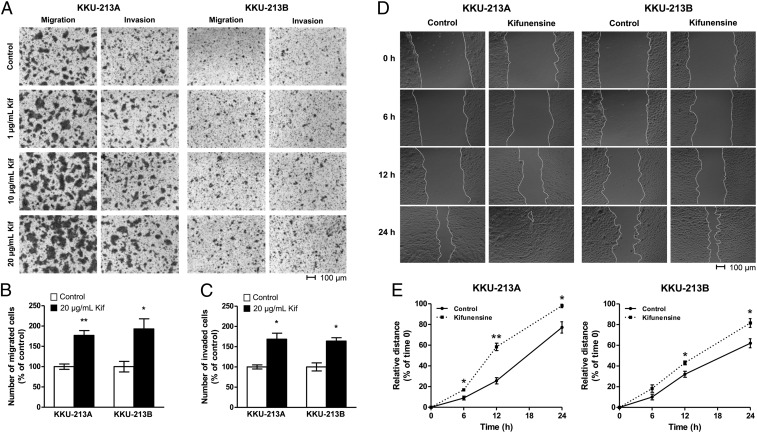
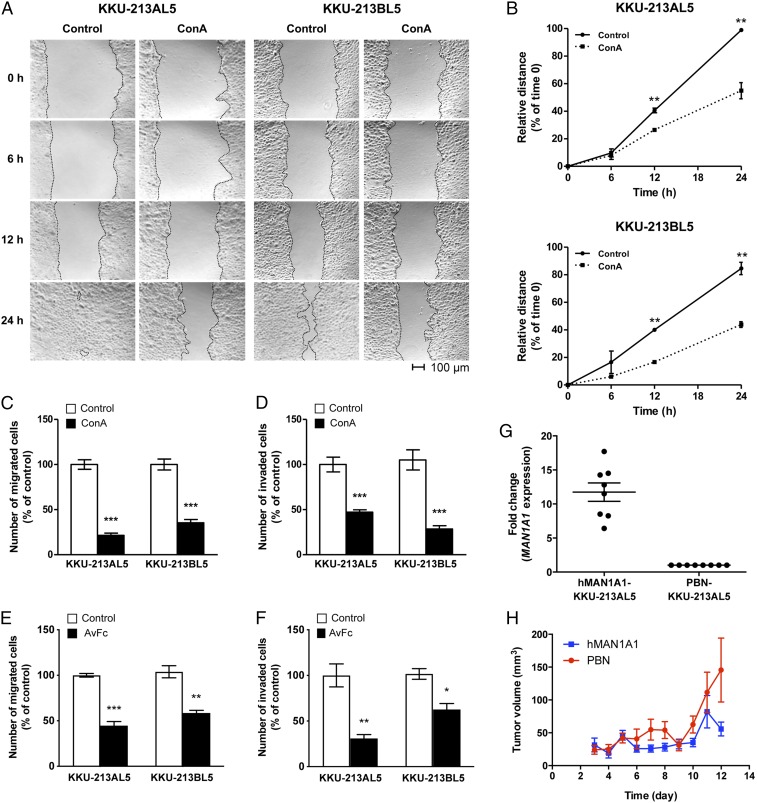
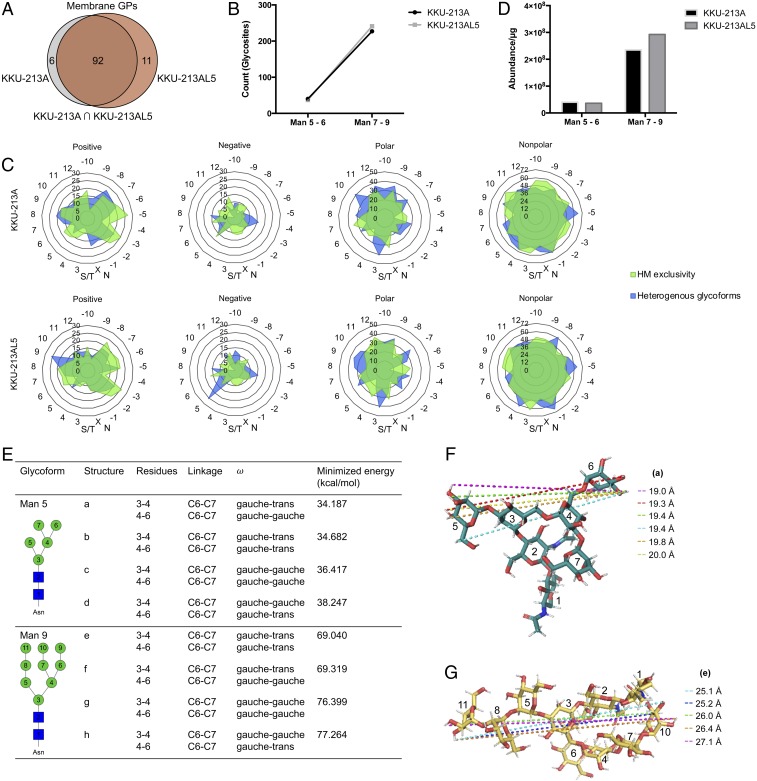
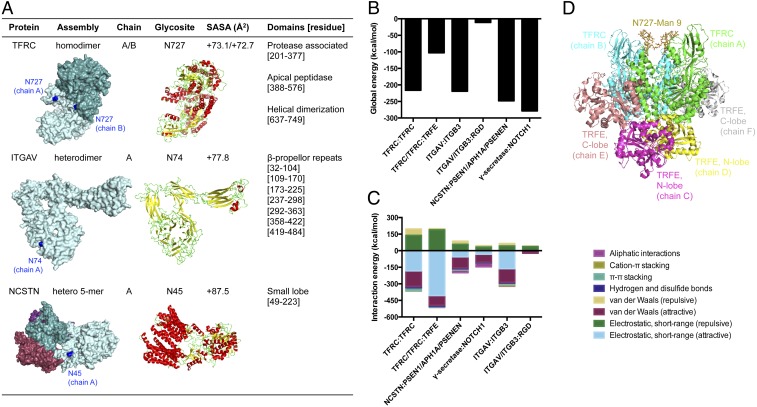
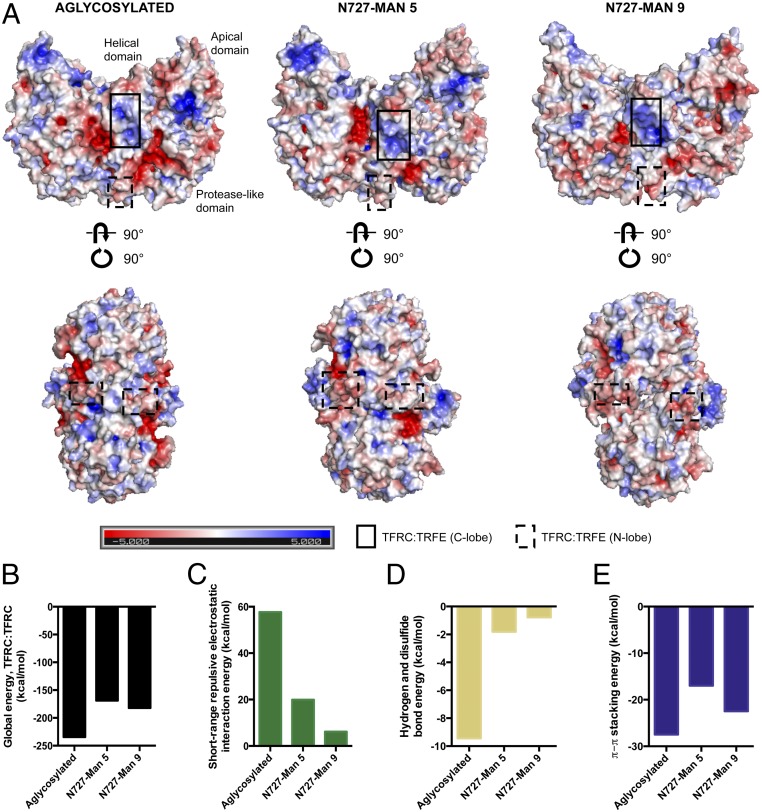
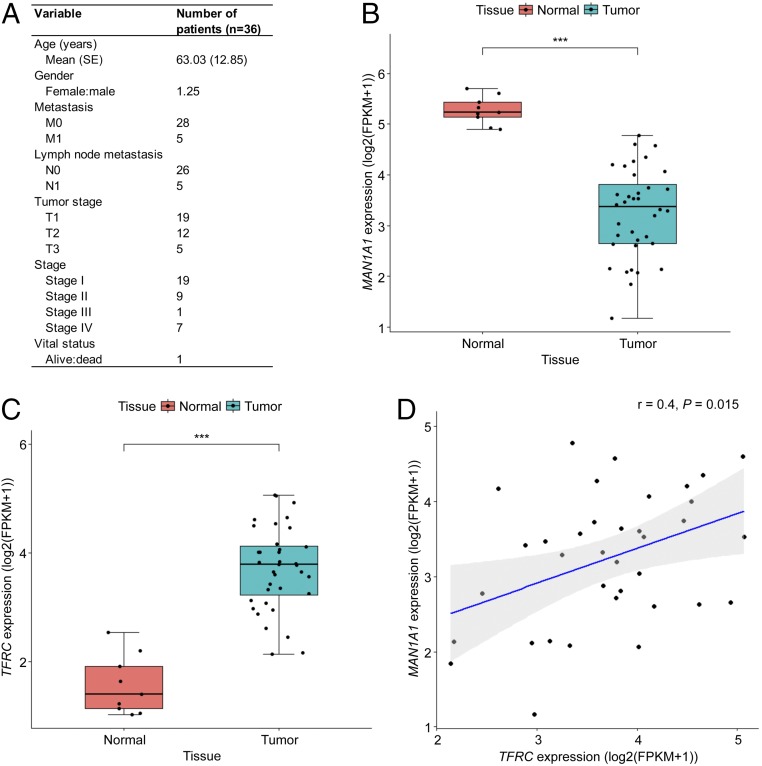
Membrane-bound oligosaccharides form the interfacial boundary between the cell and its environment, mediating processes such as adhesion and signaling. These structures can undergo dynamic changes in composition and expression based on cell type, external stimuli, and genetic factors. Glycosylation, therefore, is a promising target of therapeutic interventions for presently incurable forms of advanced cancer. Here, we show that cholangiocarcinoma metastasis is characterized by down-regulation of the Golgi α-mannosidase I coding gene MAN1A1, leading to elevation of extended high-mannose glycans with terminating α-1,2-mannose residues. Subsequent reshaping of the glycome by inhibiting α-mannosidase I resulted in significantly higher migratory and invasive capabilities while masking cell surface mannosylation suppressed metastasis-related phenotypes. Exclusive elucidation of differentially expressed membrane glycoproteins and molecular modeling suggested that extended high-mannose glycosylation at the helical domain of transferrin receptor protein 1 promotes conformational changes that improve noncovalent interaction energies and lead to enhancement of cell migration in metastatic cholangiocarcinoma. The results provide support that α-1,2-mannosylated N-glycans present on cancer cell membrane proteins may serve as therapeutic targets for preventing metastasis.

Keywords: cholangiocarcinoma; glycosylation; mass spectrometry; membrane proteins; metastasis.


Conflict of interest statement

The authors declare no competing interest.

Figures

Fig. 1.
Fig. 1.
Analysis of parental and metastatic CCA cell surface glycosylation. (A) Morphological and phenotypic characterization of CCA cells. (B) Image capture of live cell microscopy videos of KKU-213A and KKU-213AL5 growth at the beginning of a 24-h incubation at 37 °C. Per given cell, displacement was tracked frame by frame. Colored lines (Right) indicate the direction and extent of each cell’s movement. (Scale bars, 50 μm.) (C) Quantitative changes in N-glycan abundances between parental and metastatic CCA cells based on their compositional features. Groups include high mannose (HM), paucimannose (PM), fucosylated (Fuc), sialylated (Sia), and nondecorated (non-Fuc and non-Sia). Data are represented as mean ± SEM (n = 3); *P < 0.05; ***P < 0.001. (D) Structures of high-mannose N-glycans found in mammalian cells, represented using symbol nomenclature. (E) Abundances of extended high-mannose glycan structures (Man 7 to Man 9) in parental and metastatic CCA cells. Data are represented as mean ± SEM (n = 3). (F) Fold change of glycosylation-related gene expression (normalized to parental) measured by qRT-PCR. Data are represented as mean ± SEM (n = 3); *P < 0.05; **P < 0.01; ***P < 0.001. (G) Intracellular binding of anti-MAN1A1 in parental and metastatic CCA cells, detected by flow cytometry. FMO, fluorescence minus one.
Fig. 2.
Fig. 2.
Enhancement of metastatic phenotypes exhibited by kifunensine-treated parental CCA cells. (A) Microscope images of cells that passed through an uncoated (migration) or Matrigel-coated (invasion) microporous polycarbonate membrane under increasing concentrations of kifunensine (Kif). Cells were stained with crystal violet before imaging. (Scale bars, 100 μm.) (B and C) Number of kifunensine-treated (20 μg/mL) cells that migrated or invaded in comparison to untreated counterparts. Data are represented as mean ± SEM (n = 3); *P < 0.05; **P < 0.01. (D) The extent to which a scratch wound was closed by untreated or treated cells over time. (Scale bars, 100 μm.) (E) Percentage of closure is presented as a measure that is relative to the distance of the wound at t = 0. Data are represented as mean ± SEM (n = 3); *P < 0.05; **P < 0.01.
Fig. 3.
Fig. 3.
Reduction of metastatic phenotypes by capping or decreasing high-mannose glycans on metastatic CCA cells. (A) The extent to which a scratch wound was closed by untreated or ConA-capped cells over time. (Scale bars, 100 μm.) (B) Percentage of closure is presented as a measure that is relative to the distance of the wound at t = 0. Data are represented as mean ± SEM (n = 3); *P < 0.05; **P < 0.01. (CF) Enumerated ConA/AvFc-capped cells that passed through an uncoated (migration) or Matrigel-coated (invasion) microporous polycarbonate membrane compared with respect to native cells. Data are represented as mean ± SEM (n = 3); *P < 0.05; **P < 0.01; ***P < 0.001. (G) Quantitative RT-PCR assessment of the increased expression of MAN1A1 in MAN1A1-transfected KKU-213AL5 cells (hMAN1A1-KKU-213AL5) compared to the PBN-transfected control (PBN-KKU-213AL5). Data are represented as mean ± SEM (n = 6). (H) Volume of tumors formed as a function of time after s.c. injection of PBN- and hMAN1A1-KKU-213AL5 into NSG mice. Data are represented as mean ± SEM (n = 5).
Fig. 4.
Fig. 4.
Distinction of membrane glycoproteins bearing short and extended high-mannose type N-glycans. (A) Number of glycosylated proteins (GPs) associated with the membrane of KKU-213A and/or KKU-213AL5 cells. (B) Number of glycosylated sites (glycosites) on the membrane proteins of KKU-213A and KKU-213AL5 that bear short (Man 5 to 6) or extended (Man 7 to 9) high-mannose type glycans. (C) Frequency of positively charged, negatively charged, polar, and nonpolar amino acid residues surrounding high-mannose–bearing glycosylation sites identified in KKU-213A and KKU-213AL5. Concentric axes show percentage of residues per position relative to the total number of sequons identified in each group. HM, high mannose. Circumferential axes show amino acid position relative to the consensus sequence, N-X-S/T. (D) Abundances of high-mannose–bearing glycopeptides as derived from precursor ion peak areas and normalized to the total protein concentration. (E) Stable conformations of Man 5 (structures a–d) and Man 9 (structures e–h) that arise from conformational isomerism about the C6–C7 bond between residues 3 and 4 and between residues 4 and 6, respectively. (F and G) The largest spanning distances measured between two atoms in Man 5 (structure a) and Man 9 (structure e).
Fig. 5.
Fig. 5.
Localization of high-mannose type glycans within the 3D structures of membrane proteins with elevated abundances in metastatic CCA. (A) Surface and cartoon rendition of membrane glycoproteins up-regulated in KKU-213AL5. Protein chains are named alphabetically and distinguished by color. Glycosylated sites of interest are colored in blue. Alpha helices, beta sheets, and coils are colored in red, yellow, and green, respectively. SASA, solvent accessible surface area. (B) Global energies of major protein–protein and protein–ligand complexes as determined by molecular docking: transferrin receptor protein 1 (TFRC) homodimer, TFRC:serotransferrin (TRFE), integrin αV (ITGAV):integrin β3 (ITGB3), integrin αVβ3:RGD peptide, γ-secretase (nicastrin [NCSTN]:presenilin-1 [PSEN1]/γ-secretase subunit APH-1A [APH1A]/γ-secretase subunit PEN-2 [PSENEN]), and γ-secretase/Notch-1 fragment (NOTCH1). (C) Contributions of interactions to the total energy of complexes. (D) An initial 3D model of the TFRC:TRFE complex built by placing Man 9 at the identified site of glycosylation (blue).
Fig. 6.
Fig. 6.
Dimerization of transferrin receptor protein 1 with and without high-mannose glycosylation. (A) Electrostatic potential surfaces of transferrin receptor protein 1 homodimer that bears no glycan, Man 5, or Man 9 at N727 in the minimized, equilibrated system, as calculated with the Adaptive Poisson–Boltzmann Solver (APBS). The color scale mapped on all surfaces ranges from −5 to 5 as shown in the key. Different perspectives of the dimer are depicted in Top and Bottom. Serotransferrin binding sites are outlined in each perspective. (B) Global energies of the aglycosylated, Man 5-bearing, and Man 9-bearing TFRC dimer as determined by molecular docking. (CE) Contributions of short-range repulsive electrostatic interactions, hydrogen and disulfide bonds, and π–π stacking to the total energy of the aglycosylated and glycosylated homodimer assemblies.
Fig. 7.
Fig. 7.
Expression of MAN1A1 and TFRC in human CCA tissues. (A) Clinical characteristics of patients with primary tumor in the TCGA-CHOL cohort. (B and C) Box plots of MAN1A1 and TFRC expression in CCA tissues (n = 36) and matched normal adjacent tissues (n = 9). FPKM, fragments per kilobase million; ***P < 0.001. (D) Correlation scatter plot of MAN1A1 and TFRC expression in normal and CCA tissues. r, Pearson correlation coefficient.

References

    1. Bogenrieder T., Herlyn M., Axis of evil: Molecular mechanisms of cancer metastasis. Oncogene 22, 6524–6536 (2003). - PubMed
    1. Friedl P., Wolf K., Tumour-cell invasion and migration: Diversity and escape mechanisms. Nat. Rev. Cancer 3, 362–374 (2003). - PubMed
    1. Geiger T. R., Peeper D. S., Metastasis mechanisms. Biochim. Biophys. Acta 1796, 293–308 (2009). - PubMed
    1. Khan S. A., Thomas H. C., Davidson B. R., Taylor-Robinson S. D., Cholangiocarcinoma. Lancet 366, 1303–1314 (2005). - PubMed
    1. Dube D. H., Bertozzi C. R., Glycans in cancer and inflammation'–potential for therapeutics and diagnostics. Nat. Rev. Drug Discov. 4, 477–488 (2005). - PubMed

Publication types