. 2020 Mar 25;3(4):e201900593.
doi: 10.26508/lsa.201900593. Print 2020 Apr.

Mylk3 null C57BL/6N mice develop cardiomyopathy, whereas Nnt null C57BL/6J mice do not

Affiliations

Mylk3 null C57BL/6N mice develop cardiomyopathy, whereas Nnt null C57BL/6J mice do not

Jack L Williams et al. Life Sci Alliance. .

Abstract

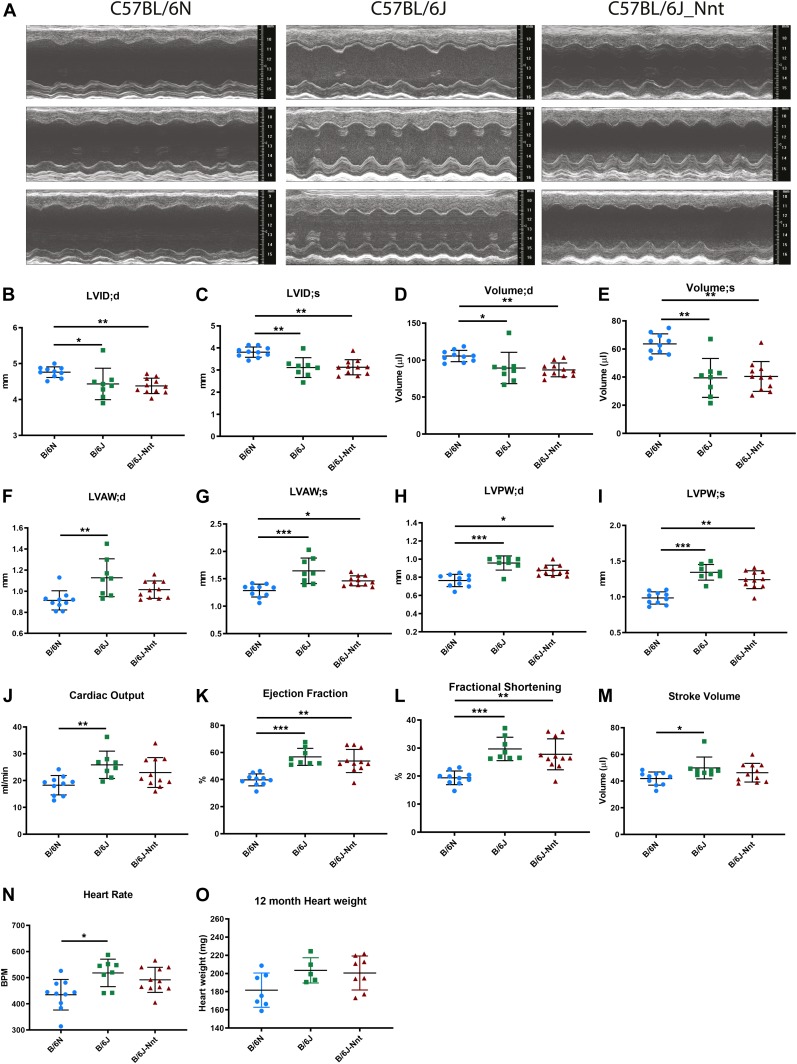
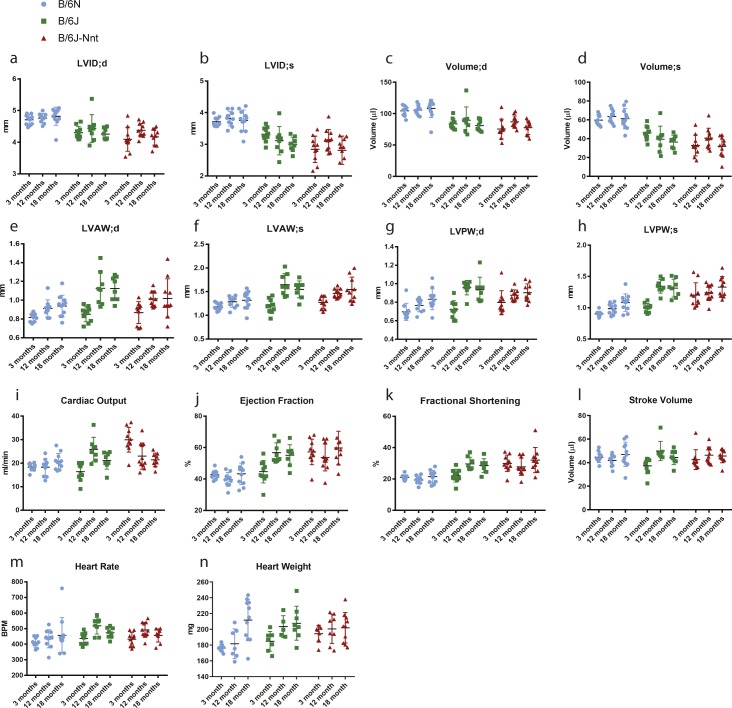
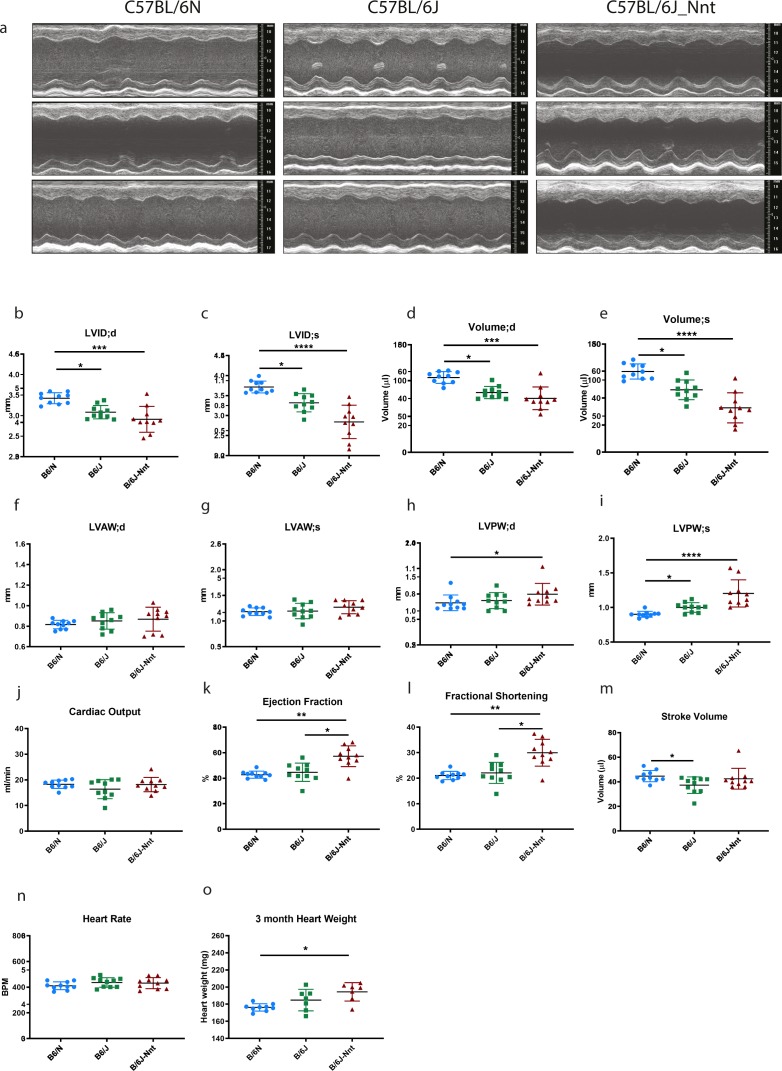
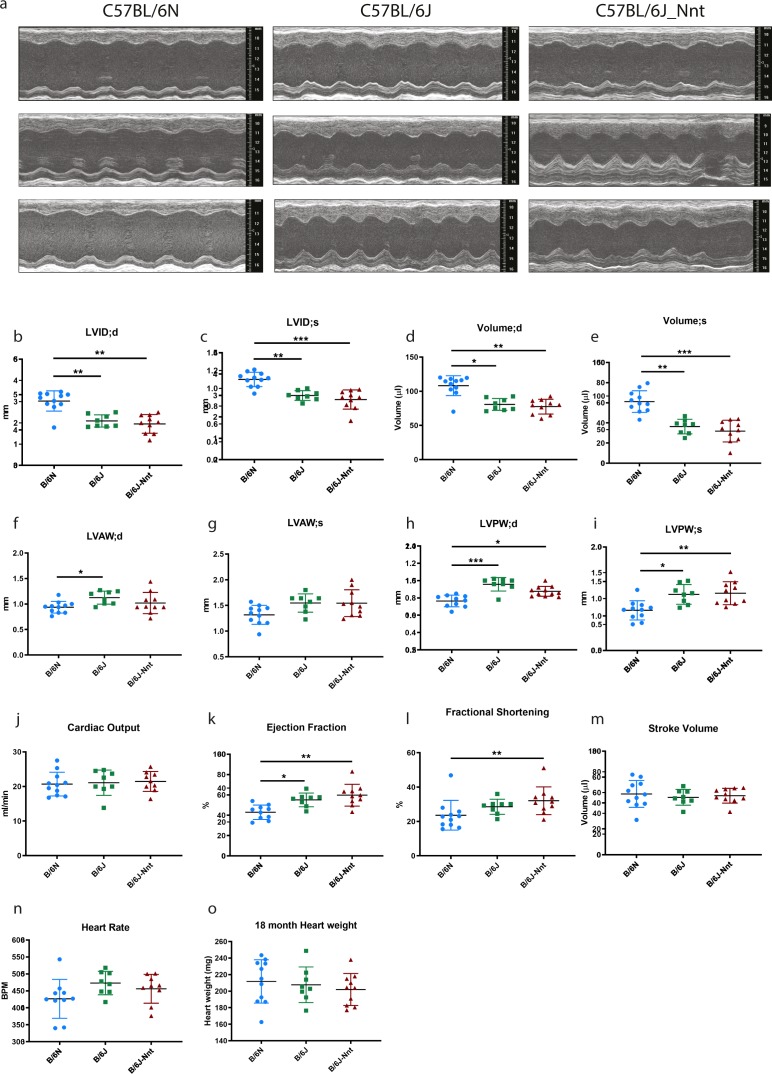
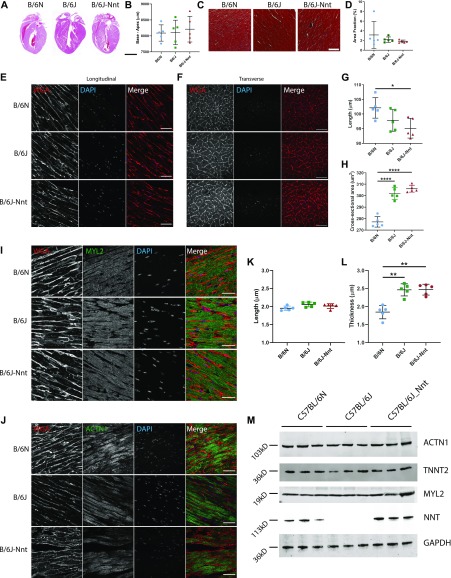
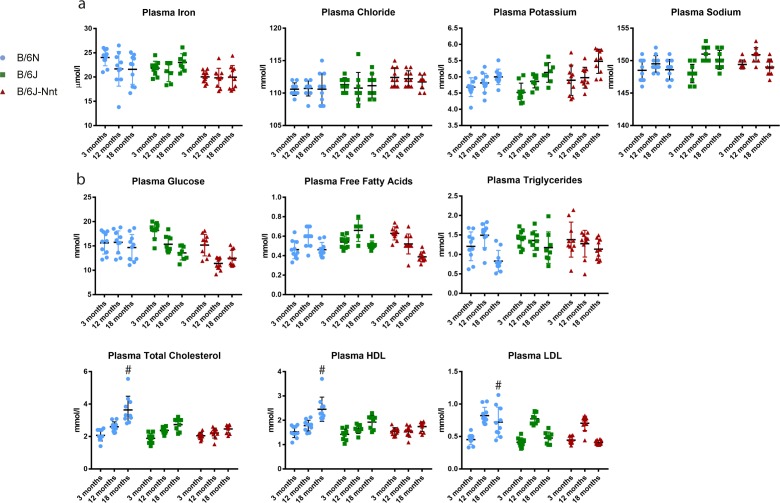
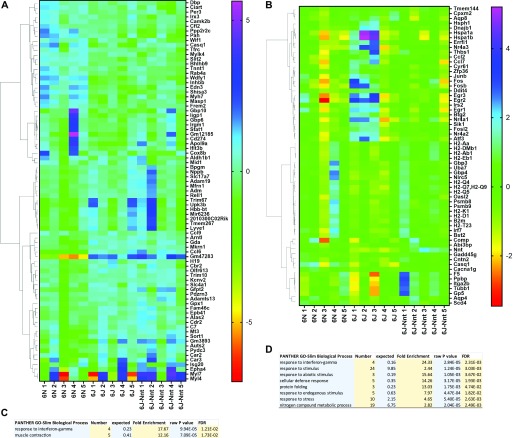
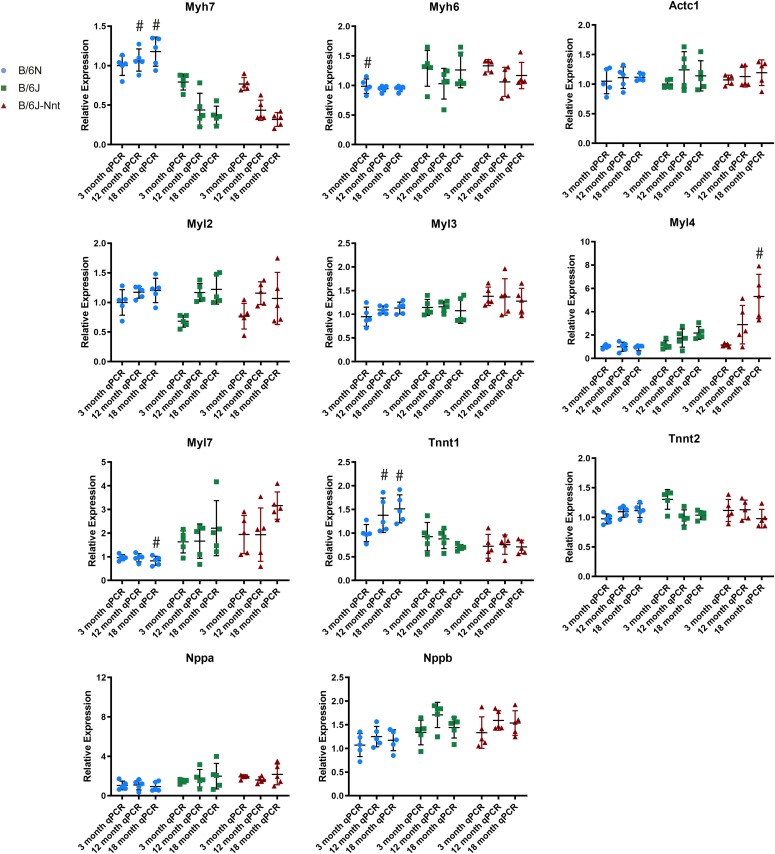
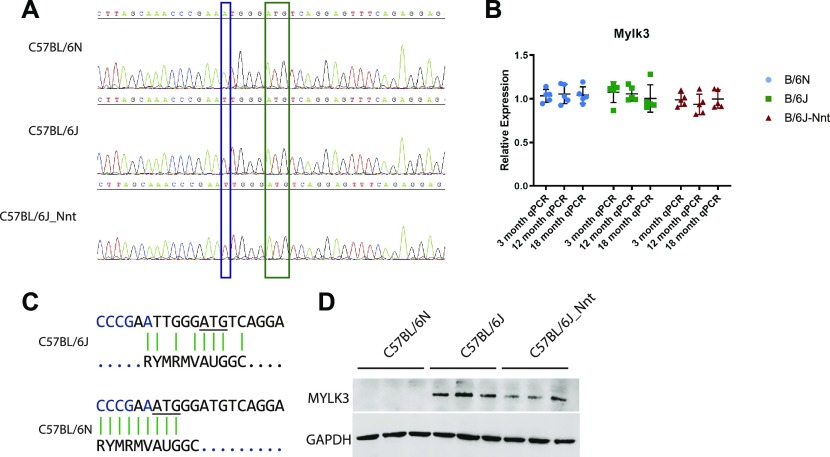
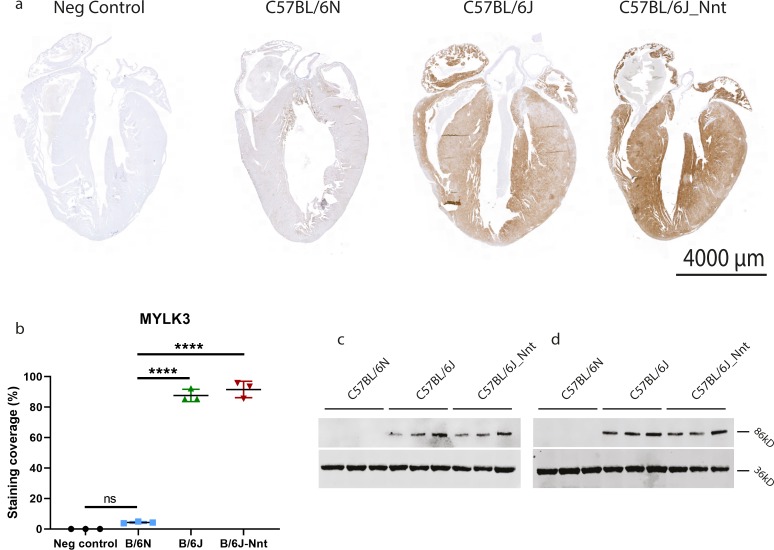
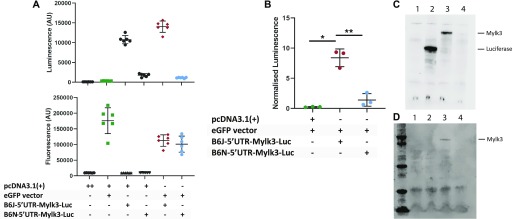
The C57BL/6J and C57BL/6N mice have well-documented phenotypic and genotypic differences, including the infamous nicotinamide nucleotide transhydrogenase (Nnt) null mutation in the C57BL/6J substrain, which has been linked to cardiovascular traits in mice and cardiomyopathy in humans. To assess whether Nnt loss alone causes a cardiovascular phenotype, we investigated the C57BL/6N, C57BL/6J mice and a C57BL/6J-BAC transgenic rescuing NNT expression, at 3, 12, and 18 mo. We identified a modest dilated cardiomyopathy in the C57BL/6N mice, absent in the two B6J substrains. Immunofluorescent staining of cardiomyocytes revealed eccentric hypertrophy in these mice, with defects in sarcomere organisation. RNAseq analysis identified differential expression of a number of cardiac remodelling genes commonly associated with cardiac disease segregating with the phenotype. Variant calling from RNAseq data identified a myosin light chain kinase 3 (Mylk3) mutation in C57BL/6N mice, which abolishes MYLK3 protein expression. These results indicate the C57BL/6J Nnt-null mice do not develop cardiomyopathy; however, we identified a null mutation in Mylk3 as a credible cause of the cardiomyopathy phenotype in the C57BL/6N.


Conflict of interest statement

The authors declare that they have no conflict of interest.

Figures

Figure 1.
Figure 1.. B6N mice exhibit dilated CM.
(A) Representative echocardiogram traces from three 12-mo-old mice at each genotype. (B) LVID;d, left ventricular internal diameter at the end of diastole. (C) LVID;s, left ventricular internal diameter at the end of systole. (D) Left ventricular volume at the end of diastole. (E) Left ventricular volume at the end of systole. (F) LVAW;d, left ventricular anterior wall thickness at the end of diastole. (G) LVAW;s, left ventricular anterior wall thickness at the end of systole. (H) LVPW;d, left ventricular posterior wall thickness at the end of diastole. (I) LVPW;s, left ventricular posterior wall thickness at the end of systole. (J) Cardiac output = stroke volume × heart rate. (K) Ejection fraction = stroke volume/end diastolic volume. (L) Fractional shortening = (LVID;d − LVID;s)/LVID;d. (M) Stroke volume = volume at the end of diastole − volume at the end of systole. (N) Heart rate. (O) Heart weights of 12-mo-old mice at cull. Kruskal–Wallis, B6N n = 10, B6J n = 8, B6J-Nnt n = 11, mean ± SD, * < 0.05, ** < 0.01, *** < 0.001, **** < 0.0001.
Figure S1.
Figure S1.. Collated echocardiography results from 3-, 12- and 18-mo-old mice.
Collated echocardiography data across all age-groups. (A) LVID;d, left ventricular internal diameter at the end of diastole. (B) LVID;s, left ventricular internal diameter at the end of systole. (C) Left ventricular volume at the end of diastole. (D) Left ventricular volume at the end of systole. (E) LVAW;d, left ventricular anterior wall thickness at the end of diastole. (F) LVAW;s, left ventricular anterior wall thickness at the end of systole. (G) LVPW;d, left ventricular posterior wall thickness at end of diastole. (H) LVPW;s, left ventricular posterior wall thickness at the end of systole. (I) Cardiac output = stroke volume × heart rate. (J) Ejection fraction = stroke volume/end diastolic volume. (K) Fractional shortening = (LVID;d − LVID;s)/LVID;d. (L) Stroke volume = volume at end of diastole − volume at end of systole. (M) Heart rate. (N) Heart weights of 3-, 12- and 18-mo-old mice. Significance scoring is displayed in Fig S1 for 12-mo-old mice, Fig S2 for 3-mo-old mice, and Fig S3 for 18-mo-old mice.
Figure S2.
Figure S2.. 3-mo-old B6N mice have dilated ventricles and larger ventricular volumes than both B6J substrains.
(A) Representative echocardiogram traces from three 3-mo-old mice at each genotype. (B) LVID;d, left ventricular internal diameter at the end of diastole. (C) LVID;s, left ventricular internal diameter at the end of systole. (D) Left ventricular volume at the end of diastole. (E) Left ventricular volume at the end of systole. (F) LVAW;d, left ventricular anterior wall thickness at the end of diastole. (G) LVAW;s, left ventricular anterior wall thickness at the end of systole. (H) LVPW;d, left ventricular posterior wall thickness at the end of diastole. (I) LVPW;s, left ventricular posterior wall thickness at the end of systole. (J) Cardiac output = stroke volume × heart rate. (K) Ejection fraction = stroke volume/end diastolic volume (L) Fractional shortening = (LVID;d − LVID;s)/LVID;d. (M) Stroke volume = volume at end of diastole − volume at end of systole. (N) Heart rate. (O) Heart weights of 3-mo-old mice at cull. Kruskal–Wallis, n = 10, mean ± SD, * < 0.05, ** < 0.01, *** < 0.001, **** < 0.0001.
Figure S3.
Figure S3.. 18-mo-old B6N mice have structurally and functionally different echocardiography profiles compared with both B6J substrains.
(A) Representative echocardiogram traces from three 18-mo-old mice at each genotype. (B) LVID;d, left ventricular internal diameter at the end of diastole. (C) LVID;s, left ventricular internal diameter at the end of systole. (D) Left ventricular volume at the end of diastole. (E) Left ventricular volume at the end of systole. (F) LVAW;d, left ventricular anterior wall thickness at the end of diastole. (G) LVAW;s, left ventricular anterior wall thickness at the end of systole. (H) LVPW;d, left ventricular posterior wall thickness at the end of diastole. (I) LVPW;s, left ventricular posterior wall thickness at the end of systole. (J) Cardiac output = stroke volume × heart rate. (K) Ejection fraction = stroke volume/end diastolic volume. (L) Fractional shortening = (LVID;d − LVID;s)/LVID;d. (M) Stroke volume = volume at end of diastole − volume at end of systole. (N) Heart rate. (O) Heart weights of 18-mo-old mice at cull. Kruskal–Wallis, B6N n = 11, B6J n = 8, B6J-Nnt n = 10, mean ± SD, * < 0.05, ** < 0.01, *** < 0.001, **** < 0.0001.
Figure 2.
Figure 2.. Differences in microstructure of the heart amongst the three strains.
(A) Representative images of 18-mo heart tissues stained with haematoxylin and eosin. Scale bar = 4,000 μm. (B) Base–apex measurements from H&E–stained sections. No significant difference in heart length. (C) Representative images of 18-mo heart tissues stained with Masson’s Trichrome. Scale bar = 200 μm. (D) Quantitation of fibrosis from Masson’s Trichrome–stained sections. n = 5 mouse hearts per group. Five sections per individual, three areas per section. Kruskal–Wallis test for grouped data, mean ± SD. (E, F) Immunofluorescent staining for wheat germ agglutinin (red) and DAPI (blue) in longitudinal (E) and transverse (F) sections of cardiomyocytes in heart tissues. Scale bar = 50 μm. (E, F, G, H) Quantitation of cardiomyocyte length (G) and cross-sectional area (H) from WGA staining in (E, F). Kruskal–-Wallis test for grouped data, n = 5, mean ± SD. (I) Immunofluorescence staining for WGA (red), MYL2 (green), and DAPI (blue). Scale bar = 50 μm. (J) Immunofluorescence staining for WGA (red), alpha-actinin (ACTN1) (green), and DAPI (blue). (I, J, K, L) Quantification of sarcomere length and thickness from images in (I) and (J) using MyofibrilJ. n = 5 mouse hearts per group. Five sections per individual, three areas per section. Kruskal–Wallis test for grouped data, mean ± SD. (M) Western blot for ACTN1, TNNT2, MYL2, GAPDH, and NNT in 18-mo heart lysates, n = 3 mice per group. * < 0.05, ** < 0.01, *** < 0.001, **** < 0.0001.
Figure S4.
Figure S4.. Collated plasma biochemistry.
Profile of biochemical markers from plasma at 3-, 12-, and 18 mo. (A) Concentration of measured plasma ions. (B) Concentration of measured plasma carbohydrates, lipids, and lipoproteins. Kruskal–Wallis at each time point; n = 8 minimum, n = 13 maximum, mean ± SD. # symbol indicates one substrain differs significantly from the other two at that time point with a P-value less than 0.05.
Figure 3.
Figure 3.. RNAseq reveals strain-dependent and NNT-dependent genes.
Differentially expressed genes generated by CuffDiff TopHat pipeline, clustered according to the expression profile across samples. Values for each cell are calculated as the log2[x + 1], where x is the counts for that gene. Each subsequent value for a gene is then subtracted from the average of all the values for that gene. These values are then used to generate the heat map. Mouse group indicated at the base of each column. (A) Heat map of gene list segregated by strain. (B) Heat map of gene list segregated by NNT status. (A, C) Gene Ontology list generated by Panther open access software from gene list in (A). (B, D) Gene Ontology list generated by Panther open access software from gene list in (B).
Figure 4.
Figure 4.. RT-qPCR analysis of key cardiac genes.
Collated RT-qPCR data. All RT-qPCR expression values generated by ∆∆CT method. Actc1, actin, alpha, cardiac muscle 1; Myh6, myosin heavy chain 6; Myh7, myosin heavy chain 7; Myl2, myosin light chain 2; Myl3, myosin light chain 3; Myl4, myosin light chain 4; Myl7, myosin light chain 7; Nppa, natriuretic peptide precursor A; Nppb, natriuretic peptide precursor B; Tnnt1, troponin T1, skeletal type; Tnnt2, troponin T2, cardiac type. RT-qPCR expression of key cardiac genes. Kruskal–Wallis test at each time point, n = 4, mean ± SD. # symbol indicates one substrain differs significantly from the other two at that time point with a P-value less than 0.05.
Figure 5.
Figure 5.. SNP in Mylk3 abolishes protein expression in C57BL/6N hearts.
(A) Representative chromatogram of Sanger sequencing of Mylk3 in DNA isolated from 3-mo heart samples of each group. Blue box indicates SNP and A of alternate TIS in B6N and green box indicates the canonical translation initiation site. (B) RT-qPCR analysis of Mylk3 expression. One-way ANOVA at each time point; n = 5, mean ± SD. (C) Kozak signature analysis of translation initiation site in B6J (upper pane) and B6N (lower pane) showing the alternate TIS for the B6N variant. (D) Western blot staining of GAPDH and MYLK3 in 3-mo heart tissue lysates.
Figure S5.
Figure S5.. B6N stain negative for MYLK3, whereas B6J hearts show a gradient of expression.
(A) Immunohistochemical staining of MYLK3 in paraffin heart sections. Scale bar = 4,000 μm. (B, D) Quantification of IHC staining in (D). Kruskal–Wallis, n = 3 mice, three sections per mouse, mean ± SD. (C, D) MYLK3 expression is absent at 12 (C) and 18 (D) mo.
Figure 6.
Figure 6.. 5′UTR MYLK3 mutation in C57BL/6N is sufficient to abrogate protein expression.
(A) Luminescence (upper panel) and fluorescence (lower panel) signal in cells transfected with a combination of empty vector, GFP, and luciferase vectors signified by the table. Representative experiment from three experimental repeats with six technical replicates. (B) Normalised luminescence. One-way ANOVA Brown–Forsythe and Welch test; n = 3, mean ± SD. (C) Coupled transcription–translation expression of genes under control of T7 promoter: Sample in lane 1 contains no template DNA; lane 2 contains a luciferase control vector; lane 3 contains a pcDNA3.1(+) vector expressing MYLK3 with the 5′UTR from C57BL/6J mice; lane 4 contains a pcDNA3.1(+) vector expressing MYLK3 with the 5′UTR from C57BL/6N mice. Proteins detected by chemiluminescent substrate. (D) Samples as above, detected by blotting with MYLK3. (C, D) are representative of three repeats.

References

    1. Zhao W, Zhao T, Chen Y, Zhao F, Gu Q, Williams RW, Bhattacharya SK, Lu L, Sun Y (2015) A murine hypertrophic cardiomyopathy model: The DBA/2J strain. PLoS One 10: e0133132 10.1371/journal.pone.0133132 - DOI - PMC - PubMed
    1. Kraev A. (2014) Parallel universes of black six biology. Biol Direct 9: 18 10.1186/1745-6150-9-18 - DOI - PMC - PubMed
    1. Huang T-T, Naeemuddin M, Elchuri S, Yamaguchi M, Kozy HM, Carlson EJ, Epstein CJ (2006) Genetic modifiers of the phenotype of mice deficient in mitochondrial superoxide dismutase. Hum Mol Genet 15: 1187–1194. 10.1093/hmg/ddl034 - DOI - PubMed
    1. Coley WD, Bogdanik L, Vila MC, Yu Q, Van Der Meulen JH, Rayavarapu S, Novak JS, Nearing M, Quinn JL, Saunders A, et al. (2016) Effect of genetic background on the dystrophic phenotype in mdx mice. Hum Mol Genet 25: 130–145. 10.1093/hmg/ddv460 - DOI - PMC - PubMed
    1. Riordan JD, Nadeau JH (2017) From peas to disease: Modifier genes, network resilience, and the genetics of health. Am J Hum Genet 101: 177–191. 10.1016/j.ajhg.2017.06.004 - DOI - PMC - PubMed

Publication types

MeSH terms