. 2020 Jun;8(6):794-805.
doi: 10.1158/2326-6066.CIR-19-0619. Epub 2020 Mar 25.

Histone Deacetylase Inhibitors and IL21 Cooperate to Reprogram Human Effector CD8+ T Cells to Memory T Cells

Affiliations

Histone Deacetylase Inhibitors and IL21 Cooperate to Reprogram Human Effector CD8+ T Cells to Memory T Cells

Junmei Wang et al. Cancer Immunol Res. 2020 Jun.

Abstract

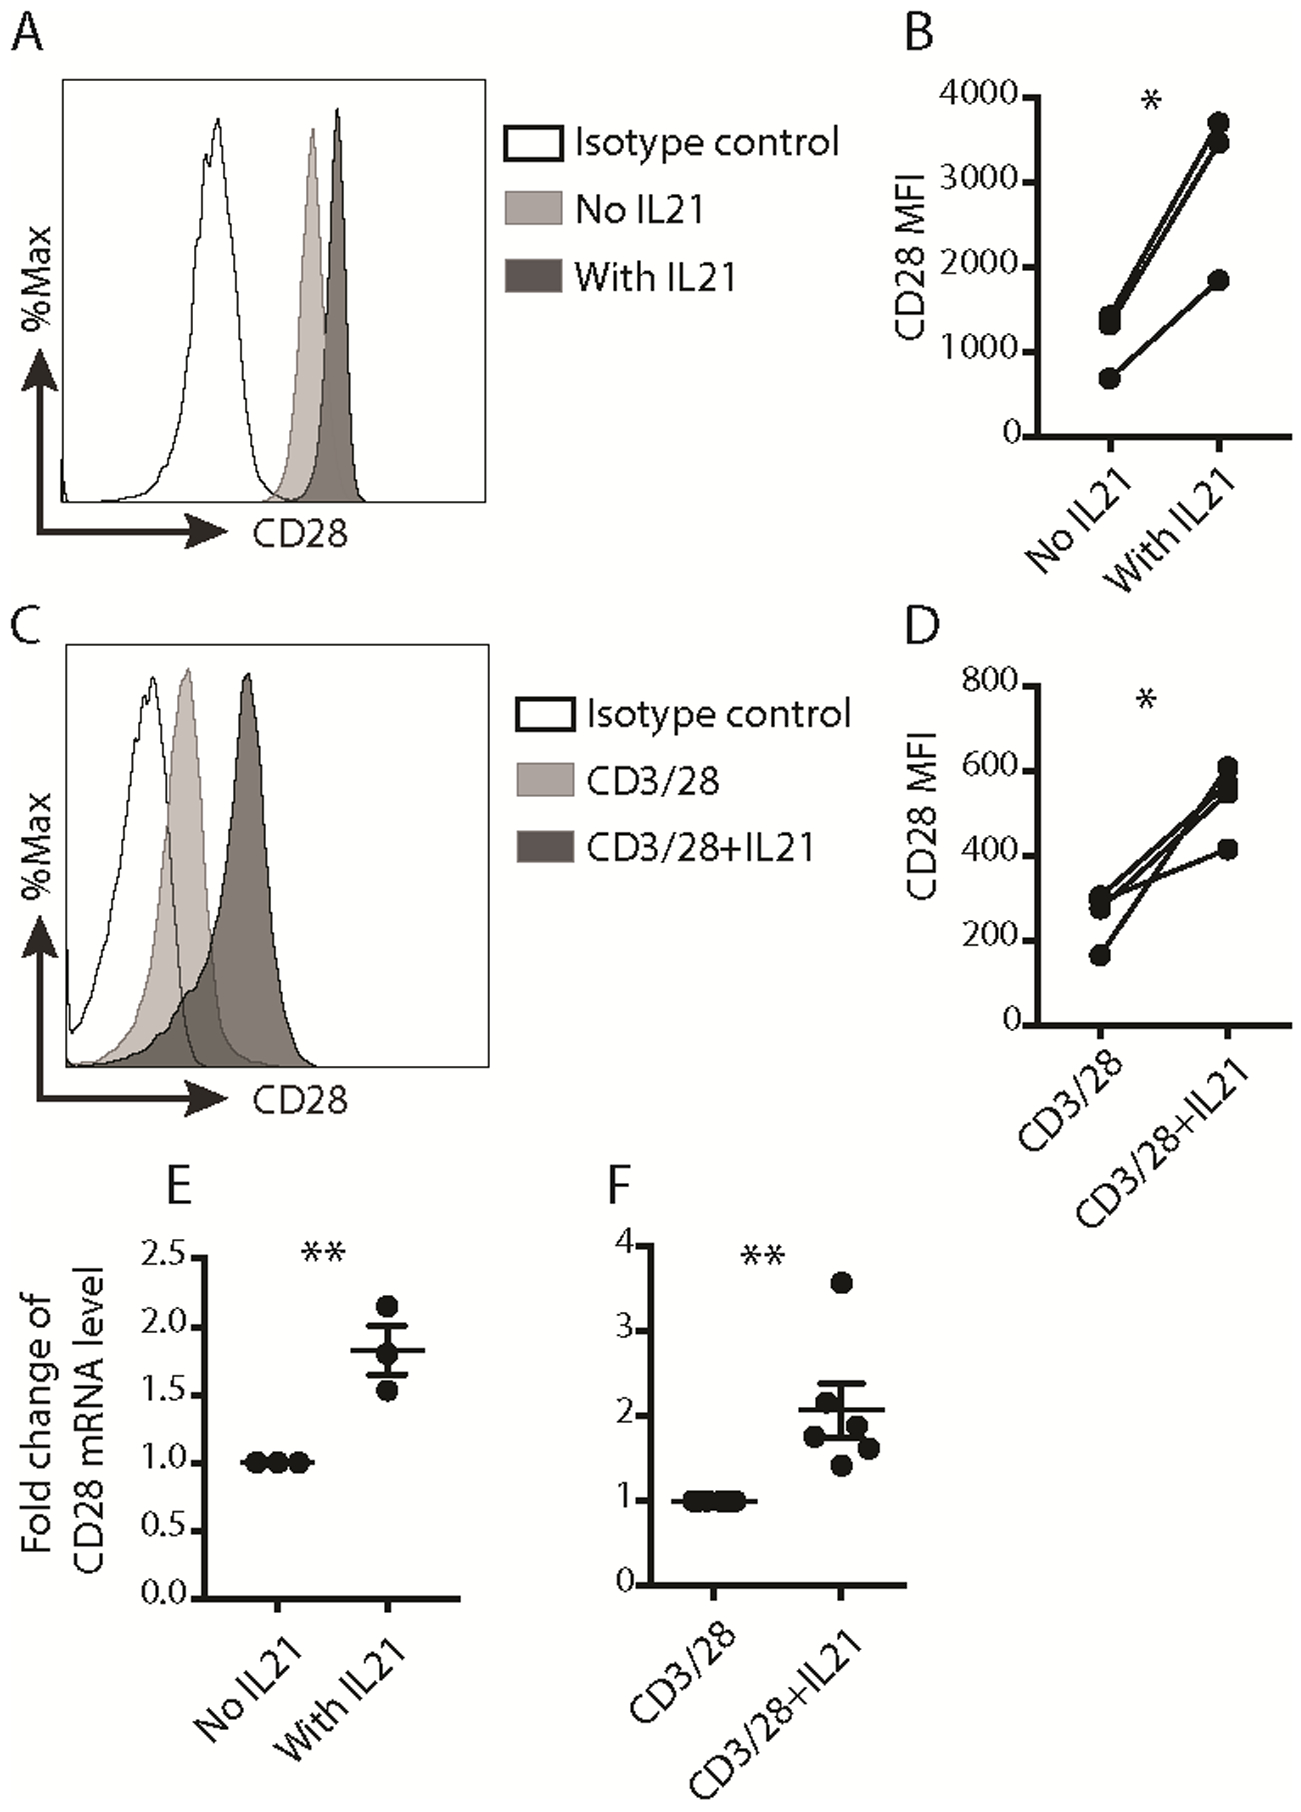
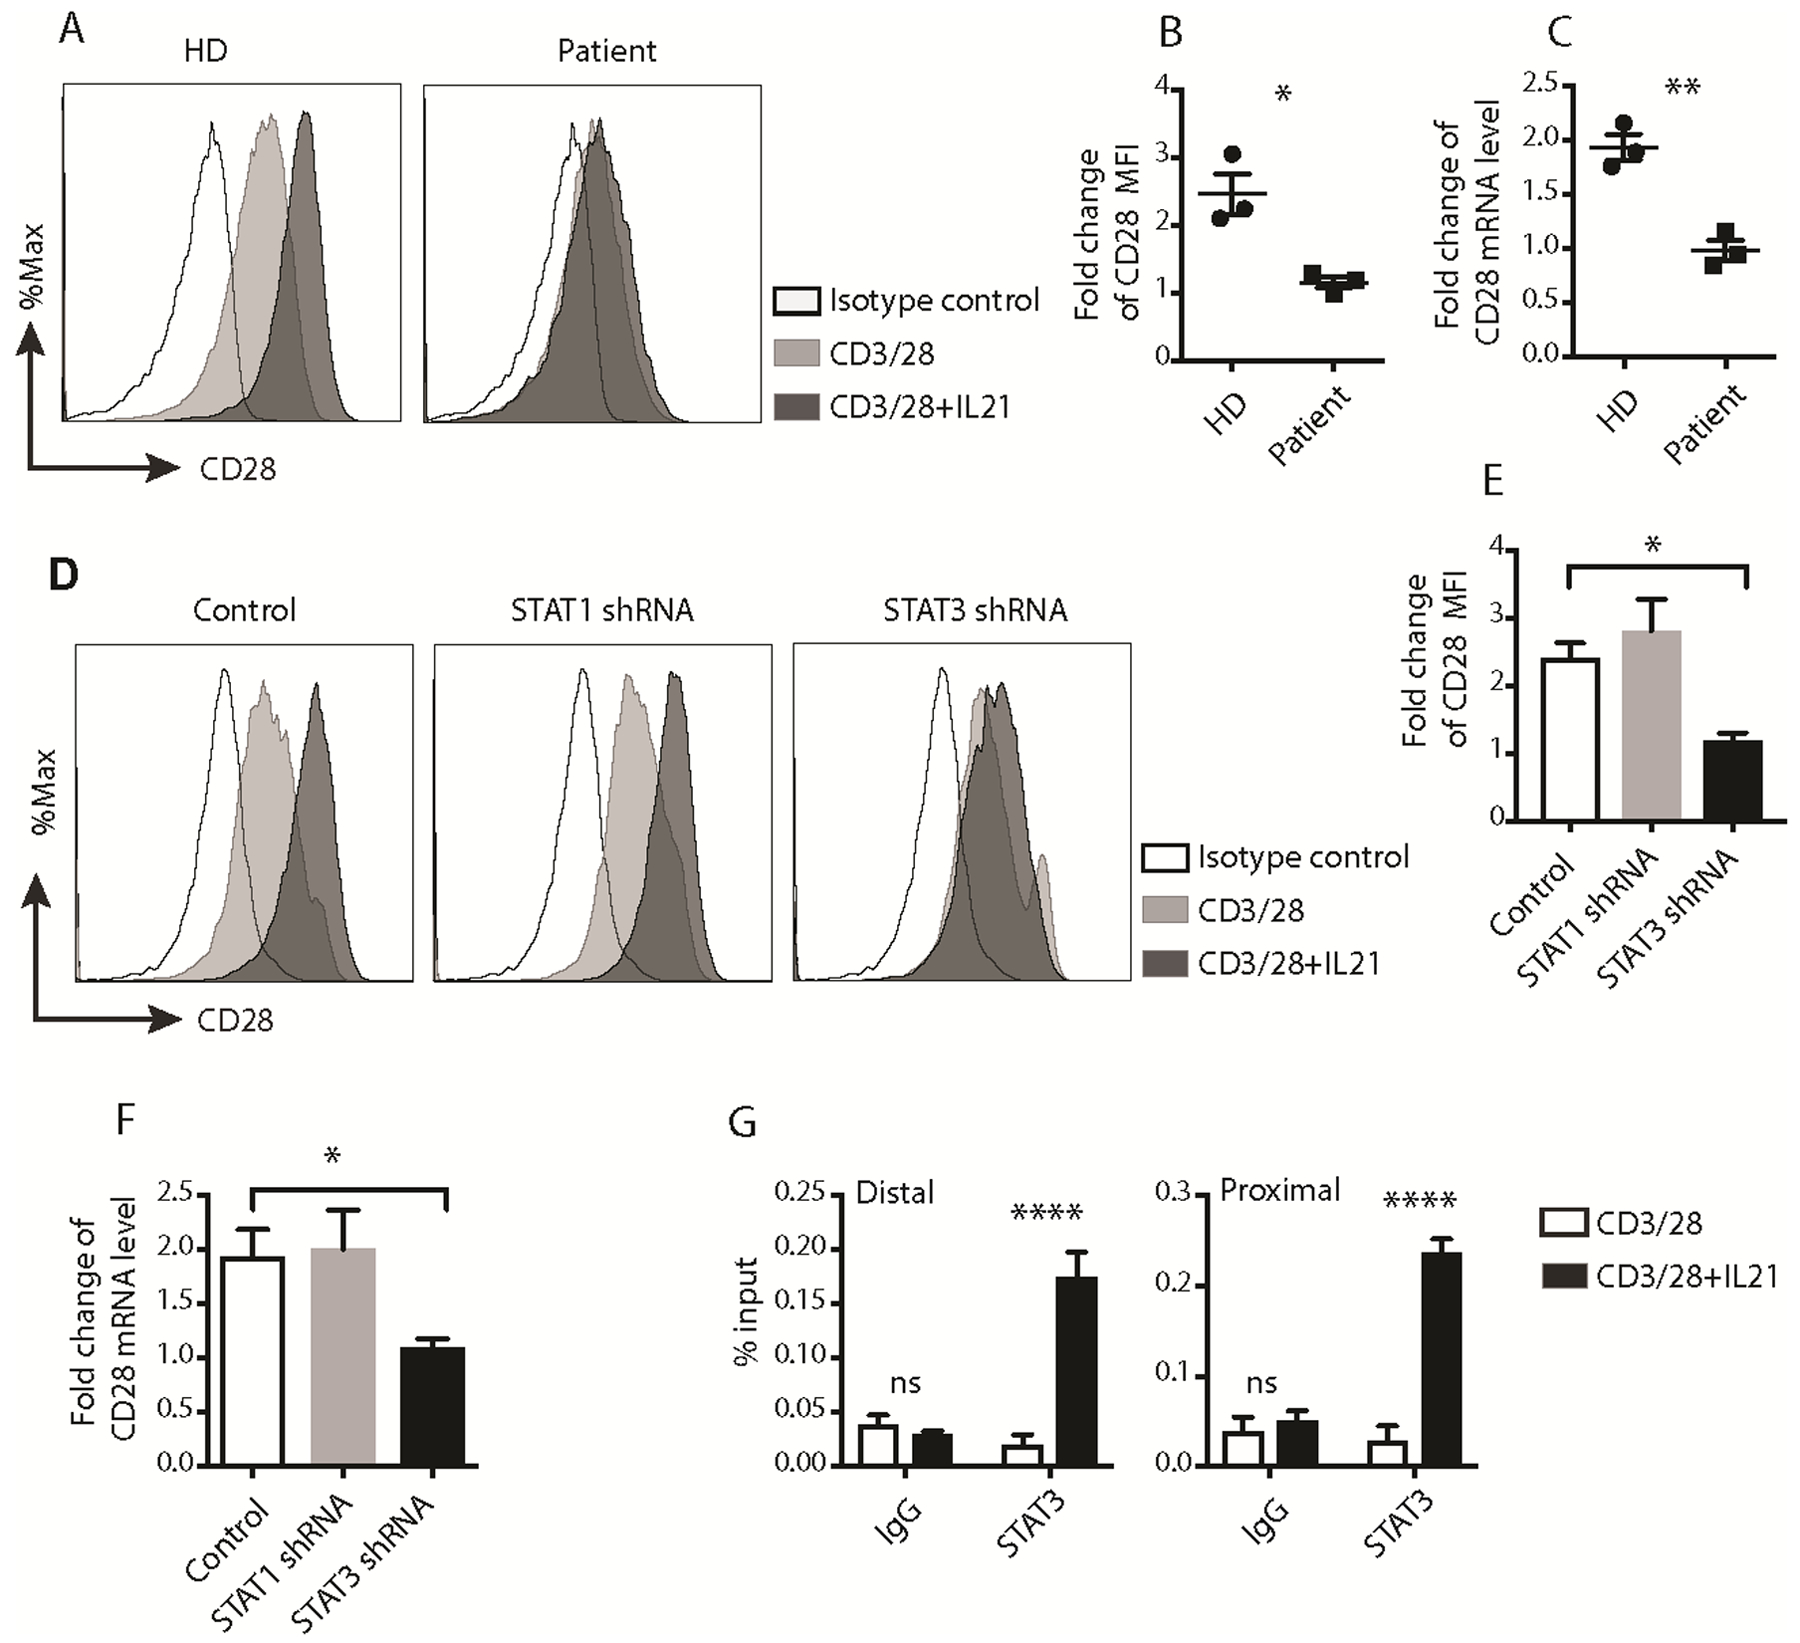
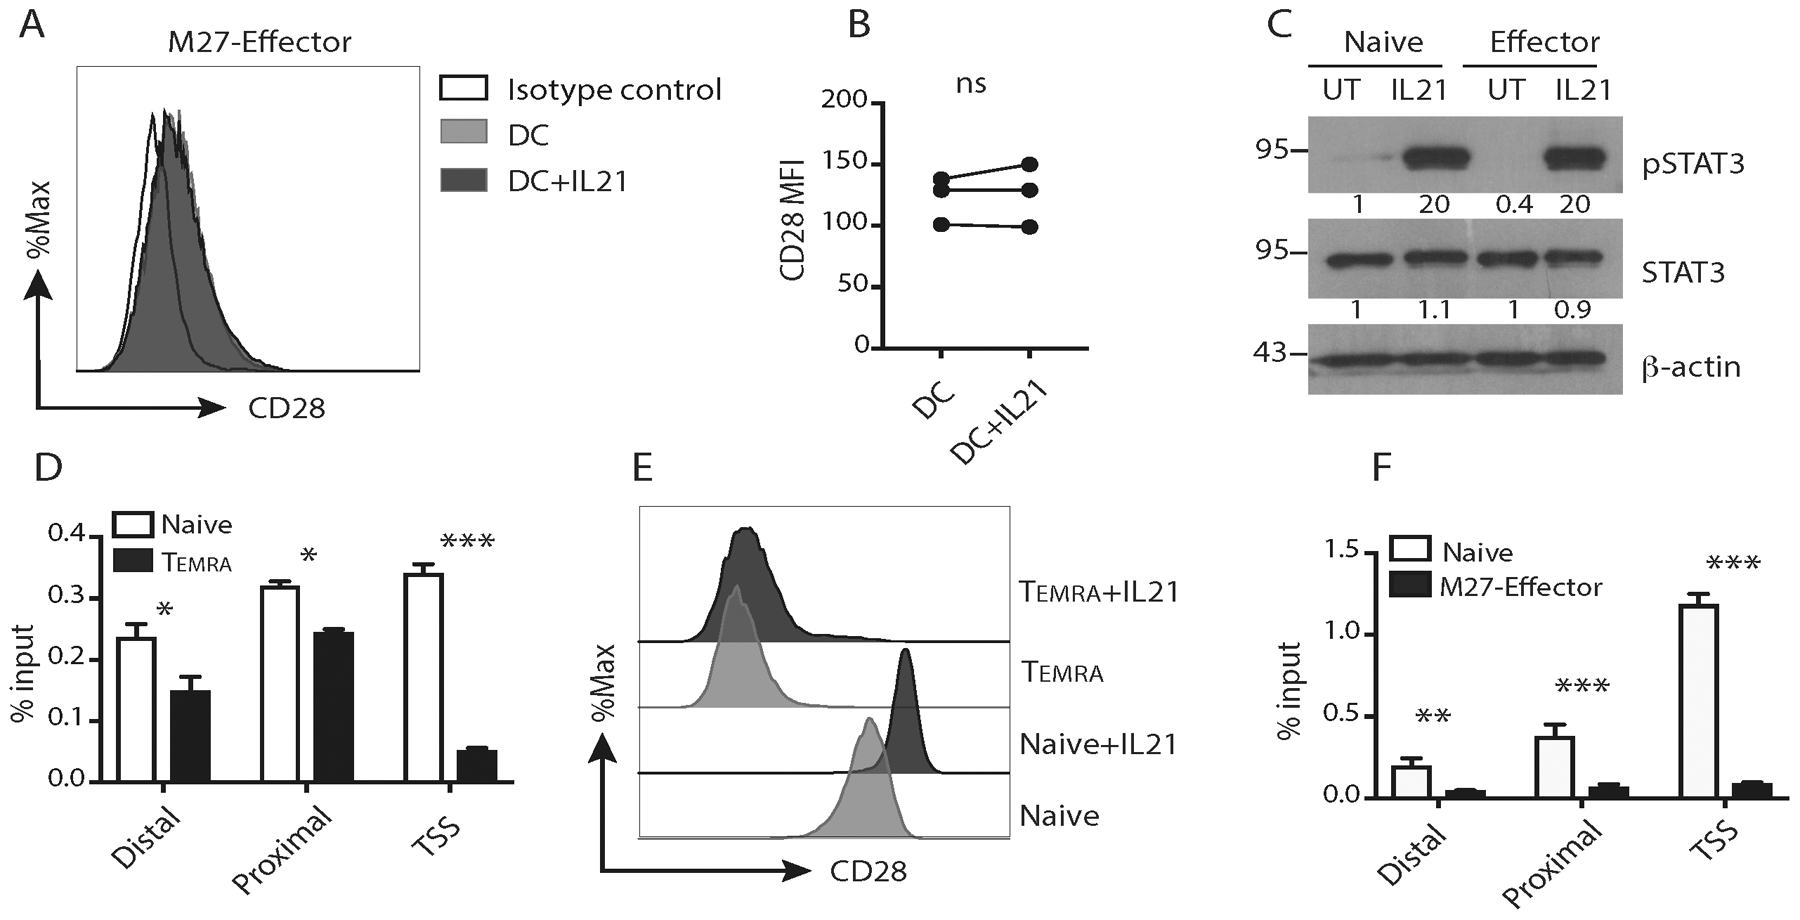
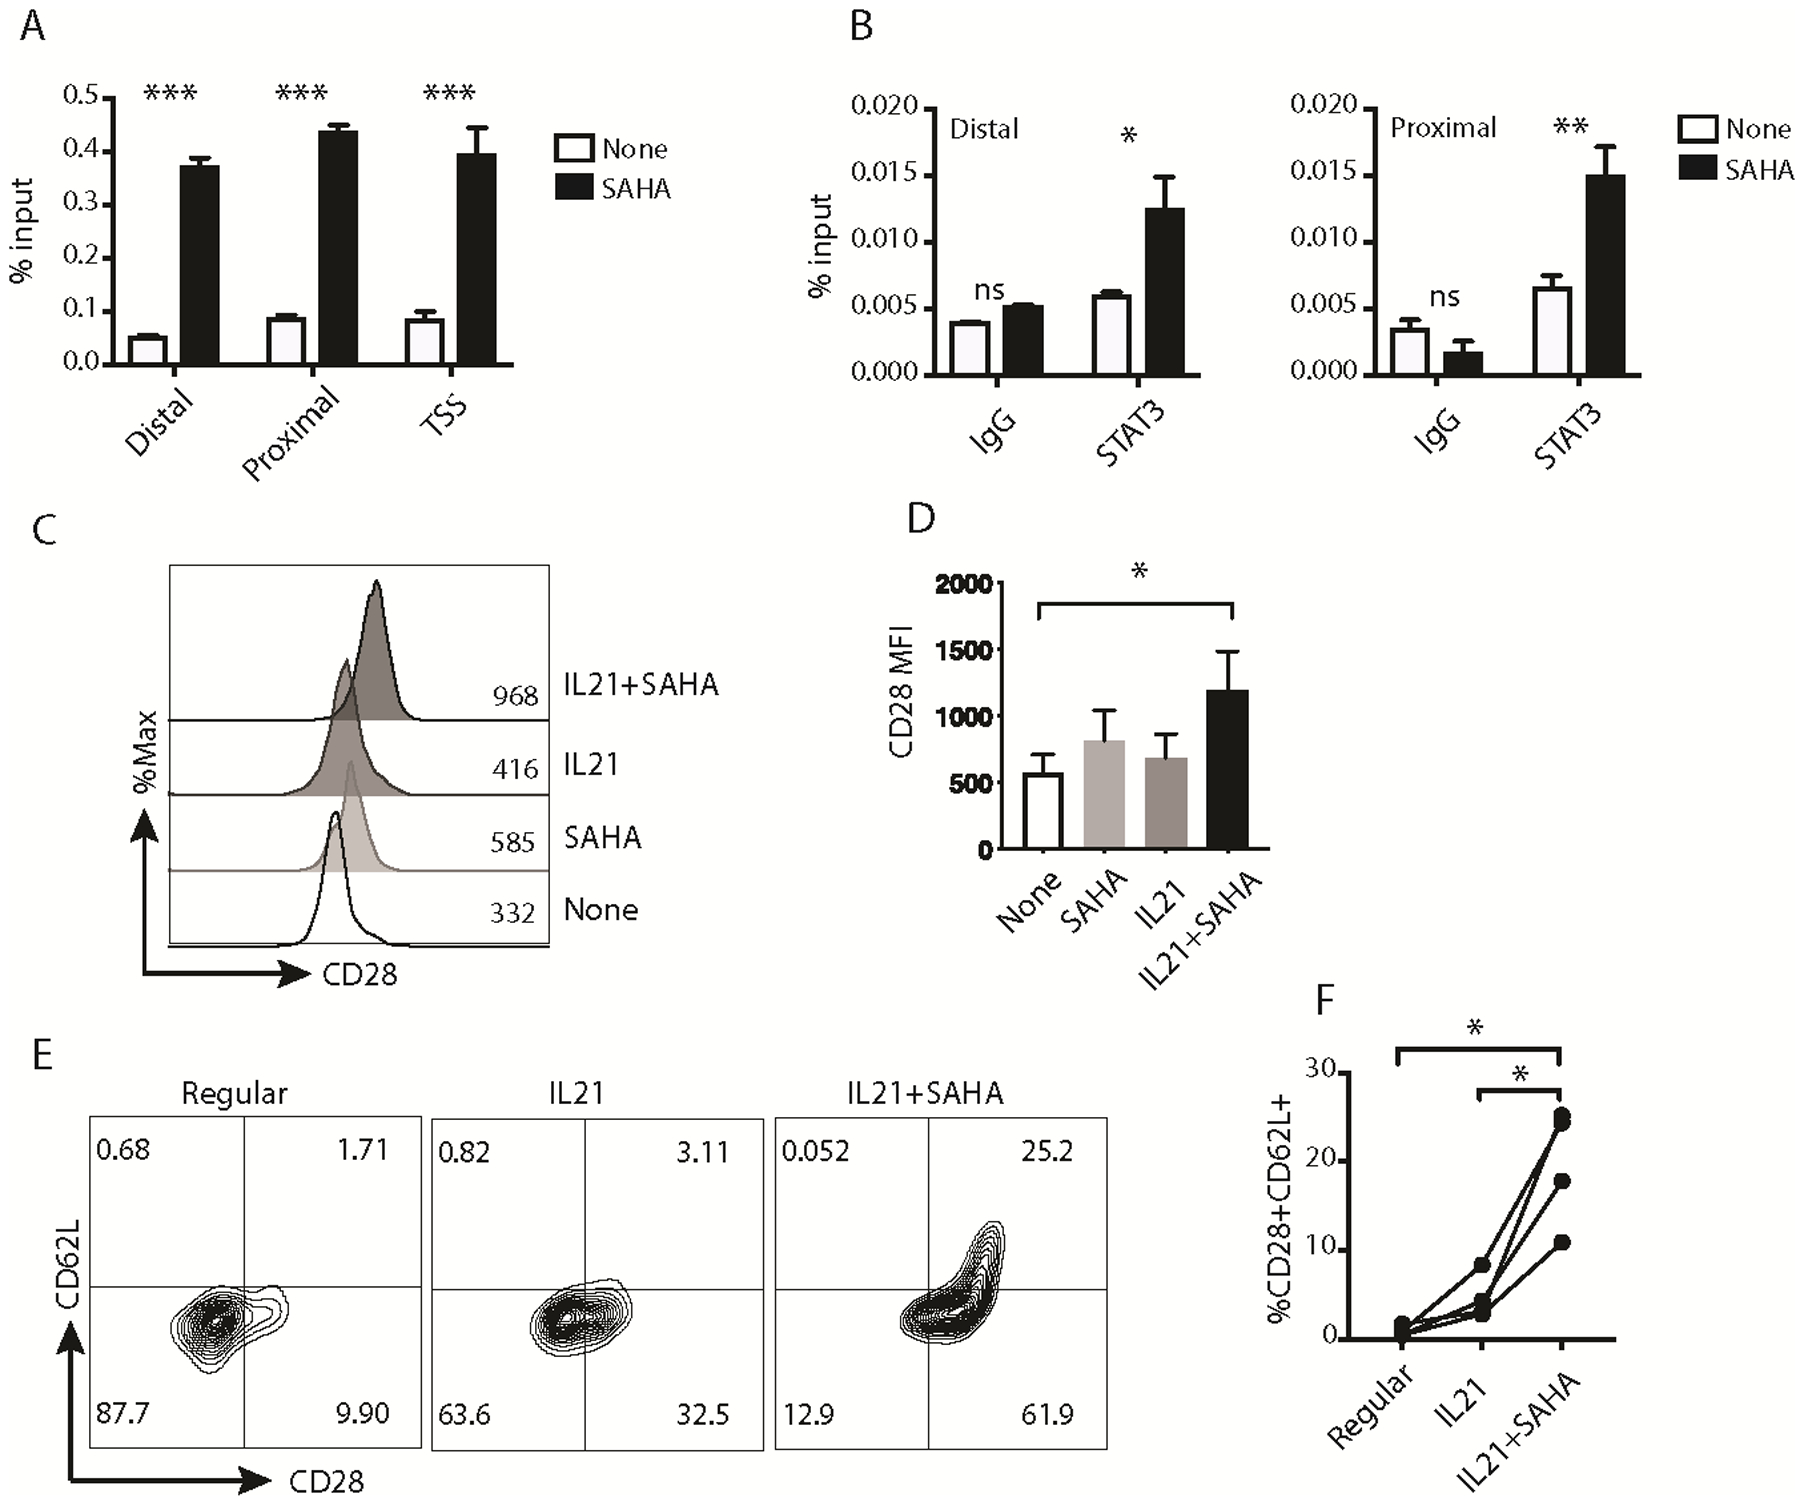
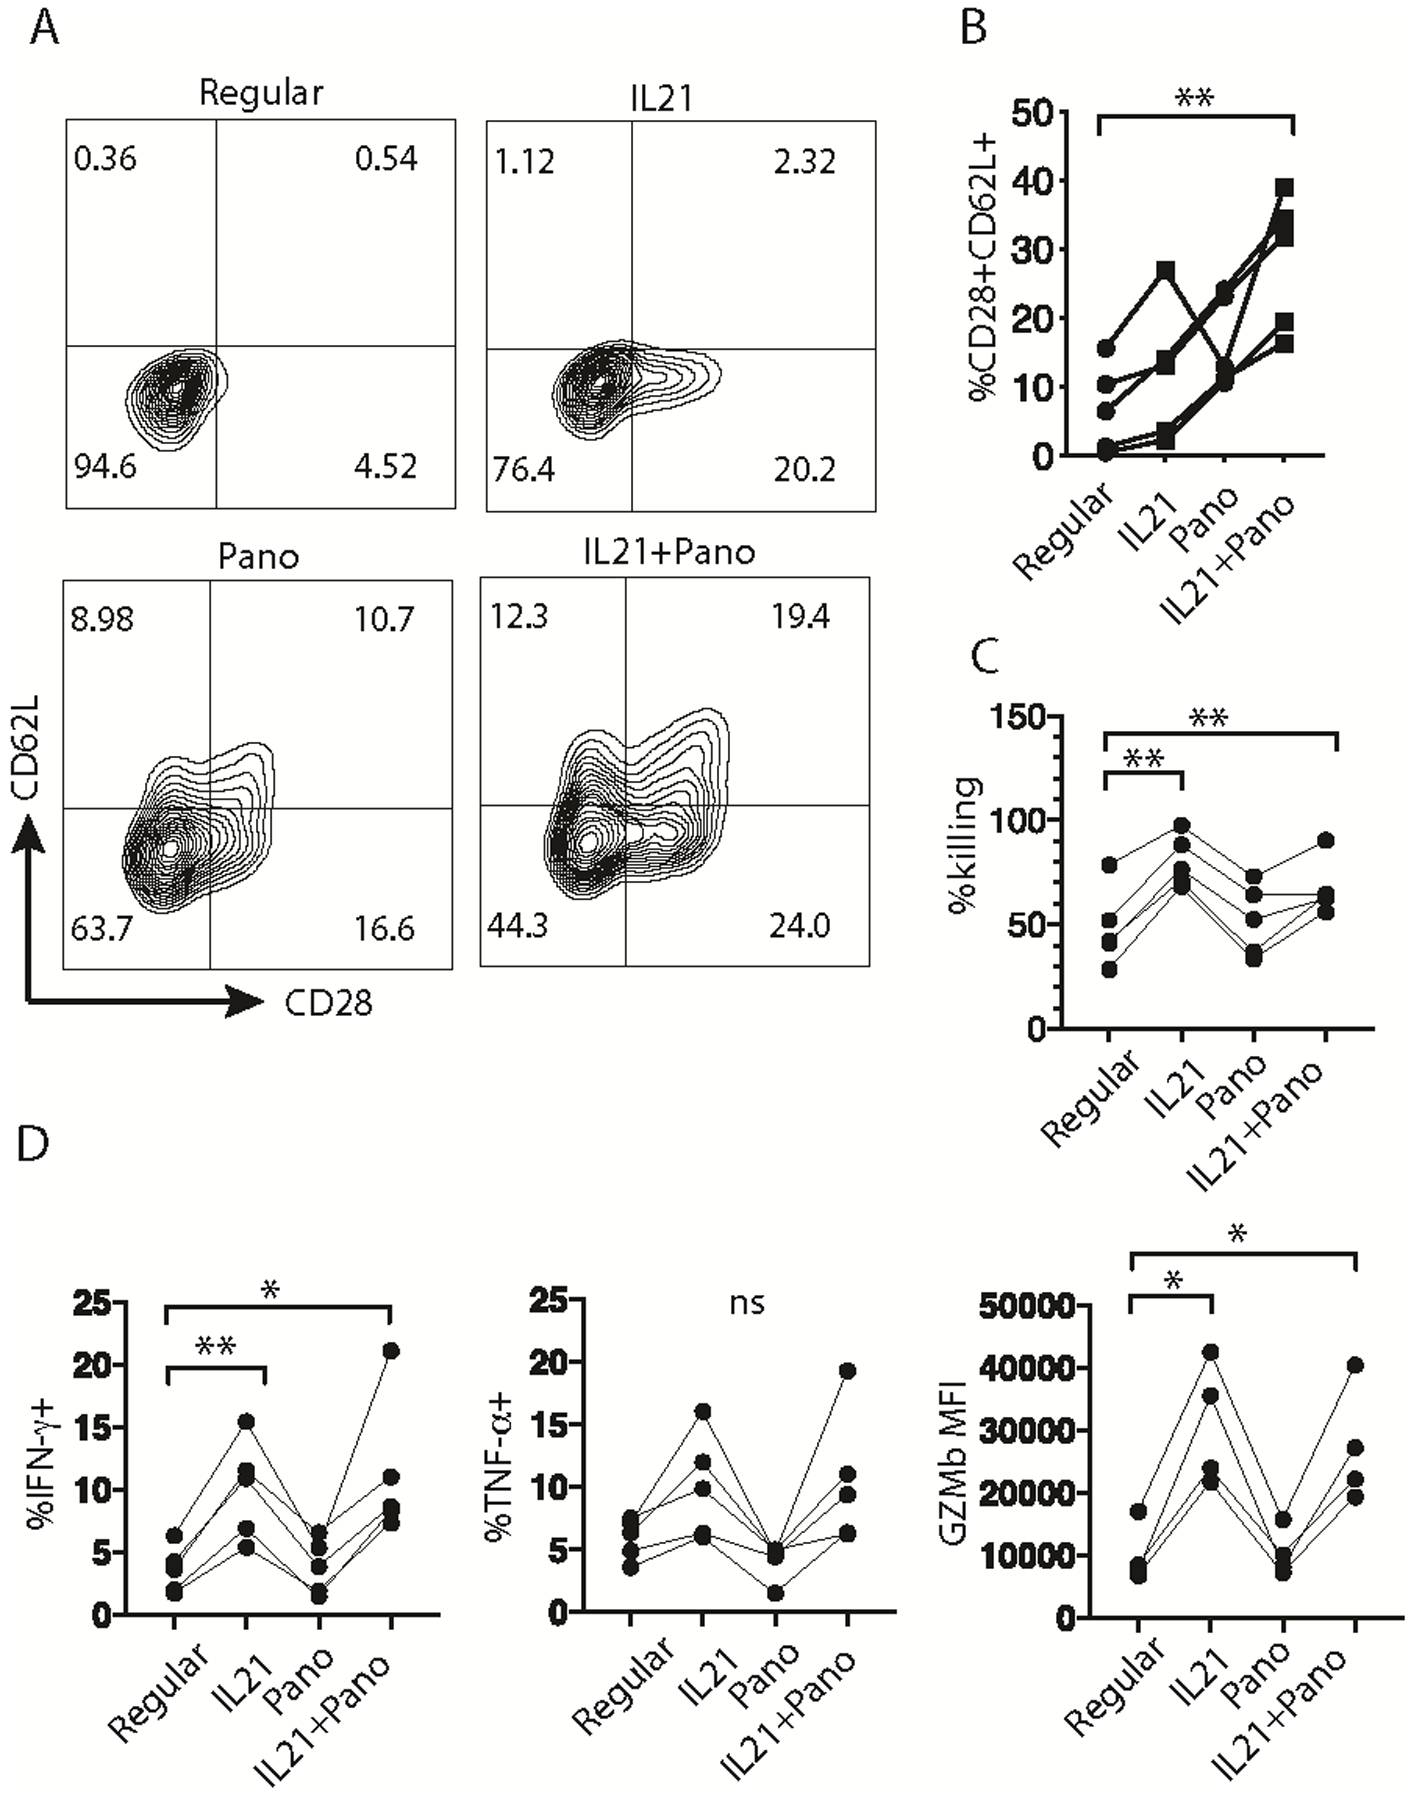
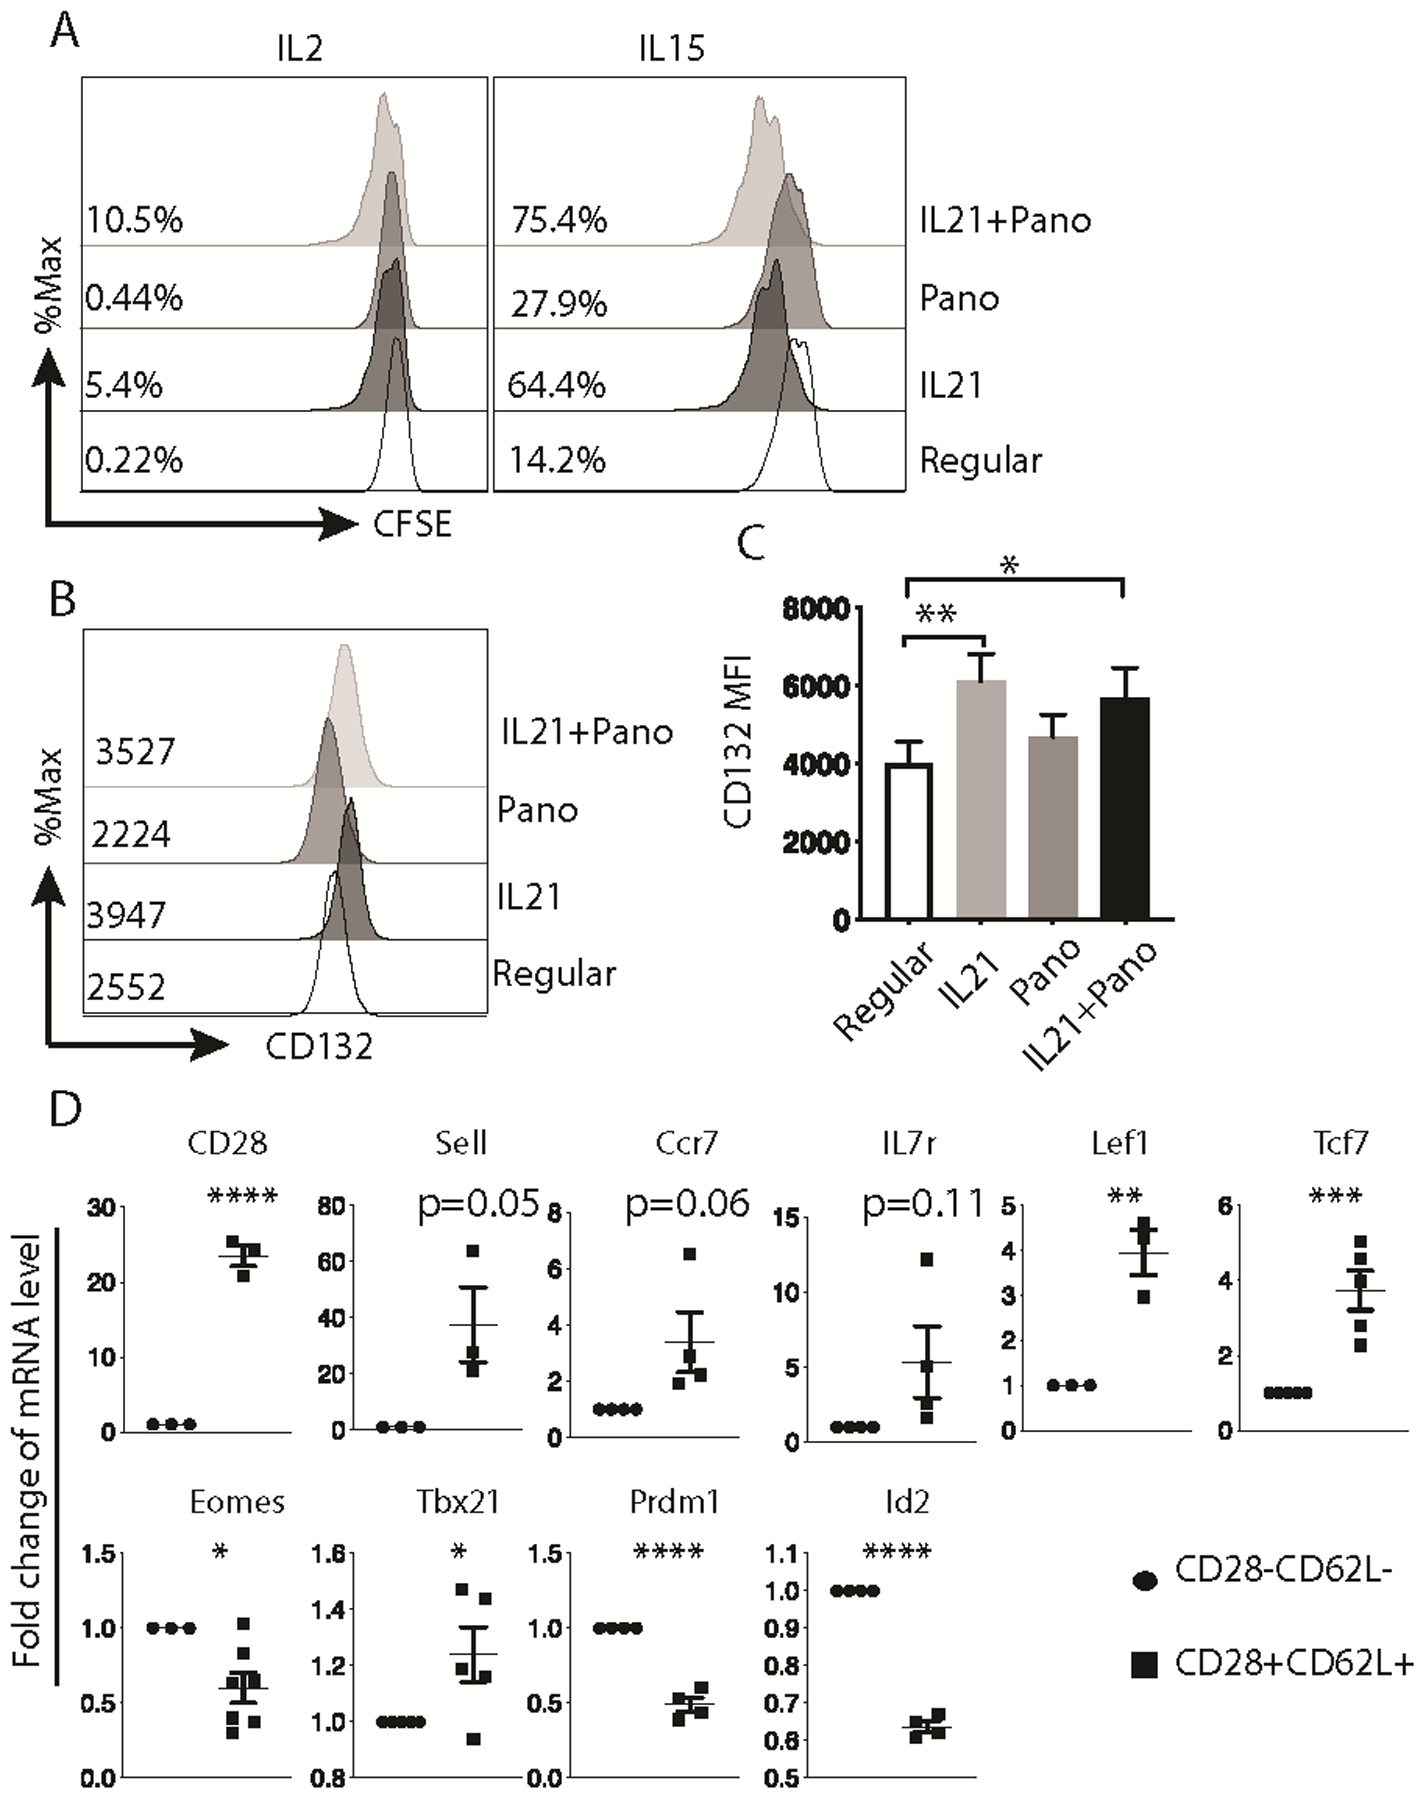
Clinical response rates after adoptive cell therapy (ACT) are highly correlated with in vivo persistence of the infused T cells. However, antigen-specific T cells found in tumor sites are often well-differentiated effector cells with limited persistence. Central memory CD8+ T cells, capable of self-renewal, represent desirable ACT products. We report here that exposure to a histone deacetylase inhibitor (HDACi) and IL21 could reprogram differentiated human CD8+ T cells into central memory-like T cells. Dedifferentiation of CD8+ T cells was initiated by increased H3 acetylation and chromatin accessibility at the CD28 promoter region. This led to IL21-mediated pSTAT3 binding to the CD28 region, and subsequent upregulation of surface CD28 and CD62L (markers of central memory T cells). The reprogrammed cells exhibited enhanced proliferation in response to both IL2 and IL15, and a stable memory-associated transcriptional signature (increased Lef1 and Tcf7). Our findings support the application of IL21 and HDACi for the in vitro generation of highly persistent T-cell populations that can augment the efficacy of adoptively transferred T cells.


Conflict of interest statement

Conflict of interest: C.Y. is a consultant/advisory board member for Adaptive Biotechnologies and Immatics. A patent application based on this manuscript has been filed (J.W. and C.Y.). No potential conflicts of interest were disclosed by the other authors.

Figures

Fig. 1.
Fig. 1.. IL21 upregulated CD28 expression in activated human naïve CD8+ T cells.
(A) Representative histogram of CD28 surface level on M27-specific CD8+ T cells and the isotype control antibody was used as a negative staining control. (B) MFI of CD28 protein expression on the surface of M27-specific CD8+ T cells. (n=3, * p < 0.05, paired t test). MFI: mean fluorescence intensity. (C) Representative histogram of CD28 surface expression on human naïve CD8+ T cells stained on day 7 after activation. The isotype control antibody was used as a negative staining control. (D) MFI of CD28 protein expression on the surface of CD8+ T cells activated with the indicated conditions for 7 days. (n=4, * p < 0.05, paired t test). (E) The quantitative RT-PCR results of CD28 mRNA in sort-purified M27-specific CD8+ T cells generated with or without IL21. The expression in cells expanded without IL21 was set as 1. (n=3, mean ± SEM, ** p < 0.01, unpaired t test). (F) The quantitative RT-PCR results of CD28 mRNA in human CD8+ T cells activated with the indicated conditions for 7 days. The expression in cells activated with anti-CD3/CD28 beads for 7 days was set as 1. (n=6, mean ± SEM, ** p < 0.01, unpaired t test). Results of quantitative RT-PCR for CD28 gene were normalized to RPL13A. The results in A and C were representative out of 3 (A) or 4 (C) independent experiments using cells from different healthy donors. The results in B, D, E and F were pooled from 3 (B, E), 4 (D) or 6 (F) independent experiments using cells from different healthy donors.
Fig. 2.
Fig. 2.. STAT3 activation was essential for IL21-induced CD28 upregulation.
(A) Representative histograms of CD28 surface expression on activated human CD8+ T cells from healthy donors or Job’s syndrome patients. HD: healthy donor. (B) Fold change of CD28 MFI, which is presented as fold of MFI of cells activated with anti-CD3/CD28 and IL21 over MFI of cells activated with only anti-CD3/CD28. (n=3, mean ± SEM, * p < 0.05, unpaired t test). (C) Fold change of quantitative RT-PCR results of CD28 mRNA in human CD8+ T cells from healthy donors or Job’s syndrome patients activated with anti-CD3/CD28 or together with IL21 for 7 days. The expression in cells from healthy donor or Job’s syndrome patient activated with anti-CD3/28 beads alone for 7 days was set as 1. (n=3, mean ± SEM, ** p < 0.01, unpaired t test). (D) Representative histograms of CD28 surface expression on human CD8+ T cells transfected with control, STAT1 or STAT3 shRNAs and activated with the indicated conditions for 7 days. (E) Fold change of CD28 MFI on the surface of negative control (Control) or STAT-knockdown CD8+ T cells activated with the indicated conditions for 7 days. Data is presented as fold of MFI of cells activated with anti-CD3/CD28 and IL21 over MFI of cells activated with only anti-CD3/CD28. (n=6, mean ± SEM, * p < 0.05, one-way ANOVA). (F) Fold change of quantitative PCR results of CD28 mRNA in human CD8+ T cells transfected with control, STAT1 or STAT3 shRNAs and activated with anti-CD3/CD28 or together with IL21 for 7 days. The expression in cells activated with CD3/28 beads alone for 7 days was set as 1. (n=4, mean ± SEM, * p < 0.05, one-way ANOVA). (G) Representative ChIP results of STAT3 binding to the proximal and distal STAT sites on the human CD28 promoter. The results were normalized to the percentage of the input amount. (n=3, mean ± SEM, **** p < 0.0001, two-way ANOVA). The results were representative (A, D, G) or pooled from 3 (B, C), 4 (F), or 6 (E) independent experiments using cells from different donors.
Fig. 3.
Fig. 3.. IL21-induced CD28 correlated with histone H3 acetylation of CD8+ T cells.
(A-B) Representative histogram and summary of CD28 expression on M27-specific effector CD8+ T cells activated with M27-pulsed mature dendritic cells in the presence or absence of IL21 for 4 days. Isotype antibody was used as a negative staining control. [n=3; ns: not significant; paired t test]. (C) Representative western blot results of IL21-induced pSTAT3 in naïve and M27-specific effector CTLs. STAT3 and β-actin were used as loading controls. The bands were quantified using ImageJ and normalized to the density of actin in the corresponding samples. Molecular weight is indicated in kilodaltons. UT: untreated. (D) Representative ChIP results of H3 acetylation on the CD28 promoter comparing Naïve to CD45RA+EM (TEMRA) CD8+ T cells. The results were normalized to the percentage of the input amount. TSS: transcription start site. [n=3; mean ± SEM; * p<0.05, *** p<0.001; two-way ANOVA]. (E) Representative histogram of CD28 expression on naïve and TEMRA CD8+ T cells activated with anti-CD3/CD28 or together with IL21 for 4 days. (F) Representative ChIP results of H3 acetylation on the CD28 promoter comparing Naïve to M27-specific effector CD8+ T cells. The results were normalized to the percentage of the input amount. [n=3; mean ± SEM; ** p<0.01, *** p<0.001; two-way ANOVA]. The results were representative out of two (C, E, F) or three (A, D), or pooled from 3 (B) independent experiments using cells from different donors.
Fig. 4.
Fig. 4.. SAHA allowed IL21 to upregulate CD28 expression in effector CD8+ T cells.
(A) Representative ChIP results of H3 acetylation on the CD28 promoter for M27-specific effector CD8+ T cells left untreated (None) or treated with SAHA for 24 hours. [n=3; mean ± SEM; *** p<0.001; two-way ANOVA]. (B) Representative ChIP results of STAT3 binding to the CD28 promoter for M27-specific effector CD8+ T cells left untreated or treated with SAHA for 24 hours, followed by IL21 stimulation for 30 minutes. [n=3; mean ± SEM; ns: not significant, * p<0.05, ** p<0.01; two-way ANOVA]. (C) Representative histogram of CD28 expression on activated CTLs treated with the indicated conditions for 4 days. The numbers inside the histogram graph show the representative CD28 MFI for each condition. (D) MFI of CD28 on CTLs from independent experiments (n=6; mean ± SEM; * p<0.05; one-way ANOVA, comparing IL21+SAHA to the other conditions). (E) Representative plots of CD28 and CD62L expression on TILs expanded with the indicated conditions for 2 weeks. The numbers within the plots annotate the percentage of cells in each quadrant. (F) Percentage of CD28+CD62L+ cells in TILs expanded with the indicated conditions from independent experiments (n=4; * p<0.05; one-way ANOVA). The representative results out of two (B), three (A), four (E), or six (C) independent experiments are shown.
Fig. 5.
Fig. 5.. IL21 and Panobinostat (Pano) cooperated to induce CD28+CD62L+ cells.
(A) Representative plots of CD28 and CD62L expression on CTLs expanded with the indicated conditions for 2 weeks. The numbers within the plots annotate the percentage of cells in each quadrant. (B) Percentage of CD28+CD62L+ cells in CTLs expanded with the indicated conditions from independent experiments (n=5; ** p<0.01; one-way ANOVA, as compared to CTLs expanded with the regular protocol). (C) Percentage of target tumor cell killing by CTLs expanded with the indicated condition from independent experiments (n=5; ** p<0.01; one-way ANOVA). (D) Percentage of IFN-γ+ or TNF-α+ cells and GZMb MFI of CTLs expanded with the indicated condition from independent experiments GZMb: granzyme B. (n=5, * p<0.05, ** p<0.01; ns: not significant, one-way ANOVA). The representative results out of five (A) independent experiments are shown.
Fig. 6.
Fig. 6.. IL21/Panobinostat-expanded CTLs display central memory-like characteristics in vitro.
(A) Proliferation of expanded CTLs when treated with either IL2 or IL15 indicated by CFSE dilution. The numbers indicate the percentage of cells divided 2 times or more in 5 days. (B) Representative histogram of CD132 (γC) expression on CTLs expanded with the indicated conditions. The numbers show the representative MFI of CD132 in each condition. (C) Summary of CD132 MFI on CTLs expanded with the indicated conditions from independent experiments (n=6; mean ± SEM; * p<0.05, ** p<0.01; one-way ANOVA, as compared to CTLs expanded with the regular protocol). (D) The results of mRNA gene expression in CD28CD62L and CD28+CD62L+ cells sorted from CTLs expanded with IL21 and Panobinostat. Gene expression was normalized to housekeeping gene RPL13A expression. The expression in CD28CD62L cells was set as 1. (n=3–7; mean ± SEM; * p<0.05, ** p<0.01, *** p<0.001, **** p<0.0001, two-tailed t test). The representative results out of two (A) or six (B) independent experiments are shown. The results in C and D were pooled from more than 3 independent experiments.

References

    1. Yee C The use of endogenous T cells for adoptive transfer. Immunological reviews 2014;257(1):250–63 doi 10.1111/imr.12134. - DOI - PubMed
    1. Rosenberg SA, Restifo NP, Yang JC, Morgan RA, Dudley ME. Adoptive cell transfer: a clinical path to effective cancer immunotherapy. Nature reviews Cancer 2008;8(4):299–308 doi 10.1038/nrc2355. - DOI - PMC - PubMed
    1. Robbins PF, Dudley ME, Wunderlich J, El-Gamil M, Li YF, Zhou J, et al. Cutting edge: persistence of transferred lymphocyte clonotypes correlates with cancer regression in patients receiving cell transfer therapy. Journal of immunology 2004;173(12):7125–30. - PMC - PubMed
    1. Zhou J, Shen X, Huang J, Hodes RJ, Rosenberg SA, Robbins PF. Telomere length of transferred lymphocytes correlates with in vivo persistence and tumor regression in melanoma patients receiving cell transfer therapy. Journal of immunology 2005;175(10):7046–52. - PMC - PubMed
    1. Chapuis AG, Desmarais C, Emerson R, Schmitt TM, Shibuya K, Lai I, et al. Tracking the Fate and Origin of Clinically Relevant Adoptively Transferred CD8(+) T Cells In Vivo. Science immunology 2017;2(8) doi 10.1126/sciimmunol.aal2568. - DOI - PMC - PubMed

Publication types

MeSH terms