. 2020 Mar 25;12(536):eaaw3210.
doi: 10.1126/scitranslmed.aaw3210.

An ocular glymphatic clearance system removes β-amyloid from the rodent eye

Affiliations

An ocular glymphatic clearance system removes β-amyloid from the rodent eye

Xiaowei Wang et al. Sci Transl Med. .

Abstract

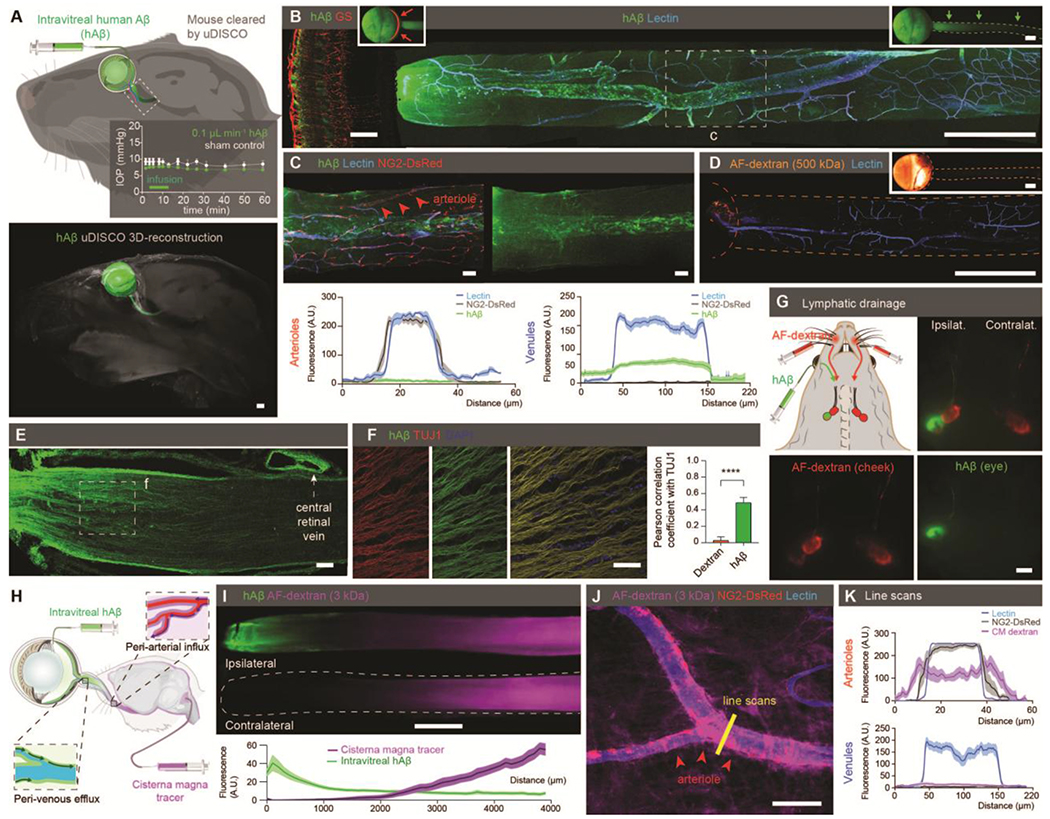
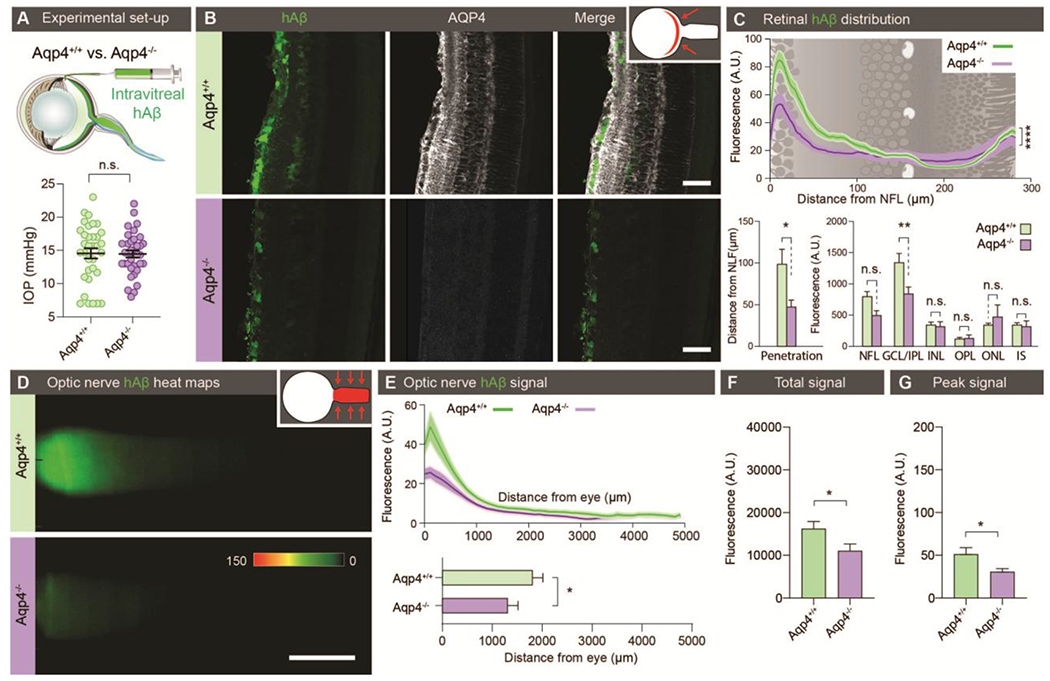
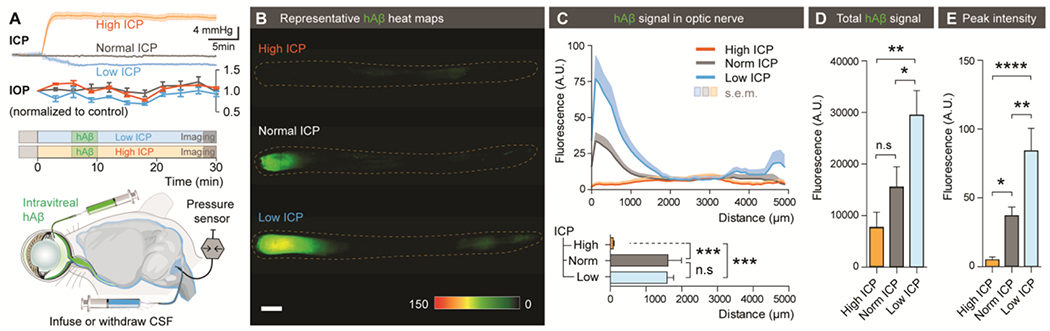
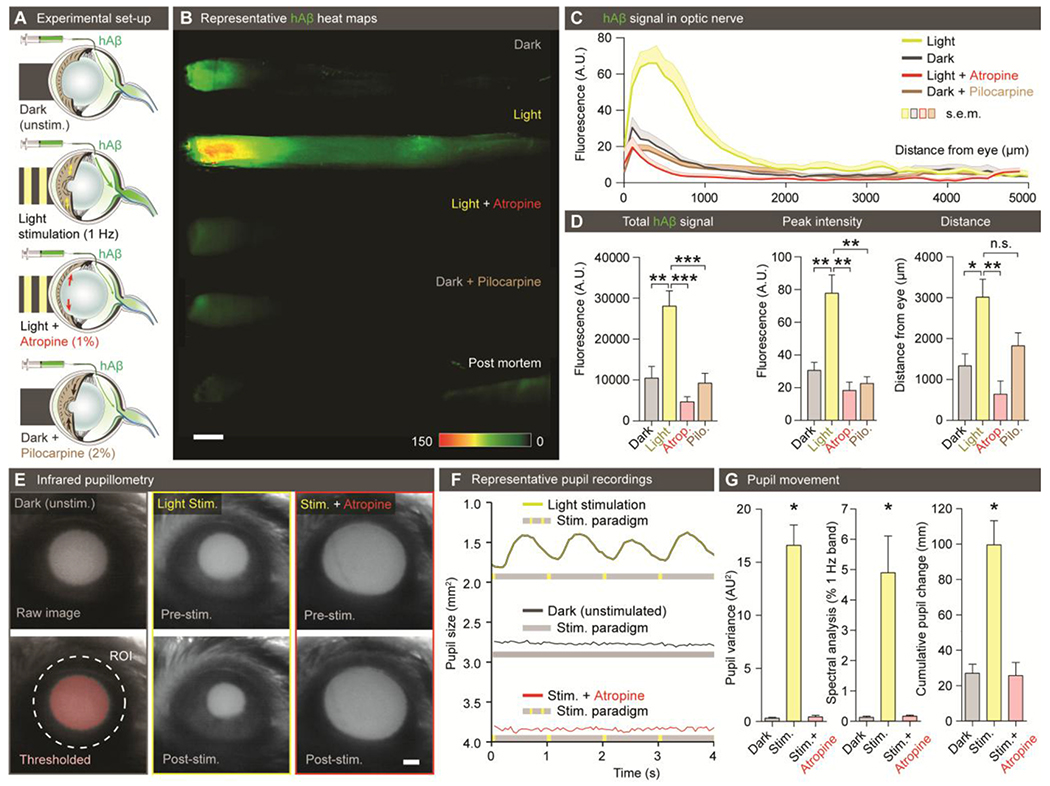
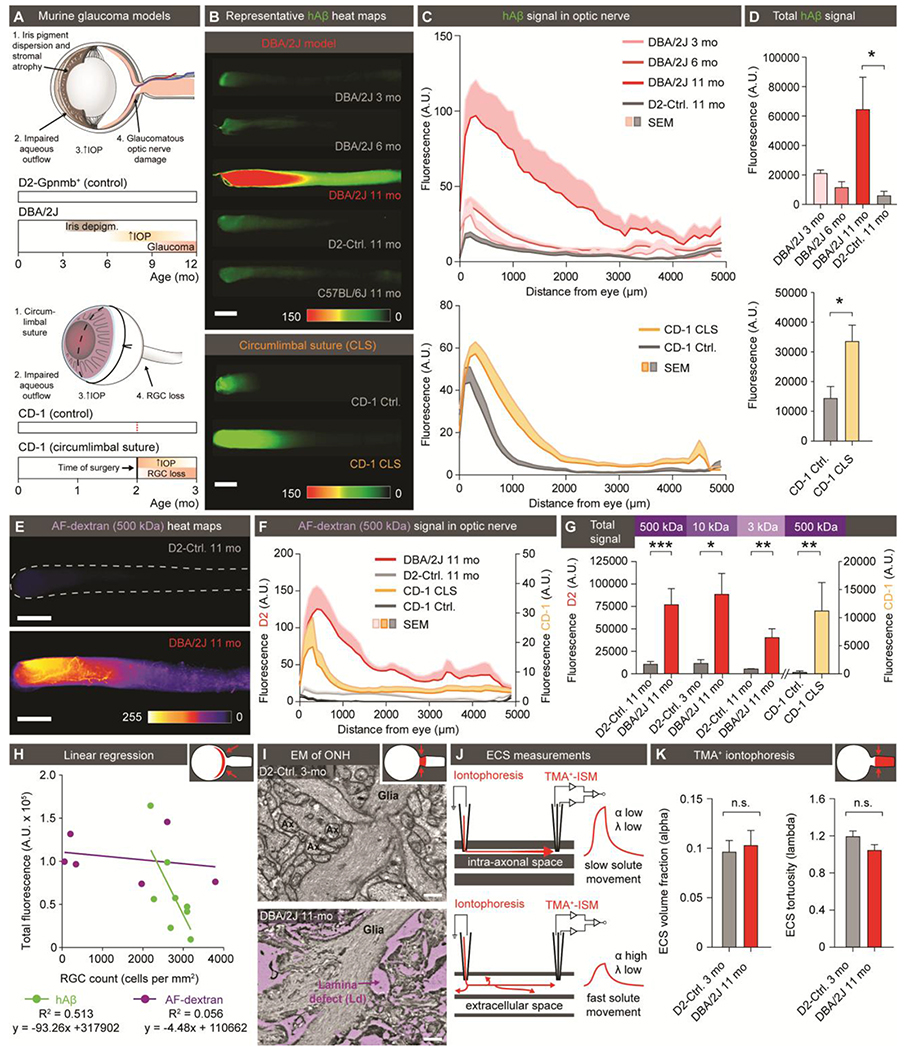
Despite high metabolic activity, the retina and optic nerve head lack traditional lymphatic drainage. We here identified an ocular glymphatic clearance route for fluid and wastes via the proximal optic nerve in rodents. β-amyloid (Aβ) was cleared from the retina and vitreous via a pathway dependent on glial water channel aquaporin-4 (AQP4) and driven by the ocular-cranial pressure difference. After traversing the lamina barrier, intra-axonal Aβ was cleared via the perivenous space and subsequently drained to lymphatic vessels. Light-induced pupil constriction enhanced efflux, whereas atropine or raising intracranial pressure blocked efflux. In two distinct murine models of glaucoma, Aβ leaked from the eye via defects in the lamina barrier instead of directional axonal efflux. The results suggest that, in rodents, the removal of fluid and metabolites from the intraocular space occurs through a glymphatic pathway that might be impaired in glaucoma.


Conflict of interest statement

Competing interests: The authors declare no competing interests.

Figures

Figure 1.
Figure 1.. Existence of an ocular glymphatic clearance system.
(A) Top: Schematic of intravitreal injection of hAβ. Insert: IOP during injection (n = 5-6, P = 0.0516-0.543, unpaired two-tailed t-test). Rectangle indicates proximal optic nerve displayed in B-J. Bottom: uDISCO-cleared transparent mouse heads 1 hour after hAβ injection. (B) Confocal images of ipsilateral retina (left) and optic nerve (right) after hAβ intravitreal injection. B and D inserts display macroscopic images of the eye and optic nerve injected with respective tracers without background subtraction. (C) Confocal imaging and quantification of optic nerve from reporter mouse with DsRed-tagged mural cells (vascular smooth muscle cells and pericytes) 30min after intravitreal hAβ injection (mean ± SEM, n = 12-18). (D) Confocal image of mouse optic nerve 30min after intravitreal AF-dextran injection. (E-F) Confocal imaging and quantification of optic nerve co-labeling with TUJ1 after tracer administration (n = 9-11 ****P < 0.0001 unpaired, two-tailed t-test). Note tracer accumulation in the dural lining of the nerve. (G) Cervical lymph nodes exhibiting intense hAβ labeling three hours after injection. (H) Schematic of the double injections. (I) Representative image and quantification of double injections of hAβ intravitreally and fluorescent tracer intercisternally (mean ± SEM, n = 12). (J) Confocal imaging of optic nerve from reporter mouse with DsRed-tagged mural cells (vascular smooth muscle cells and pericytes) after intracisternal dextran injection with line scan quantified in (K) (mean ± SEM, n = 8-9). (Scales: A, B right, D, G, I: 500 μm; B left, C, E, F, J: 50 μm). A.U., arbitrary units.
Figure 2.
Figure 2.. Ocular glymphatic clearance is AQP4-dependent.
(A) Top: Experimental setup comparing tracer clearance from the retina and optic nerve after intravitreal injection in Aqp4+/+ and Aqp4−/− mice. Bottom: Scatter plot with mean ± SEM overlaid, comparing intraocular pressure (IOP) in Aqp4+/+ and Aqp4−/− mice before the injection. (B) Representative transverse sections of retina collected 30 min after intravitreal hAβ injection and counter-stained for AQP4. (C) Line graph overlaid on retinal illustration (top) and bar graphs (bottom) comparing hAβ tracer penetration (n = 7-9, *P < 0.05, Mann-Whitney test) into the various retinal layers (n = 7-9, ** P < 0.01, ****P < 0.0001, two-way ANOVA followed by Sidak’s multiple comparisons test).n.s. not significant. (D) Representative background-subtracted heat-maps of hAβ signal in the optic nerves of Aqp4+/+ and Aqp4−/− mice 30 min after intravitreal injection. (E) Top: Averaged fluorescent intensity profiles of hAβ in the optic nerves from the two groups. Bottom: The distance of tracer transport (n = 23-24 *P < 0.05 Mann-Whitney test). (F-G) Total hAβ signal and peak intensity in the optic nerve 30 min after intravitreal injection (n = 23-24, *P < 0.05, unpaired two-tailed t-test for total signal, Mann-Whitney test for peak). (Scales: B: 50 μm, D: 100 μm).
Figure 3.
Figure 3.. The translaminar pressure difference drives ocular glymphatic outflow.
(A) Schematic of the setup used for analyzing hAβ transport following intravitreal injection while manipulating ICP. Top: Mean ICP and IOP normalized to control (± SEM) plotted as a function of time in the high, normal, and low ICP groups (n = 10-12). (B) Representative background-subtracted heat-maps of hAβ in the optic nerve from high, normal, and low ICP groups. (C) Top: Averaged fluorescent intensity profiles of hAβ in the optic nerves from the three groups. Bottom: The distance of tracer transport (n = 6-8, ***P < 0.001, n.s. P = 0.9976 one-way ANOVA followed by Tukey’s post hoc test). (D-E) Total hAβ signal and peak intensities in the optic nerve 30 min after intravitreal injection (n = 6-8 for each group, *P < 0.05, **P < 0.01, ****P < 0.0001, n.s. P = 0.2996 one-way ANOVA followed by Tukey’s post hoc test). (Scale: B: 500μm).
Figure 4.
Figure 4.. Light stimulation enhances hAβ along the optic nerve.
(A) Schematic of the experimental groups. The first group was kept in darkness. The second group was exposed to 1 Hz light-stimulation (100 ms duration, five lumens). The third group was pretreated with atropine (1%) before exposure to 1 Hz light-stimulation. The fourth group was pretreated with pilocarpine (2%) and kept in darkness. (B) Representative background-subtracted heat-maps of optic nerves from the four groups 30 min after injection of hAβ and a postmortem group 120 min after injection of hAβ. (C) Averaged fluorescent intensity profiles of optic nerves from the four groups (n = 6-19). (D) hAβ signal mapped as total signal, peak intensity, and distance of the hAβ transport (n = 6-19, *P < 0.05, **P < 0.01, ***P < 0.001, n.s. P = 0.0756, one-way ANOVA followed by Dunnett’s post hoc test). (E) Infrared pupillometry tracking of the pupil size and light-induced constriction with and without atropine pre-treatment. The pupil area (mm2) was determined by auto-thresholding. (F) Representative pupillometry recordings in dark-exposed and light-stimulated mice with and without atropine administration. (G) Left: Comparison of the variance of pupil area in these groups (n = 3, **P < 0.01, one-way ANOVA followed by Dunnett’s multiple comparison). Middle: Spectral analysis of pupil response in these groups calculated as % of 1Hz band (n = 3-6, *P < 0.05, One-way ANOVA followed by Dunnett’s multiple comparison). Right: Cumulative pupil diameter change over the time of experiment in these groups (n = 3-6, *P < 0.05, Kruskal-Wallis test followed by Dunnett’s multiple comparison). (Scale: B, E: 500μm).
Figure 5.
Figure 5.. Disruption of the lamina barrier in two distinct murine models of glaucoma reveals a redirection and pathological enhancement of ocular glymphatic outflow.
(A) Schematic of disease progression in the DBA/2J strain and chronic CLS model (CD-1) (44, 46). (B) Representative background-subtracted heat-maps of optic nerves 30 min after hAβ injection in young, middle-aged, and old DBA/2J mice and old D2-control mice, as well as CD-1-CLS and CD-1-control mice. (C) Averaged fluorescent intensity profile of hAβ distribution along the optic nerve in old DBA/2J or CD-1-CLS compared to respective controls (n = 6-11). (D) Total hAβ signal in old DBA/2J or CD-1-CLS compared to respective controls (n = 6-11, *P < 0.05, Kruskal-Wallis followed by Dunn’s post hoc test for DBA/2J model, unpaired two-tailed t-test for CLS model). (E) Representative background-subtracted heat-maps of optic nerves from old DBA/2J and D2-control mice 30 min after intravitreal administration of AF-dextran. (F) Averaged fluorescent intensity profile of AF-dextran along the optic nerve in old DBA/2J or CD-1-CLS compared to respective controls (n = 6-9). (G) Total signal of different sized AF-dextrans in optic nerve from old DBA/2J or CD-1-CLS compared to respective controls (n = 4-10, *P < 0.05, **P < 0.01, ***P < 0.001, unpaired two-tailed t-test or Mann-Whitney test). (H) Total hAβ or AF-dextran signal in the optic nerves of old DBA/2J mice plotted as a function of RGC density in their retinas (n = 6-8). (I) Electron micrographs of the glial lamina region from young D2-control and old DBA/2J mice. (J) Schematic of real-time TMA+ iontophoresis measurement. (K) TMA+ measurements of α (extracellular volume space) and λ (extracellular tortuosity) (n = 6-20, P = 0.765 for α, 0.177 for λ, unpaired two-tailed t-test). (Scale: B, E: 500μm; I: 0.5μm).

References

    1. Aukland K, Reed RK, Interstitial-lymphatic mechanisms in the control of extracellular fluid volume. Physiological reviews 73, 1–78 (1993). - PubMed
    1. Yucel YH, Johnston MG, Ly T, Patel M, Drake B, Gumus E, Fraenkl SA, Moore S, Tobbia D, Armstrong D, Horvath E, Gupta N, Identification of lymphatics in the ciliary body of the human eye: a novel “uveolymphatic” outflow pathway. Experimental eye research 89, 810–819 (2009). - PubMed
    1. Iliff JJ, Wang M, Liao Y, Plogg BA, Peng W, Gundersen GA, Benveniste H, Vates GE, Deane R, Goldman SA, Nagelhus EA, Nedergaard M, A paravascular pathway facilitates CSF flow through the brain parenchyma and the clearance of interstitial solutes, including amyloid beta. Science translational medicine 4, 147ra111 (2012). - PMC - PubMed
    1. Louveau A, Smirnov I, Keyes TJ, Eccles JD, Rouhani SJ, Peske JD, Derecki NC, Castle D, Mandell JW, Lee KS, Harris TH, Kipnis J, Structural and functional features of central nervous system lymphatic vessels. Nature 523, 337–341 (2015). - PMC - PubMed
    1. Aspelund A, Antila S, Proulx ST, Karlsen TV, Karaman S, Detmar M, Wiig H, Alitalo K, A dural lymphatic vascular system that drains brain interstitial fluid and macromolecules. The Journal of experimental medicine 212, 991–999 (2015). - PMC - PubMed

Publication types