. 2020 May 1;368(6490):493-497.
doi: 10.1126/science.abb4218. Epub 2020 Mar 25.

The effect of human mobility and control measures on the COVID-19 epidemic in China

Affiliations

The effect of human mobility and control measures on the COVID-19 epidemic in China

Moritz U G Kraemer et al. Science. .

Abstract

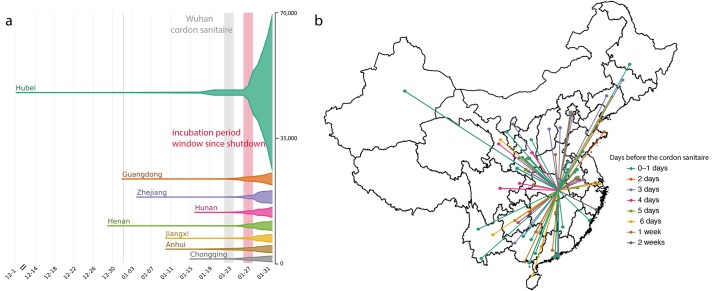
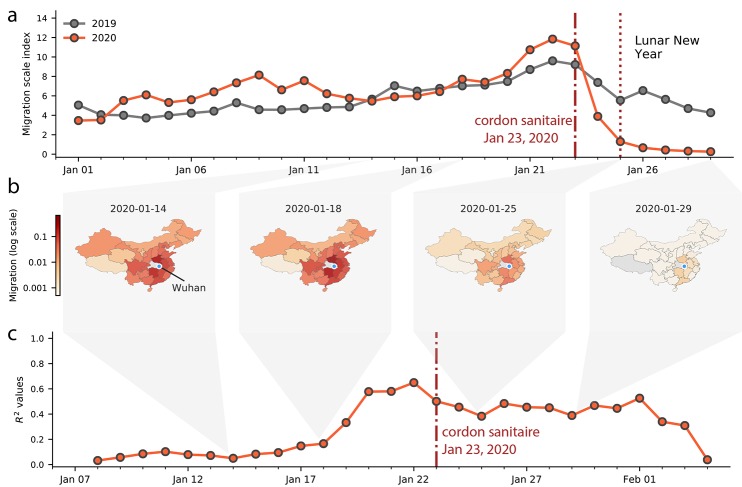
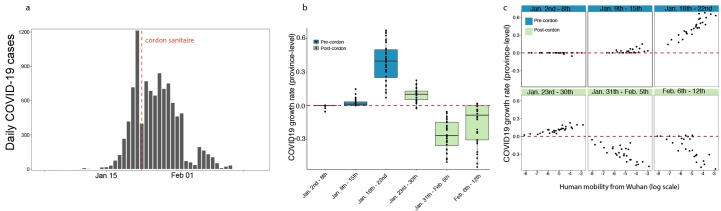
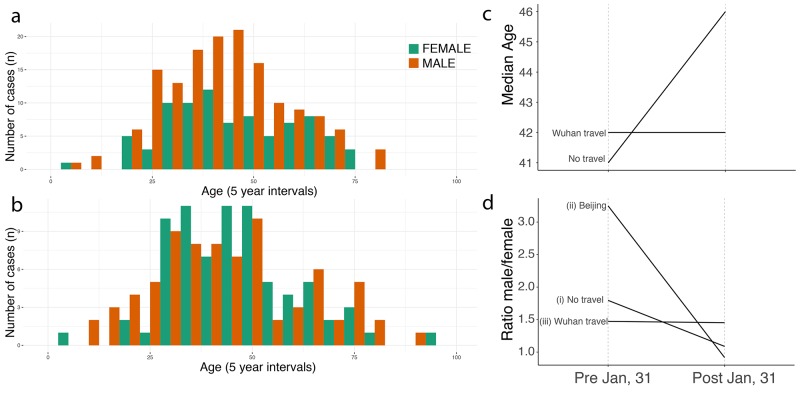
The ongoing coronavirus disease 2019 (COVID-19) outbreak expanded rapidly throughout China. Major behavioral, clinical, and state interventions were undertaken to mitigate the epidemic and prevent the persistence of the virus in human populations in China and worldwide. It remains unclear how these unprecedented interventions, including travel restrictions, affected COVID-19 spread in China. We used real-time mobility data from Wuhan and detailed case data including travel history to elucidate the role of case importation in transmission in cities across China and to ascertain the impact of control measures. Early on, the spatial distribution of COVID-19 cases in China was explained well by human mobility data. After the implementation of control measures, this correlation dropped and growth rates became negative in most locations, although shifts in the demographics of reported cases were still indicative of local chains of transmission outside of Wuhan. This study shows that the drastic control measures implemented in China substantially mitigated the spread of COVID-19.


Figures

Fig. 1
Fig. 1. Number of cases and key dates during the epidemic.
(a) The epidemic curve of the COVID-19 outbreak in provinces in China. Vertical lines and boxes indicate key dates such as implementation of the cordon sanitaire of Wuhan (grey) and the end of the first incubation period after the travel restrictions (red). The thin grey line represents the closure of Wuhan seafood market on 1st January 2020. The width of each horizontal tube represents the number of reported cases in that province. (b) Map of COVID-19 confirmed cases (n = 554) that had reported travel history from Wuhan before travel restrictions were implemented on January 23, 2020. Colors of the arrows indicate date of travel relative to the date of travel restrictions.
Fig. 2
Fig. 2. Human mobility, spread and synchrony of COVID-19 outbreak in China.
(a) Human mobility data extracted in real time from Baidu. Travel restrictions from Wuhan and large scale control measures started on January 23,2020. Dark and red lines represent fluxes of human movements for 2019 and 2020, respectively. (b) Relative movements from Wuhan to other provinces in China. (c) Timeline of the correlation between daily incidence in Wuhan and incidence in all other provinces, weighted by human mobility.
Fig. 3
Fig. 3. Human mobility explains early epidemic growth rate in China.
(a) Daily counts of cases in China. (b) Time series of province-level growth rates of the COVID-19 epidemic in China. Estimates of the growth rate were obtained by performing a time-series analysis using mixed-effect model of lagged, log linear daily case counts in each province (Materials and Methods). Above the red line are positive growth rates and below are growth rates are negative rates. Blue indicates dates before the implementation of the cordon sanitaire and green after. (c) Relationship between growth rate and human mobility at different times of the epidemic. Blue indicates before the implementation of the cordon sanitaire and green after.
Fig. 4
Fig. 4. Shifting age and sex distributions through time.
(a) Age and sex distributions of confirmed cases with known travel history to Wuhan. (b) Age and sex distributions of confirmed cases that had no travel history. (c) Median age for cases reported early (before 1st Feb) and those reported later (between 1st – 10th February. Full distributions are shown in fig. S7. (d) Change through time in the sex ratio of (i) all reported cases in China with no reported travel history, (ii) cases reported in Beijing without travel history, and (iii) cases known to have travelled from Wuhan.

Update of

References

    1. Chen S., Yang J., Yang W., Wang C., Bärnighausen T., COVID-19 control in China during mass population movements at New Year. Lancet 395, 764–766 (2020). 10.1016/S0140-6736(20)30421-9 - DOI - PMC - PubMed
    1. Zhu N., Zhang D., Wang W., Li X., Yang B., Song J., Zhao X., Huang B., Shi W., Lu R., Niu P., Zhan F., Ma X., Wang D., Xu W., Wu G., Gao G. F., Tan W.; China Novel Coronavirus Investigating and Research Team , A novel coronavirus from patients with pneumonia in China, 2019. N. Engl. J. Med. 382, 727–733 (2020). 10.1056/NEJMoa2001017 - DOI - PMC - PubMed
    1. H. Tian, Y. Liu, Y. Li, C.-H. Wu, B. Chen, M. U. G. Kraemer, B. Li, J. Cai, B. Xu, Q. Yang, B. Wang, P. Yang, Y. Cui, Y. Song, P. Zheng, Q. Wang, O. N. Bjornstad, R. Yang, B. Grenfell, O. Pybus, C. Dye, The impact of transmission control measures during the first 50 days of the COVID-19 epidemic in China. medRxiv 2020.01.30.20019844 [Preprint]. 10 March 2020; .10.1101/2020.01.30.20019844 - DOI - DOI - PMC - PubMed
    1. Du Z., Wang L., Cauchemez S., Xu X., Wang X., Cowling B. J., Meyers L. A., Risk for transportation of 2019 novel coronavirus disease from Wuhan to other cities in China. Emerg. Infect. Dis. 26 (2020). 10.3201/eid2605.200146 - DOI - PMC - PubMed
    1. Wu J. T., Leung K., Leung G. M., Nowcasting and forecasting the potential domestic and international spread of the 2019-nCoV outbreak originating in Wuhan, China: A modelling study. Lancet 395, 689–697 (2020). 10.1016/S0140-6736(20)30260-9 - DOI - PMC - PubMed

Publication types