. 2020 Mar 26;12(6):5439-5468.
doi: 10.18632/aging.102969. Epub 2020 Mar 26.

Identification of hub genes in hepatocellular carcinoma using integrated bioinformatic analysis

Affiliations

Identification of hub genes in hepatocellular carcinoma using integrated bioinformatic analysis

Shengni Hua et al. Aging (Albany NY). .

Abstract

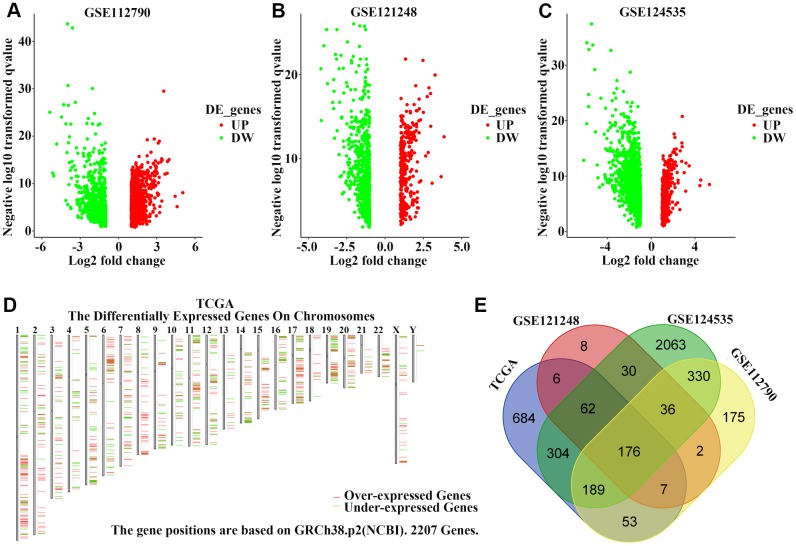
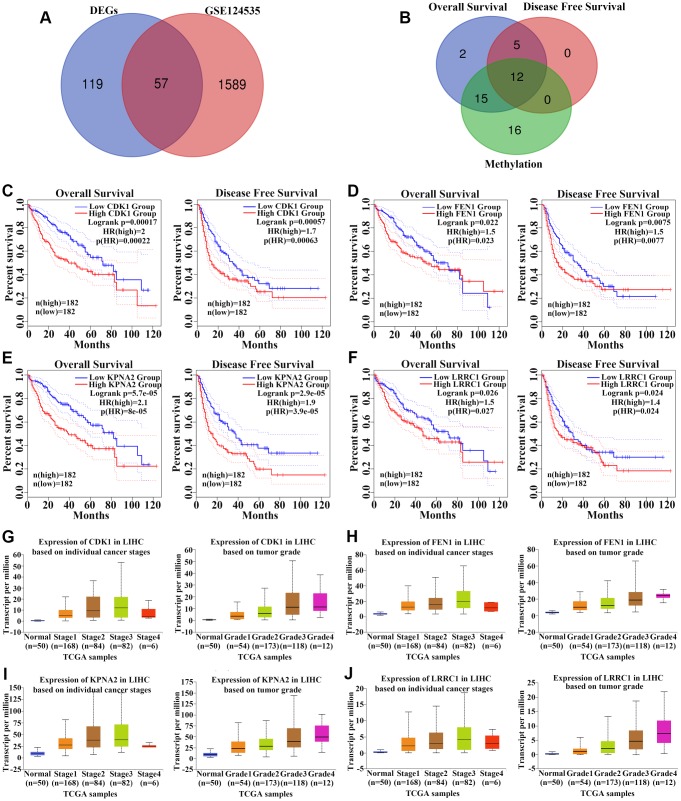
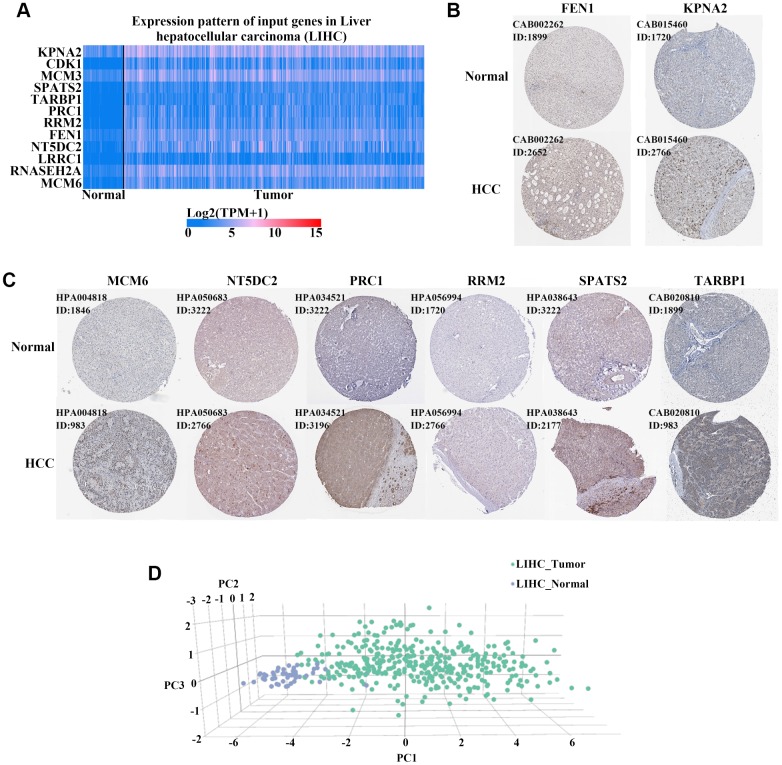
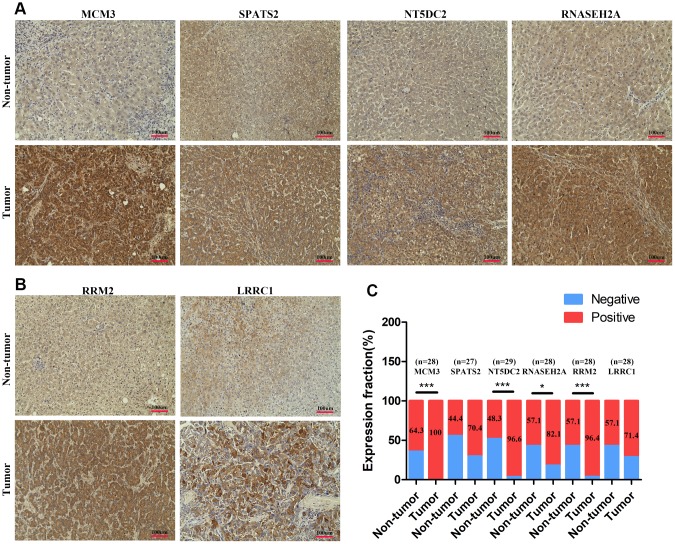
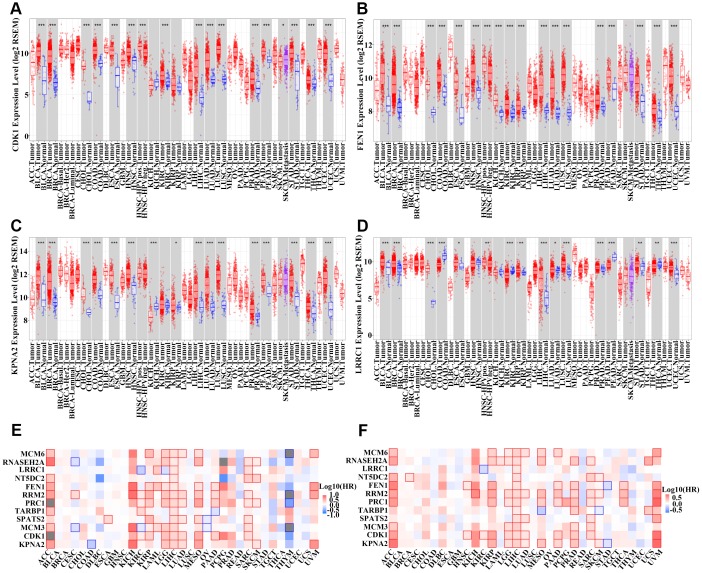
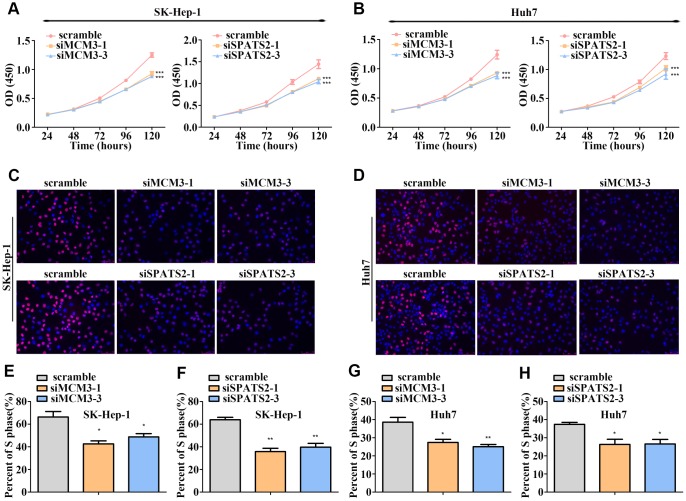
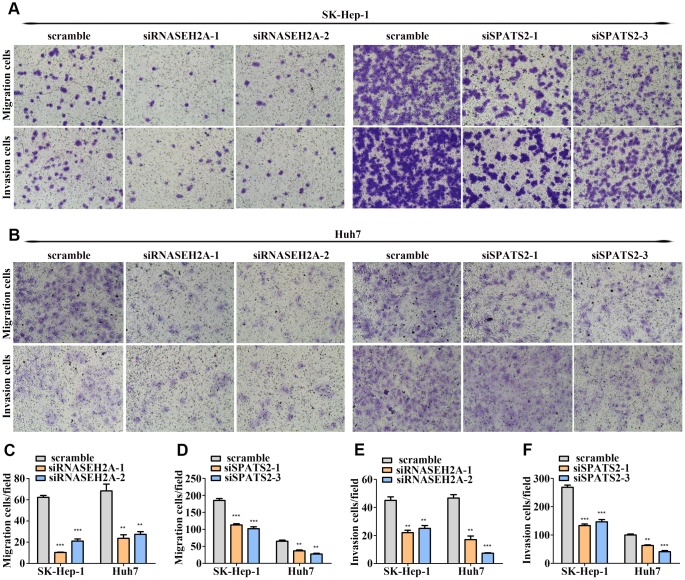
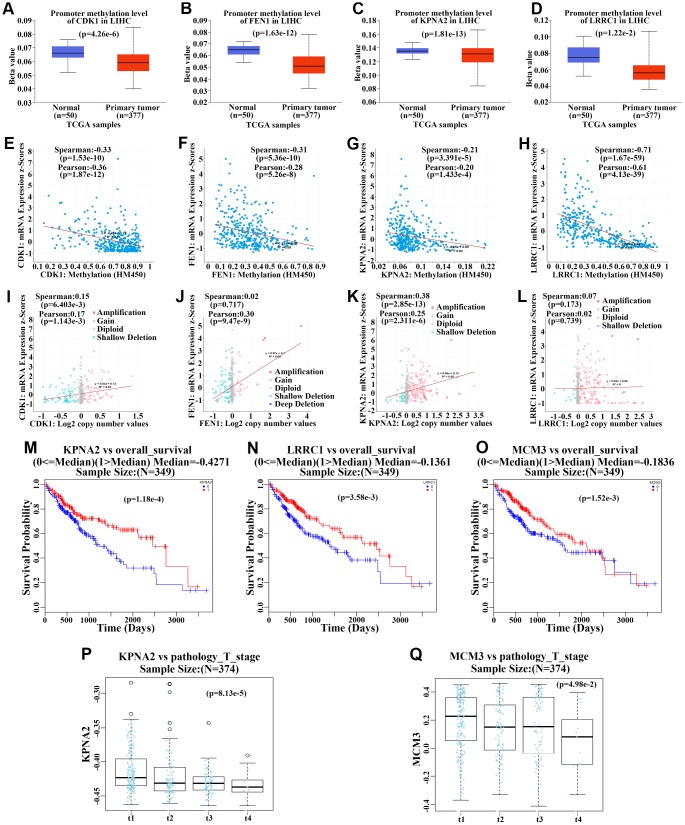
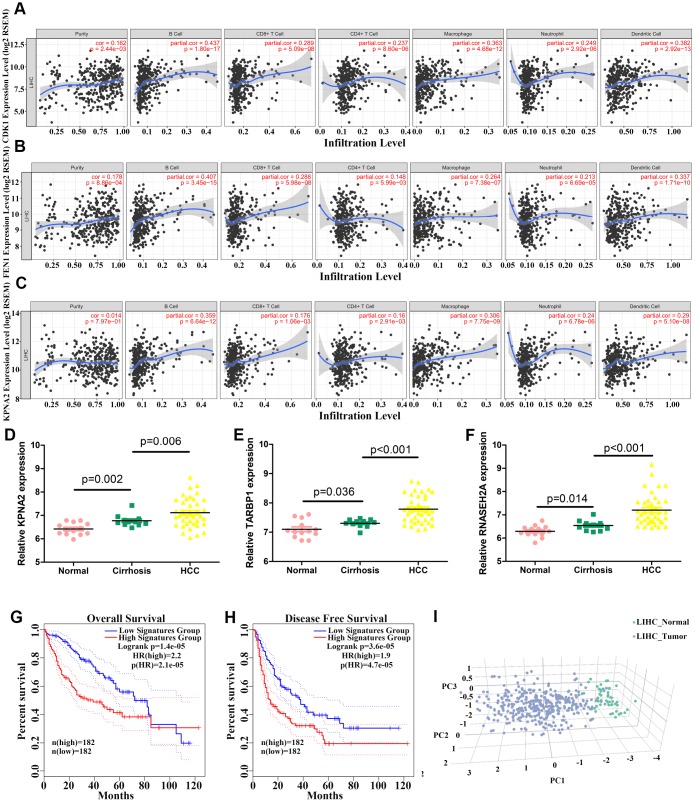
The molecular mechanisms underlying hepatocellular carcinoma (HCC) progression remain largely undefined. Here, we identified 176 commonly upregulated genes in HCC tissues based on three Gene Expression Omnibus datasets and The Cancer Genome Atlas (TCGA) cohort. We integrated survival and methylation analyses to further obtain 12 upregulated genes for validation. These genes were overexpressed in HCC tissues at the transcription and protein levels, and increased mRNA levels were related to higher tumor grades and cancer stages. The expression of all markers was negatively associated with overall and disease-free survival in HCC patients. Most of these hub genes can promote HCC proliferation and/or metastasis. These 12 hub genes were also overexpressed and had strong prognostic value in many other cancer types. Methylation and gene copy number analyses indicated that the upregulation of these hub genes was probably due to hypomethylation or increased gene copy numbers. Further, the methylation levels of three genes, KPNA2, MCM3, and LRRC1, were associated with HCC clinical features. Moreover, the levels of most hub genes were related to immune cell infiltration in HCC microenvironments. Finally, we identified three upregulated genes (KPNA2, TARBP1, and RNASEH2A) that could comprehensively and accurately provide diagnostic and prognostic value for HCC patients.

Keywords: bioinformatic analysis; diagnostic value; hepatocellular carcinoma; hub genes; prognostic value.


Conflict of interest statement

CONFLICTS OF INTEREST: The authors declare that they have no conflicts of interest.

Figures

Figure 1
Figure 1
Identification of upregulated genes in hepatocellular carcinoma (HCC) tissues. (AC) Volcano plot visualizing the differentially-expressed genes between HCC and non-tumor tissues in (A) GSE112790, (B) GSE121248, and (C) GSE124535 datasets. Each symbol represents a gene, and red or green colors indicate upregulated or downregulated genes, respectively. (D) The specific chromosomal locations of differentially-expressed genes between HCC and non-tumor tissues in the TCGA cohort. Red indicates overexpressed genes and green indicates downregulated genes. The vertical line represents chromosomes. (E) Common upregulated genes among GSE112790, GSE121248, GSE124535, and TCGA datasets.
Figure 2
Figure 2
Enrichment analysis, protein–protein interaction (PPI) network construction, and module analysis. (A) Metascape bar graph to view the top 20 non-redundant enrichment clusters of upregulated genes. The enriched biological processes were ranked by p-value. A deeper color indicates a smaller p-value. (B) Metascape visualization of the networks of the top 20 clusters. Each node represents one enriched term colored by cluster ID; nodes that share the same cluster are typically close to each other. Node size is proportional to the number of input genes falling into that term. Thicker edges indicate higher similarity. (C) PPI network construction of upregulated genes. (D) Four sub-networks were identified by Cytoscape MCODE plug-in analysis. Ingenuity pathway analysis of genes in each sub-network to obtain the biological pathways.
Figure 3
Figure 3
Identification of 12 upregulated hub genes among HCC datasets. (A) Among the 176 upregulated genes, 57 genes with higher protein levels in HCC tissues based on GSE124535 datasets were obtained. (B) We identified 12 upregulated hub genes by considering genes that were negatively associated with overall survival (OS) and disease-free survival (DFS) in HCC patients and genes that were hypomethylated. (CF) Analysis of the association between CDK1 (C), FEN1 (D), KPNA2 (E), and LRRC1 (F) expression and OS/DFS among HCC patients in the TCGA cohort. (GJ) Analysis of the association between CDK1 (C), FEN1 (D), KPNA2 (E), and LRRC1 (F) expression and cancer stage/tumor grade among HCC patients in the TCGA cohort. p-values are shown in Supplementary Table 3.
Figure 4
Figure 4
Verification of the expression of 12 hub genes in HCC. (A) Heatmaps of the levels of 12 hub genes comparing HCC and normal liver tissues in the TCGA cohort. Red and blue colors indicate higher and lower expression, respectively. (BC) Eight hub genes were upregulated in HCC compared to expression in normal tissues based on immunohistochemical staining analysis of the Human Protein Atlas database. Antibody numbers and patient/healthy control ID numbers were annotated. (D) Three-dimensional (3D) principle component analysis (PCA) score plot showing that HCC patients can be effectively distinguished from healthy controls based on the expression of these 12 genes.
Figure 5
Figure 5
The expression levels of MCM3, SPATS2, NT5DC2, RNASEH2A, LRRC1, and RRM2 in HCC tissues. (AB) Immunohistochemical staining analysed expression levels of MCM3, SPATS2, NT5DC2, RNASEH2A, LRRC1, and RRM2 in HCC and non-tumor tissues. (C) Positive expression percentage of the six genes in HCC and non-tumor tissues was showed. Fewer than 30 samples due to de-fragmentation. *P < 0.05; **P < 0.01; ***P < 0.001.
Figure 6
Figure 6
Detection of the expression of 12 hub genes in other types of cancer. (AD) Boxplot of CDK1 (A), FEN1 (B), KPNA2 (C), and LRRC1 (D) expression in different types of cancer and normal tissues from the TCGA pan-cancer cohort. (EF) Survival analysis examining the correlation between 12 hub genes and overall survival (OS) (E) or disease-free survival (DFS) (F) among different types of cancer patients in the TCGA cohort. Red wireframe indicates statistical differences. Red and blue colors show that gene expression was negatively and positively correlated with OS/DFS, respectively.
Figure 7
Figure 7
MCM3 and SPATS2 promotes HCC cell proliferation. (AB) Proliferation of HCC cells with MCM3 or SPATS2 knockdown according to CCK-8 analysis. (CD) EdU assays showing the proportion of S-phase cell after downregulating the expression of MCM3 or SPATS2. Nuclei of S-phase cells were pink. (EH) Statistical analysis of EdU incorporation. *P < 0.05; **P < 0.01; ***P < 0.001.
Figure 8
Figure 8
RNASEH2A and SPATS2 promotes HCC cell migration and invasion. (AB) HCC cell migration and invasion were detected after downregulating the expression of RNASEH2A or SPATS2 by Transwell and Boyden assays. (CF) Statistical analysis of Transwell and Boyden assay results. *P < 0.05; **P < 0.01; ***P < 0.001.
Figure 9
Figure 9
Methylation and gene copy number analyses of upregulated hub genes. (AD) Methylation levels of CDK1 (A), FEN1 (B), KPNA2 (C), and LRRC1 (D) in primary hepatocellular carcinoma (HCC) tumors and normal tissues from the TCGA cohort. (EH) Correlation analysis of methylation levels of CDK1 (E), FEN1 (F), KPNA2 (G), and LRRC1 (H) and their mRNA expression in HCC based on the TCGA cohort. (IL) Correlation analysis of gene copy numbers of CDK1 (I), FEN1 (J), KPNA2 (K), and LRRC1 (L) and their mRNA expression in HCC based on the TCGA cohort. (MO) Survival analysis of the correlation between methylation levels of KPNA2 (M), LRRC1 (N), and MCM3 (O) and overall survival (OS) in HCC patients from the TCGA cohort. (PQ) Analysis of the association between KPNA2 (P) and MCM3 (Q) methylation and pathologic T stage in HCC patients of the TCGA cohort.
Figure 10
Figure 10
Correlation between levels of hub genes and immune cell infiltration and identification of three hub genes. (AC) Correlation between CDK1 (A), FEN1 (B), and KPNA2 (C) levels and immune cell infiltration in hepatocellular carcinoma (HCC) tissues. Each dot represents a sample in the TCGA cohort. (DF) KPNA2 (D), TARBP1 (E), and RNASEH2A (F) mRNA levels in normal, cirrhosis, and HCC samples from GSE89377. (GH) Analysis of the correlation between three-hub gene expression signatures and overall survival (OS) (G) or disease-free survival (DFS) (H) for HCC patients of the TCGA cohort. (I) HCC patients could be effectively distinguished from healthy controls by principle component analysis (PCA) based on expression of the three genes.

References

    1. Bray F, Ferlay J, Soerjomataram I, Siegel RL, Torre LA, Jemal A. Global cancer statistics 2018: GLOBOCAN estimates of incidence and mortality worldwide for 36 cancers in 185 countries. CA Cancer J Clin. 2018; 68:394–424. 10.3322/caac.21492 - DOI - PubMed
    1. Dang H, Takai A, Forgues M, Pomyen Y, Mou H, Xue W, Ray D, Ha KC, Morris QD, Hughes TR, Wang XW. Oncogenic activation of the RNA binding protein NELFE and MYC signaling in hepatocellular carcinoma. Cancer Cell. 2017; 32:101–114.e8. 10.1016/j.ccell.2017.06.002 - DOI - PMC - PubMed
    1. Ni M, Liu X, Wu J, Zhang D, Tian J, Wang T, Liu S, Meng Z, Wang K, Duan X, Zhou W, Zhang X. Identification of candidate biomarkers correlated with the pathogenesis and prognosis of non-small cell lung cancer via integrated bioinformatics analysis. Front Genet. 2018; 9:469. 10.3389/fgene.2018.00469 - DOI - PMC - PubMed
    1. Hou Q, Bing ZT, Hu C, Li MY, Yang KH, Mo Z, Xie XW, Liao JL, Lu Y, Horie S, Lou MW. RankProd combined with genetic algorithm optimized artificial neural network establishes a diagnostic and prognostic prediction model that revealed C1QTNF3 as a biomarker for prostate cancer. EBioMedicine. 2018; 32:234–44. 10.1016/j.ebiom.2018.05.010 - DOI - PMC - PubMed
    1. Yang Y, Lu Q, Shao X, Mo B, Nie X, Liu W, Chen X, Tang Y, Deng Y, Yan J. Development of a three-gene prognostic signature for hepatitis B virus associated hepatocellular carcinoma based on integrated transcriptomic analysis. J Cancer. 2018; 9:1989–2002. 10.7150/jca.23762 - DOI - PMC - PubMed

Publication types