. 2020 Mar 26;5(6):e133429.
doi: 10.1172/jci.insight.133429.

Semaglutide lowers body weight in rodents via distributed neural pathways

Affiliations

Semaglutide lowers body weight in rodents via distributed neural pathways

Sanaz Gabery et al. JCI Insight. .

Abstract

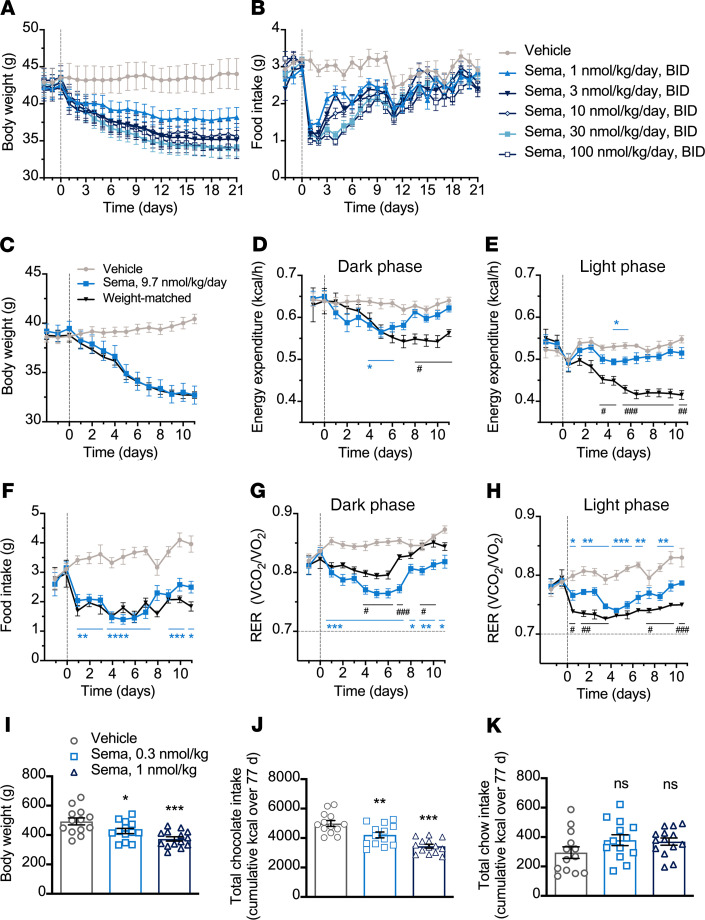
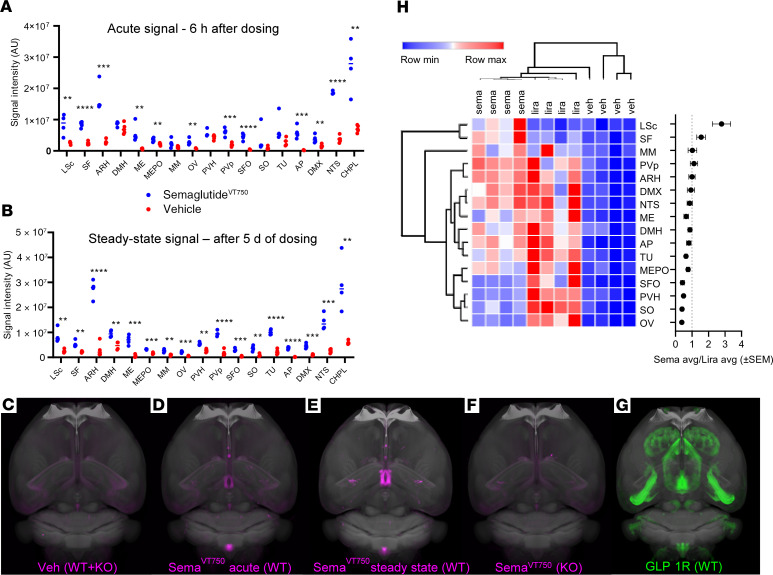
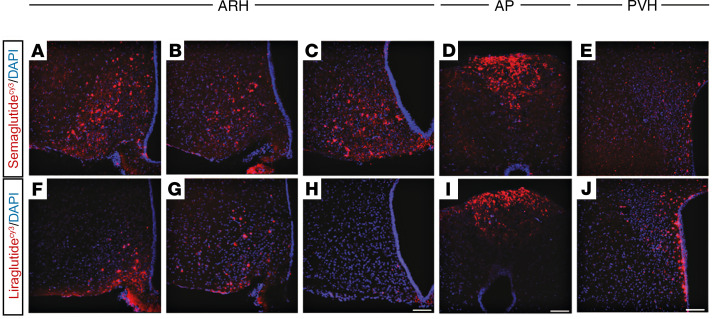
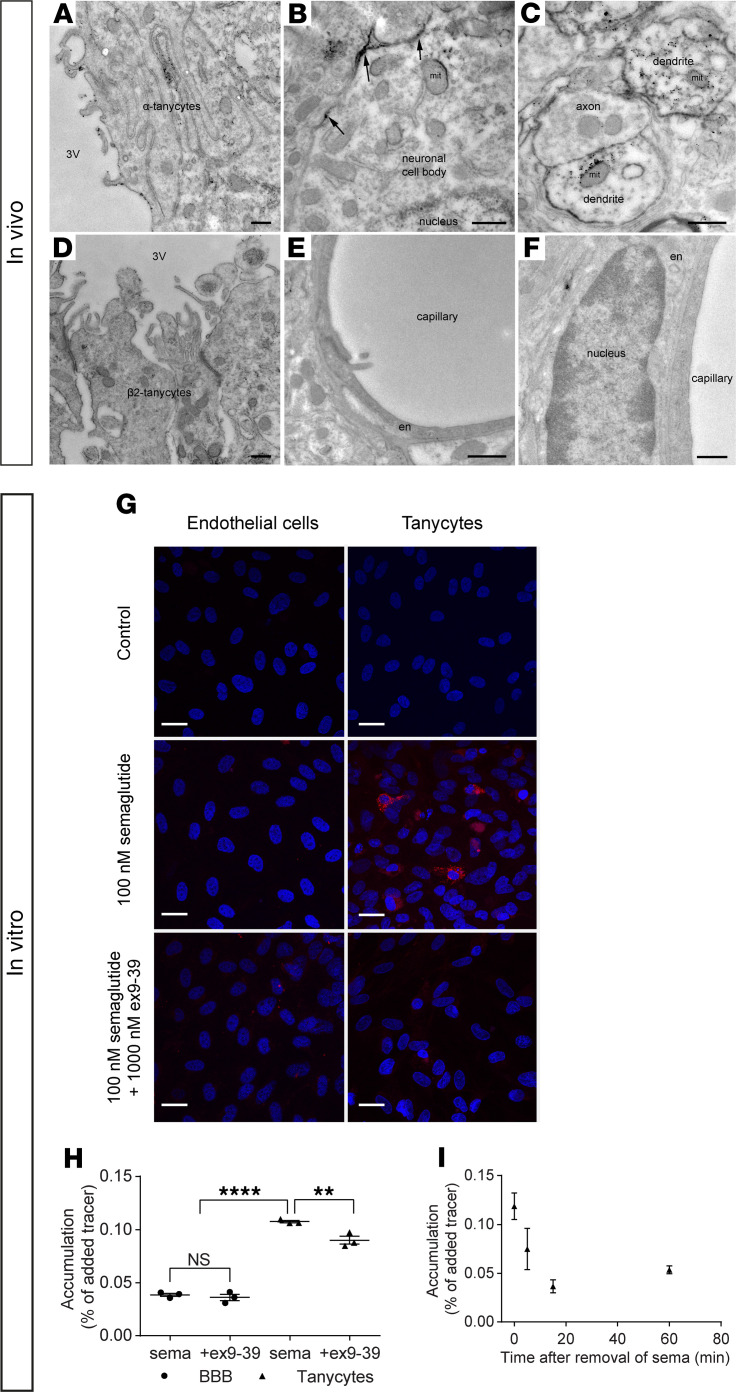
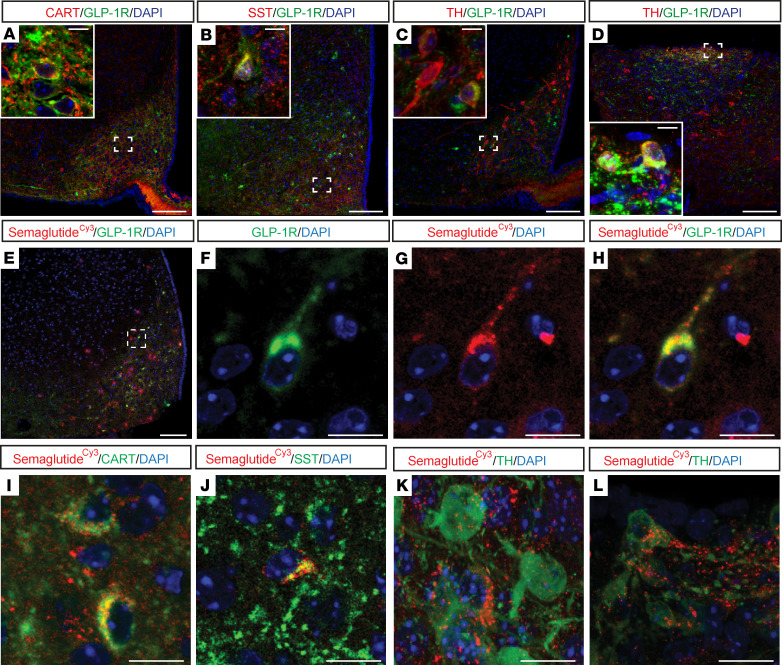
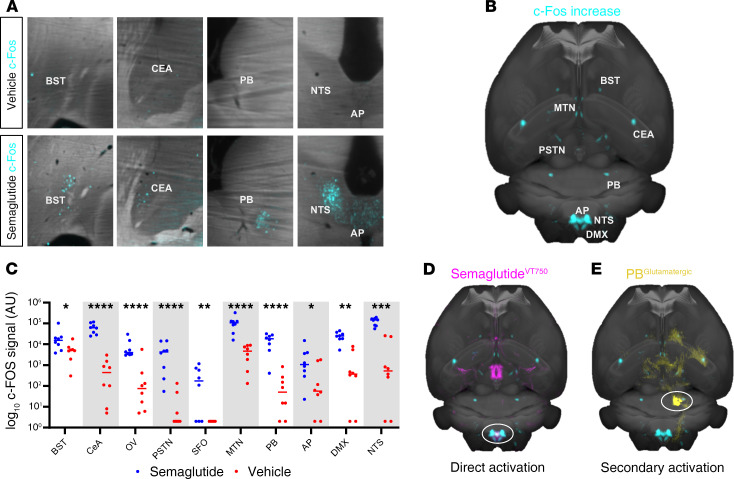
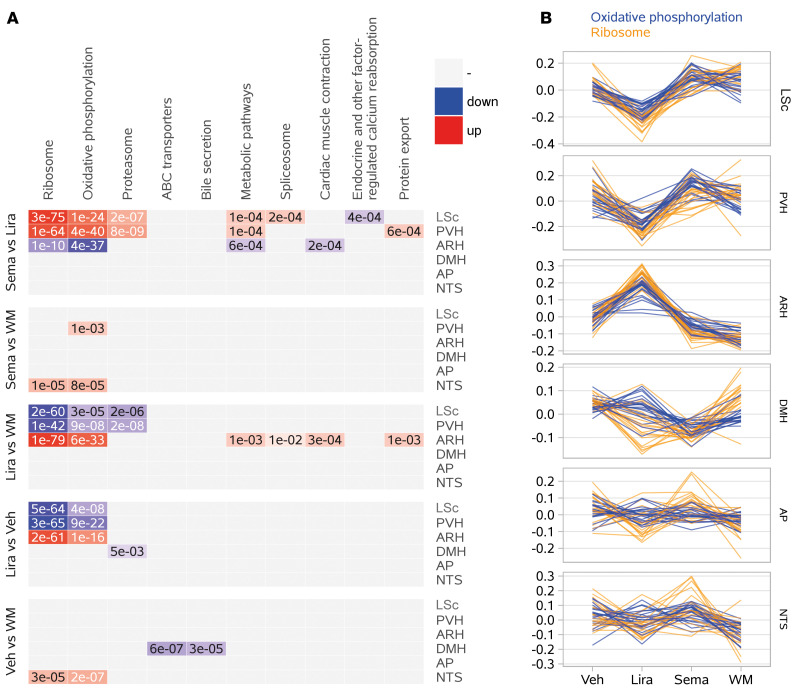
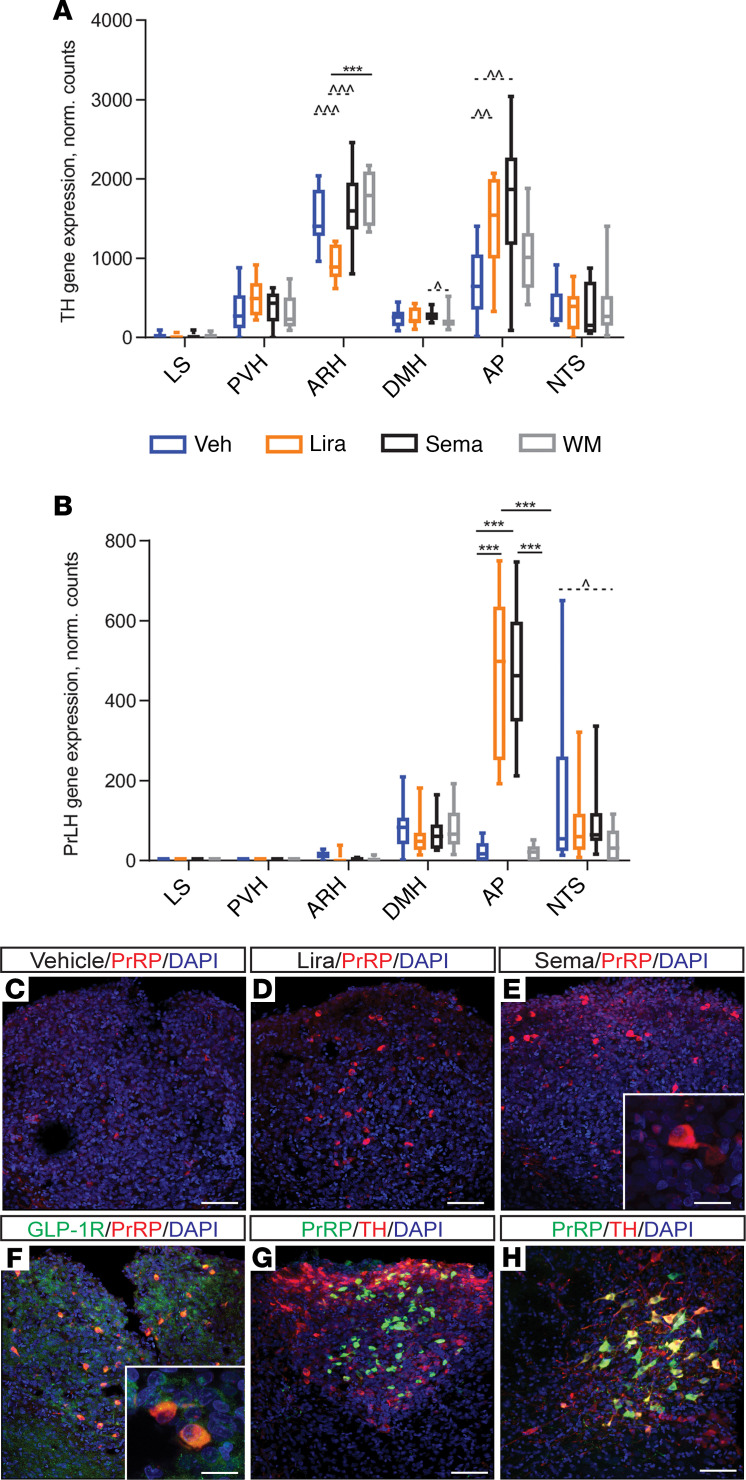
Semaglutide, a glucagon-like peptide 1 (GLP-1) analog, induces weight loss, lowers glucose levels, and reduces cardiovascular risk in patients with diabetes. Mechanistic preclinical studies suggest weight loss is mediated through GLP-1 receptors (GLP-1Rs) in the brain. The findings presented here show that semaglutide modulated food preference, reduced food intake, and caused weight loss without decreasing energy expenditure. Semaglutide directly accessed the brainstem, septal nucleus, and hypothalamus but did not cross the blood-brain barrier; it interacted with the brain through the circumventricular organs and several select sites adjacent to the ventricles. Semaglutide induced central c-Fos activation in 10 brain areas, including hindbrain areas directly targeted by semaglutide, and secondary areas without direct GLP-1R interaction, such as the lateral parabrachial nucleus. Automated analysis of semaglutide access, c-Fos activity, GLP-1R distribution, and brain connectivity revealed that activation may involve meal termination controlled by neurons in the lateral parabrachial nucleus. Transcriptomic analysis of microdissected brain areas from semaglutide-treated rats showed upregulation of prolactin-releasing hormone and tyrosine hydroxylase in the area postrema. We suggest semaglutide lowers body weight by direct interaction with diverse GLP-1R populations and by directly and indirectly affecting the activity of neural pathways involved in food intake, reward, and energy expenditure.

Keywords: Metabolism; Mouse models; Neuroimaging; Neuroscience; Obesity.


Conflict of interest statement

Conflict of interest: JAR, AFB, STB, KSF, JFJ, LMJ, CP, LS, AS, LBK, TTL, JP-W, HW, SG, CGS, GS, TA, HCCH, JN, and SJP are current or former Novo Nordisk employees and/or shareholders. CF and EF received research grants from Novo Nordisk to their institutions.

Figures

Figure 1
Figure 1. Semaglutide in obese rodents.
(A and B) BW and food intake in DIO mice treated twice daily (n = 9). (C−H) BW, EE, food intake, and RER in DIO mice treated once daily (n = 8). *P < 0.05, **P < 0.01, ***P < 0.001, and ****P < 0.0001 semaglutide (sema) vs. vehicle and #P < 0.05, ##P < 0.01, and ###P < 0.001 sema vs. weight-matched, mixed-effects model, Tukey’s post hoc. (I−K) BW and food preference in DIO rats treated once daily (n = 13–14). *P < 0.05, **P < 0.01, and ***P < 0.001 vs. vehicle, 1-way ANOVA, Dunnett’s post hoc. Data are individual measures with mean ± SEM. Animals were subject to a 12-hour light/12-hour dark cycle. RER, respiratory exchange ratio; sema, semaglutide.
Figure 2
Figure 2. SemaglutideVT750 distribution in mouse brain.
(A) Acute and (B) steady-state brain distribution. Dots show individual measures of total fluorescence signal in selected brain regions with horizontal bar at group median. Asterisks indicate enriched regions with FDR of 5%; **P ≤ 0.01; ***P ≤ 0.001; ****P ≤ 0.0001. (C−F) Maximum intensity projection (MIP) of the average signal computed from individual brains (n = 4) overlaid onto the Common Coordinate Framework version 3 template from AIBS. (C) Representative vehicle signal from WT and Glp1r–/– mice. (D) Acute semaglutideVT750 signal, WT mice. (E) Steady-state semaglutideVT750 signal, WT mice. (F) Acute semaglutideVT750 signal, KO mice. (G) GLP-1R distribution visualized with whole-brain IHC. (H) Clustered heatmap of fluorescence signal in selected brain regions from mice treated with semaglutideVT750, liraglutideVT750, or vehicle (n = 4). Plot shows average semaglutideVT750 versus liraglutideVT750 signal per region. Regions selected based on at least 2.5-fold signal enrichment over vehicle-treated animals in either semaglutide- or liraglutide-treated groups. Hierarchical clustering of samples (columns) and brain regions (rows) based on Pearson’s correlation. AIBS, Allen Institute for Brain Science; DMH, dorsomedial hypothalamic nucleus; FDR, false discovery rate; lira, liraglutide; liraglutideVT750, VivoTag750-S–labeled liraglutide; max., maximum; MEPO, median preoptic nucleus; min., minimum; MM, medial mammillary nucleus; PVH, paraventricular nucleus of the hypothalamus; PVp, posterior part; semaglutideVT750, VivoTag750-S-labeled semaglutide; SO, supraoptic nucleus; TU, tuberal nucleus; Veh, vehicle.
Figure 3
Figure 3. Differential distribution of semaglutideCy3 and liraglutideCy3 in the hypothalamus and AP.
Representative high-magnification confocal images from mice injected for 4 consecutive days with semaglutideCy3 or liraglutideCy3 (red, each n = 3); DAPI nuclear stain (blue). (AC and FH) ARH, 3 different levels from an anterior to posterior direction; (D and I) AP; and (E and J) PVH. Scale bar: 100 μm.
Figure 4
Figure 4. GLP-1R is present on tanycytes but not endothelial cells in rat ARH, and in vitro, semaglutide does not interact with BBB endothelial cells but is taken up by tanycytes.
Electron micrographs of rat tissue section from the ARH showing GLP-1R immunoreactivity (silver grains) on (A) the ventricular surface and interwoven lateral surface of α tanycytes, (B) the cell membrane of neuronal perikarya (arrows), and (C) the cytoplasm and surface of dendrites. (D) Limited, scattered GLP-1R immunoreactivity in β2 tanycytes lining the ventricular wall of the ME. (E and F) Endothelial cells lining capillaries in the ARH appear unlabeled. (G) SemaglutideCy3 (100 nM; in red) uptake in bovine brain endothelial cells (left column) in coculture with rat astrocytes and in rat tanycytes in monoculture (right column), with or without 1000 nM exendin 9-39 (ex-9-39). Nuclei Hoechst staining (blue). (H) Intracellular accumulation of 125I-semaglutide (0.7 nM) in BBB endothelial cells and tanycytes with or without 1000 nM ex-9-39. Individual values, mean, and SD shown (n = 3). Means were compared using 2-way ANOVA with Bonferroni’s correction. **P < 0.01, and ****P < 0.0001. (I) Intracellular accumulation of 125I-semaglutide in preloaded tanycytes in clean uptake buffer. Data are shown as mean and SD (n = 3). Scale bars: 500 nm (AF), 25 μm (G). en, endothelial cell; 3V, third ventricle; mit, mitochondrion.
Figure 5
Figure 5. GLP-1R neurons coexpress modulators of appetite regulation in areas directly targeted by peripheral administration of GLP-1RAs.
(A−H) Representative immunofluorescence images taken from mouse ARH and AP processed for GLP-1R (green) and CART, SST, and TH, respectively (red). DAPI nuclear staining (blue). GLP-1R expression in (A−C) ARH, colocalized with CART, SST, and TH, respectively, and in (D) AP colocalized with TH. Dashed boxes indicate the location of the insets. (E−L) Confocal images from mice i.v. injected for 4 consecutive days with semaglutideCy3 (red) and DAPI nuclear stain (blue) applied. (E−H) Colocalization of semaglutideCy3 with GLP-1R in the ARH. Dashed box in E indicates location of FH. (I−K) Colocalization of semaglutideCy3 with CART, SST, and TH, respectively, in the ARH and (L) with TH in AP. Scale bars: 100 μm (AE), 10 μm (AD insets and FH), and 20 μm (L). SST, somatostatin.
Figure 6
Figure 6. Semaglutide activates a meal termination pathway.
(A) c-Fos activation (blue) 4 hours after s.c. semaglutide or vehicle administration (horizontal sections). (B) Horizontal MIP of average c-Fos increase after semaglutide administration (n = 6). The signal is overlaid onto the Common Coordinate Framework version 3 template from AIBS. (C) Individual values for c-Fos signal 4 hours after s.c. semaglutide (blue) or vehicle (red) administration. Asterisks indicate enriched regions with FDR of 20%; *P ≤ 0.05; **P ≤ 0.01; ***P ≤ 0.001; ****P ≤ 0.0001. (D) Horizontal MIP of average c-Fos increase (blue) compared with average acute semaglutideVT750 access map (pink). White circle indicates possible direct activation in hindbrain. (E) Horizontal MIP of average c-Fos increase (blue) compared with connectivity map from AIBS outlining unilateral glutamatergic projections from the lateral PB (yellow, PB circled).
Figure 7
Figure 7. Transcriptomic effects across brain regions directly targeted by peripherally administered semaglutide and liraglutide.
(A) Top 10 KEGG pathways identified as overrepresented among DEGs (http://www.genome.jp/kegg/pathway.html). (B) Line charts of the 2 most highly concordant expression patterns among the DEGs shown in panel A: oxidative phosphorylation (blue) and ribosomal signaling (orange). Each line represents the relative expression of a single gene (median-centered, variance-stabilized expression count across samples for a given tissue/treatment). ABC, ATP-binding cassette; WM, weight matched.
Figure 8
Figure 8. TH and PrLH/PrRP are upregulated in semaglutide-treated rats.
Gene expression data for (A) TH and (B) PrLH, shown as box plots with median, interquartile range (box), and max/min (whiskers). ***P < 0.001, FDR < 0.05; ^P < 0.05, ^^P < 0.01, and ^^^P < 0.001, FDR > 0.05. (CH) Representative high-power immunofluorescence images of the AP and NTS stained for PrRP alone, or with GLP-1R or TH, and counterstained with DAPI nuclear stain. PrRP in the AP (C) with vehicle, (D) with liraglutide, (E) with semaglutide, (F) with GLP-1R costaining, (G) with TH costaining, and (H) PrRP and TH in NTS. Scale bars: 10 μm (E and F insets), 50 μm (C, D, G and H). PrLH, prolactin-releasing hormone.

References

    1. van Can J, Sloth B, Jensen CB, Flint A, Blaak EE, Saris WH. Effects of the once-daily GLP-1 analog liraglutide on gastric emptying, glycemic parameters, appetite and energy metabolism in obese, non-diabetic adults. Int J Obes (Lond) 2014;38(6):784–793. doi: 10.1038/ijo.2013.162. - DOI - PMC - PubMed
    1. Lau J, et al. Discovery of the once-weekly glucagon-like peptide-1 (GLP-1) analogue semaglutide. J Med Chem. 2015;58(18):7370–7380. doi: 10.1021/acs.jmedchem.5b00726. - DOI - PubMed
    1. Pratley RE, et al. Semaglutide versus dulaglutide once weekly in patients with type 2 diabetes (SUSTAIN 7): a randomised, open-label, phase 3b trial. Lancet Diabetes Endocrinol. 2018;6(4):275–286. doi: 10.1016/S2213-8587(18)30024-X. - DOI - PubMed
    1. Ahmann AJ, et al. Efficacy and safety of once-weekly semaglutide versus exenatide ER in subjects with type 2 diabetes (SUSTAIN 3): a 56-week, open-label, randomized clinical trial. Diabetes Care. 2018;41(2):258–266. doi: 10.2337/dc17-0417. - DOI - PubMed
    1. O’Neil PM, et al. Efficacy and safety of semaglutide compared with liraglutide and placebo for weight loss in patients with obesity: a randomised, double-blind, placebo and active controlled, dose-ranging, phase 2 trial. Lancet. 2018;392(10148):637–649. doi: 10.1016/S0140-6736(18)31773-2. - DOI - PubMed

Publication types