. 2020 Apr 23;5(8):e131571.
doi: 10.1172/jci.insight.131571.

Ribonuclease 1 attenuates septic cardiomyopathy and cardiac apoptosis in a murine model of polymicrobial sepsis

Affiliations

Ribonuclease 1 attenuates septic cardiomyopathy and cardiac apoptosis in a murine model of polymicrobial sepsis

Elisabeth Zechendorf et al. JCI Insight. .

Abstract

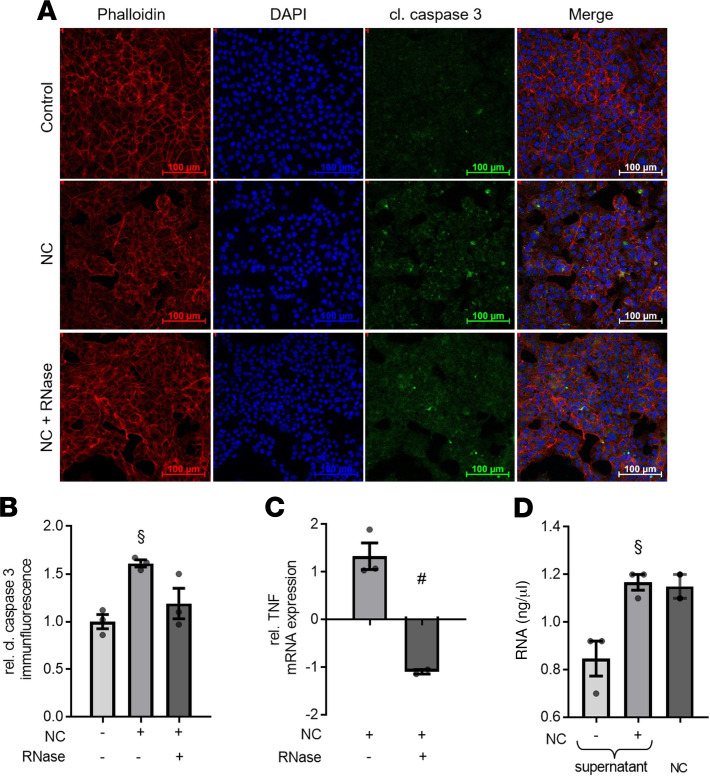
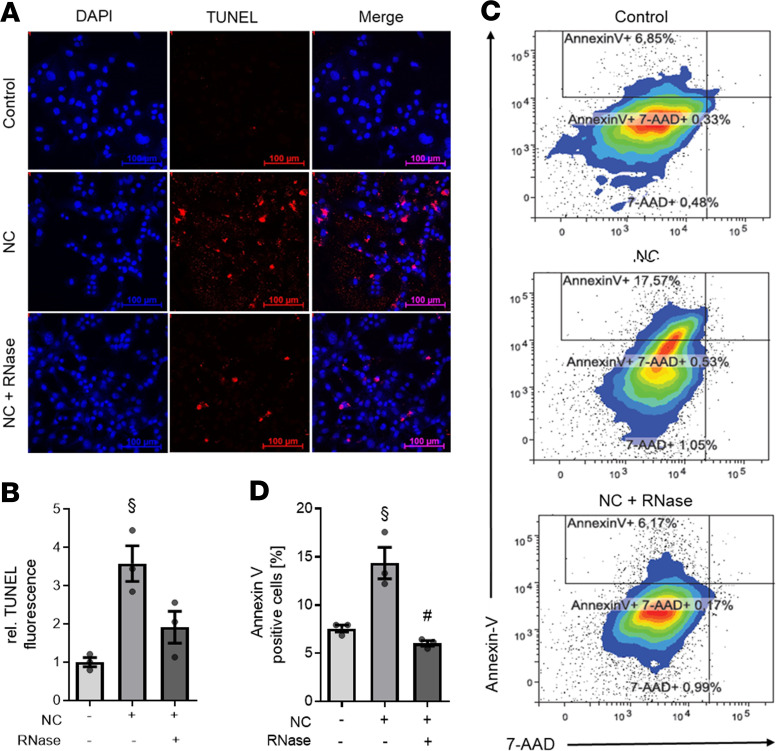
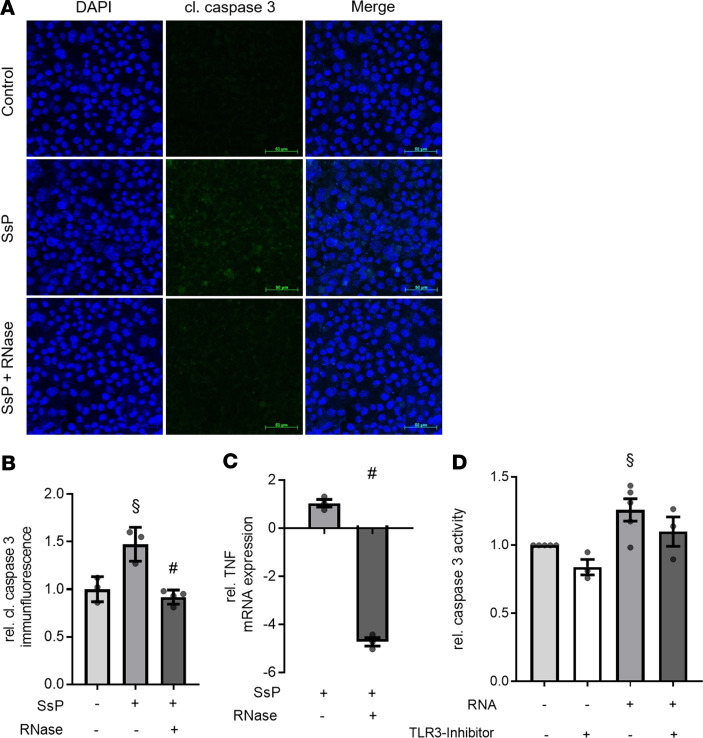
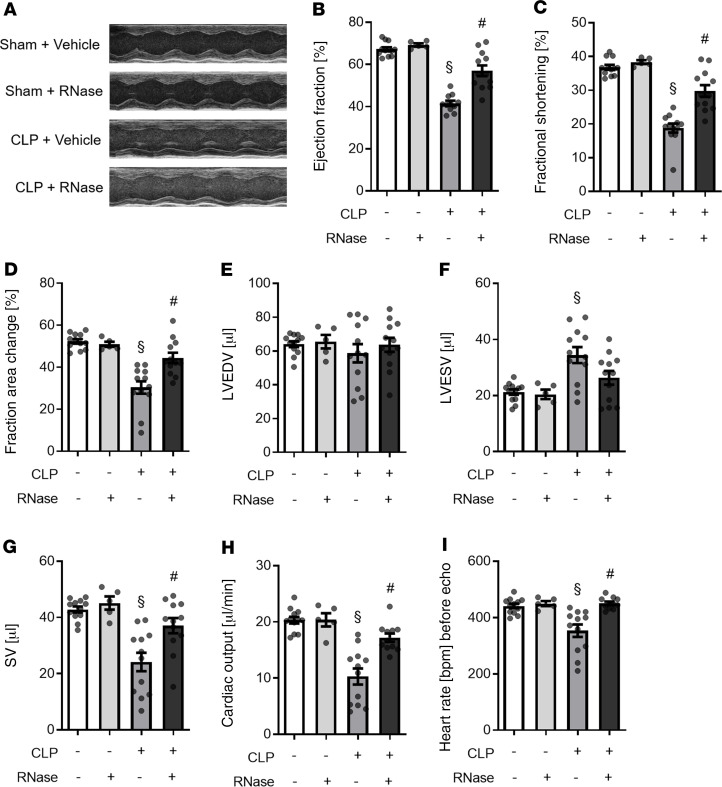
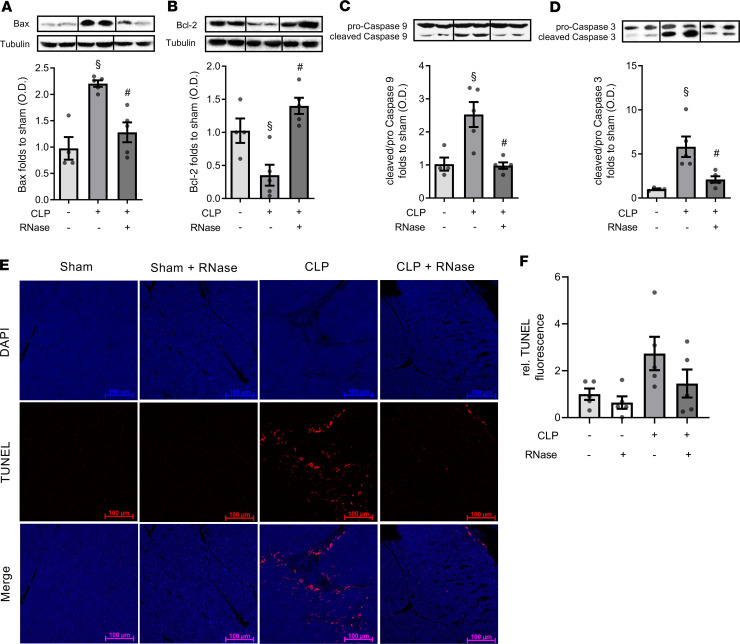
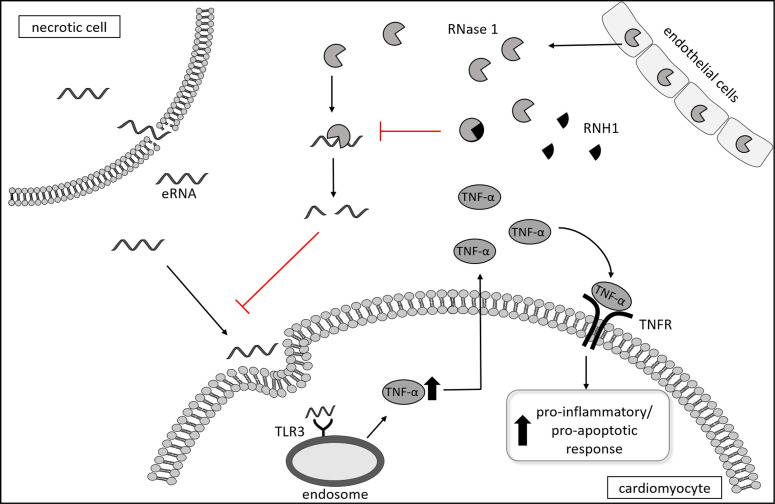
Septic cardiomyopathy is a life-threatening organ dysfunction caused by sepsis. Ribonuclease 1 (RNase 1) belongs to a group of host-defense peptides that specifically cleave extracellular RNA (eRNA). The activity of RNase 1 is inhibited by ribonuclease-inhibitor 1 (RNH1). However, the role of RNase 1 in septic cardiomyopathy and associated cardiac apoptosis is completely unknown. Here, we show that sepsis resulted in a significant increase in RNH1 and eRNA serum levels compared with those of healthy subjects. Treatment with RNase 1 resulted in a significant decrease of apoptosis, induced by the intrinsic pathway, and TNF expression in murine cardiomyocytes exposed to either necrotic cardiomyocytes or serum of septic patients for 16 hours. Additionally, treatment of septic mice with RNase 1 resulted in a reduction in cardiac apoptosis, TNF expression, and septic cardiomyopathy. These data demonstrate that eRNA plays a crucial role in the pathophysiology of the organ (cardiac) dysfunction in sepsis and that RNase and RNH1 may be new therapeutic targets and/or strategies to reduce the cardiac injury and dysfunction caused by sepsis.

Keywords: Anesthesiology; Immunology; Inflammation; Innate immunity; Pharmacology.


Conflict of interest statement

Conflict of interest: The authors have declared that no conflict of interest exists.

Figures

Figure 1
Figure 1. RNH1 and total extracellular RNA serum levels.
(A) RNH1 levels of healthy subjects (n = 10) and ICU patients with sepsis on the day of diagnosis (Sepsis DD) and 3 days after diagnosis (Sepsis D3; both n = 21) are displayed. A 1-way ANOVA followed by Bonferroni test was used for multiple comparisons. Data are presented as dot plot with the mean ± SEM. (B) Total eRNA levels from serum of healthy subjects (n = 10) and septic patients (n = 21) 3 days after diagnosis are demonstrated. An unpaired t test (2-tailed) was used for statistical analysis. Data are presented as dot plot with the mean ± SEM. (C) The eRNA size distribution from serum of healthy subjects (n = 10) and septic patients 3 days after diagnosis (n = 21) are presented in an electropherogram and a gel image. The first peak (between 10 and 100 nt) of the electropherograms represented the ladder. §P < 0.05 versus control/healthy. RNH1, ribonuclease-inhibitor 1; eRNA, extracellular RNA.
Figure 2
Figure 2. RNase 1 treatment results in decrease of cleaved caspase-3 immunofluorescence and TNF mRNA expression in murine cardiomyocytes exposed to necrotic cardiomyocytes.
(A) Cardiomyocytes exposed to 105 necrotic cardiomyocytes (NC) for 16 hours in presence (RNase + NC) or absence of 2.8 U/mL RNase 1 were stained with Phalloidin, DAPI, and anti-cleaved caspase-3 and compared with unstimulated cells (control). Phalloidin represents the cytosol (red), DAPI stained represents the nuclei (blue), and green immunofluorescence represents the cleaved caspase-3 (cl. caspase 3) expression. Scale bars: 100 μm. (B) Quantification of cleaved caspase 3 immunofluorescence (all n = 3). A 1-way ANOVA followed by Bonferroni test was used for multiple comparisons. Data are presented as dot plot with the mean ± SEM. (C) Relative TNF mRNA expression of cardiomyocytes exposed to NC in presence of RNase 1 compared with cardiomyocytes stimulated in absence of RNase 1 (both n = 3). An unpaired t test (2-tailed) was used for statistical analysis. Data are presented as dot plot with the mean ± SEM. (D) Total extracellular RNA in cell supernatant of cardiomyocytes exposed to NC for 16 hours and untreated cells (both n = 3) as well as eRNA level in 105 NC/mL (n = 2). A 1-way ANOVA followed by Bonferroni test was used for multiple comparisons. Data are presented as dot plot with the mean ± SEM. §P < 0.05 versus control; #P < 0.05 versus NC. NC, necrotic cardiomyocytes; RNase, ribonuclease 1.
Figure 3
Figure 3. RNase 1 treatment of cardiomyocytes exposed to necrotic cardiomyocytes results in decreased apoptosis.
Cardiomyocytes exposed to 105 necrotic cardiomyocytes in presence (RNase + NC) or absence (NC) of 2.8 U/mL RNase 1 for 16 hours compared with unstimulated cells (control) were analyzed (all n = 3). (A) Apoptotic cells were labeled with TUNEL (red) and the nuclei of cardiomyocytes stained with DAPI (blue). Scale bars: 100 μm. (B) Quantification of TUNEL fluorescence. A 1-way ANOVA followed by Bonferroni test was used for multiple comparisons. Data are presented as dot plot with the mean ± SEM. (C) Treated HL-1 cells were stained with annexin V and 7-AAD and analyzed by flow cytometry. Gate I (bottom left) displays the living cells. The annexin V+ cells are shown in Gate II (top left) and represent the apoptotic cardiomyocytes. The double-positive cells are demonstrated in gate III (top right) and in gate IV (bottom right), where the 7-AAD+ or necrotic cells are located. (D) The percentage of annexin V+ (apoptotic) cells is displayed. A 1-way ANOVA followed by Bonferroni test was used for multiple comparisons. Data are presented as dot plot with the mean ± SEM. §P < 0.05 versus control; #P < 0.05 versus NC. NC, necrotic cardiomyocytes; RNase, ribonuclease 1.
Figure 4
Figure 4. RNase 1 treatment or TLR3 inhibition results in decrease of caspase-3 activation and TNF expression in murine cardiomyocytes exposed to serum of septic patients or RNA.
(A) Cardiomyocytes exposed to 5 % serum of patients with sepsis (SsP) for 16 hours in presence (RNase + SsP; n = 4) or absence of 2.8 U/mL RNase 1 (n = 3) were stained with DAPI and anti-cleaved caspase-3 and compared with unstimulated cells (control; n = 3). DAPI stained the nuclei (blue) and the green immunofluorescence represents the cleaved caspase-3 (cl. caspase 3) expression. Scale bars: 50 μm. (B) Quantification of cleaved caspase-3 immunofluorescence. A 1-way ANOVA followed by Bonferroni test was used for multiple comparisons. Data are presented as dot plot with the mean ± SEM. (C) Relative TNF mRNA expression of cardiomyocytes exposed to SsP in presence of RNase 1 compared with cardiomyocytes stimulated in absence of RNase 1 (both n =3). An unpaired t test (2-tailed) was used for statistical analysis. Data are presented as dot plot with the mean ± SEM. (D) Relative caspase activity was analyzed in cardiomyocytes exposed to 100 ng/mL eRNA and unstimulated cells for 16 hours in presence (both n = 3) or absence (both n = 5) of 2 μM TLR3-Inhibitor using Caspase Glo assay. A 1-way ANOVA followed by Bonferroni test was used for multiple comparisons. Data are presented as dot plot with the mean ± SEM. §P < 0.05 versus control; #P < 0.05 versus SsP. SsP, serum of septic patients; RNase, ribonuclease 1.
Figure 5
Figure 5. RNase 1 treatment of mice with polymicrobial sepsis resulted in an improved heart function.
(A) Representative echocardiography images of each group are shown. (B) The ejection fraction, (C) fractional shortening, (D) fraction area change, (E) left ventricular end-diastolic volume (LVEDV), (F) left ventricular end-systolic volume (LVESV), (G) stroke volume (SV), (H) cardiac output and (I) heart rate before echocardiography of sham-operated mice treated with vehicle (n = 12) or RNase 1 (n = 5) and mice with polymicrobial sepsis induced by CLP treated with vehicle or RNase 1 were analyzed (both n = 12). Individual values are plotted as mean ± SEM. A 1-way ANOVA followed by Bonferroni test was used for multiple comparisons (graph B–I). §P < 0.05 versus sham; #P < 0.05 versus CLP + vehicle. CLP, cecal ligation and puncture; RNase, ribonuclease 1.
Figure 6
Figure 6. RNase 1 treatment of mice with polymicrobial sepsis resulted in a decreased cardiac apoptosis.
Heart tissue of sham-operated mice (n = 4) or mice with polymicrobial sepsis induced by CLP treated with vehicle or RNase 1 (both n = 5) were analyzed by Western blot. To analyze the intrinsic apoptosis signaling pathway, (A) Bax and (B) Bcl-2 levels as well as (C) caspase-9 and (D) caspase-3 activation were investigated. A 1-way ANOVA followed by Bonferroni test was used for multiple comparisons. Data are presented as dot plot with the mean ± SEM. Representative immunoblots are presented above the bar charts. The quantified OD of bands was corrected for the corresponding tubulin bands and normalized using the related sham band. Heart tissue of sham-operated mice treated with vehicle or RNase or mice with polymicrobial sepsis induced by CLP also treated with vehicle or RNase 1 (all n = 5) were analyzed by TUNEL labeling. (E) Apoptotic cells were labeled with TUNEL (red) and the nuclei of cardiomyocytes stained with DAPI (blue). Scale bars: 100 μm. (F) Quantification of TUNEL fluorescence. A 1-way ANOVA followed by Bonferroni test was used for multiple comparisons. Data are presented as dot plot with the mean ± SEM. §P < 0.05 versus Sham; #P < 0.05 versus CLP + Vehicle. CLP, cecal ligation and puncture; RNase, ribonuclease 1; Bcl-2, B-cell lymphoma 2.
Figure 7
Figure 7. RNase 1 treatment of mice with polymicrobial sepsis resulted in a decreased TNF expression.
(A) TNF, (B) RNase 1 and (C) RNH1 serum levels of sham-operated mice treated with vehicle (n = 11) or RNase 1 (n = 5) or mice with polymicrobial sepsis induced by CLP treated with vehicle (n = 8) or RNase 1 (n = 9) were analyzed by ELISA. An unpaired t test (2-tailed) was used for statistical analysis (A and C). In B, a 1-way ANOVA followed by Bonferroni test was used for multiple comparisons. Data are presented as dot plot with the mean ± SEM. (D) Total extracellular RNA in serum of mice are demonstrated. A 1-way ANOVA followed by Bonferroni test was used for multiple comparisons. Data are presented as dot plot with the mean ± SEM. (E) RNase 1 serum levels over the time in sham-operated mice (n = 3) and mice with polymicrobial sepsis induced by CLP treated with vehicle (n = 4). Correlation of TNF and RNase 1 of mice with polymicrobial sepsis induced by CLP (F) treated with vehicle and (G) treated with RNase 1. §P < 0.05 versus sham; #P < 0.05 versus CLP + vehicle. CLP, cecal ligation and puncture; RNase, ribonuclease 1; RNH1, ribonuclease-inhibitor 1.
Figure 8
Figure 8. Proposed pathway and pathophysiologic role of eRNA, RNase 1, and RNH1 in septic cardiomyopathy.
eRNA belongs to the heterogeneous group of DAMPs and is released as a result of sepsis-associated tissue injury and necrotic cell death. eRNA binds to the pattern recognition receptors toll-like receptor 3 located on the endosome, which results in the formation of TNF in cardiomyocytes. TNF binds to TNFR and induces pro-apoptotic as well as pro-inflammatory pathways. RNases belong to a group of host-defense peptides secreted from endothelial cells and thereby cleave eRNA. RNH1 binds to RNase 1 and inactivates the host-defense function of RNases, which allows eRNA to bind to TLR. eRNA, extracellular RNA; RNase 1, ribonuclease 1; RNH1, ribonuclease-inhibitor 1; TNFR, TNF receptor.

References

    1. Singer M, et al. The Third International Consensus Definitions for Sepsis and Septic Shock (Sepsis-3) JAMA. 2016;315(8):801–810. doi: 10.1001/jama.2016.0287. - DOI - PMC - PubMed
    1. SepNet Critical Care Trials Group. Incidence of severe sepsis and septic shock in German intensive care units: the prospective, multicentre INSEP study. Intensive Care Med. 2016;42(12):1980–1989. doi: 10.1007/s00134-016-4504-3. - DOI - PubMed
    1. Sato R, Kuriyama A, Takada T, Nasu M, Luthe SK. Prevalence and risk factors of sepsis-induced cardiomyopathy: a retrospective cohort study. Medicine (Baltimore) 2016;95(39):e5031. doi: 10.1097/MD.0000000000005031. - DOI - PMC - PubMed
    1. Narváez I, et al. Incidence and evolution of sepsis-induced cardiomyopathy in a cohort of patients with sepsis and septic shock. Med Intensiva. 2018;42(5):283–291. doi: 10.1016/j.medin.2017.08.008. - DOI - PubMed
    1. Martin L, et al. The septic heart: current understanding of molecular mechanisms and clinical implications. Chest. 2019;155(2):427–437. doi: 10.1016/j.chest.2018.08.1037. - DOI - PubMed

Publication types