. 2020 Mar 26;16(3):e1008676.
doi: 10.1371/journal.pgen.1008676. eCollection 2020 Mar.

Germ cell-intrinsic effects of sex chromosomes on early oocyte differentiation in mice

Affiliations

Germ cell-intrinsic effects of sex chromosomes on early oocyte differentiation in mice

Norio Hamada et al. PLoS Genet. .

Abstract

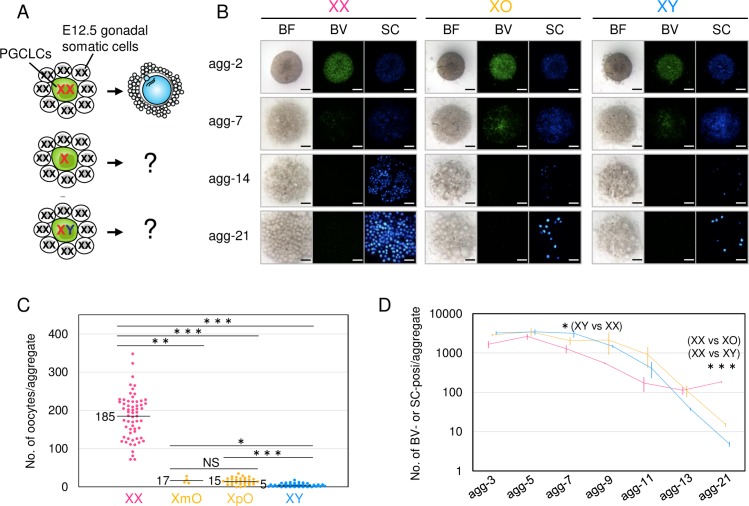
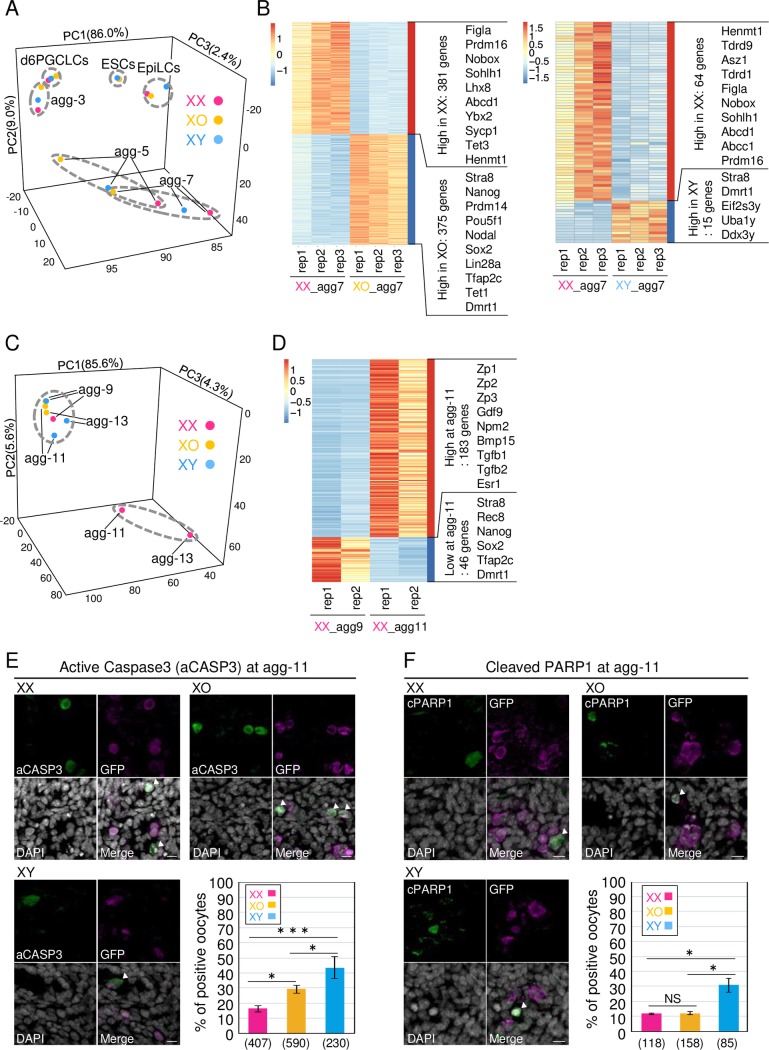
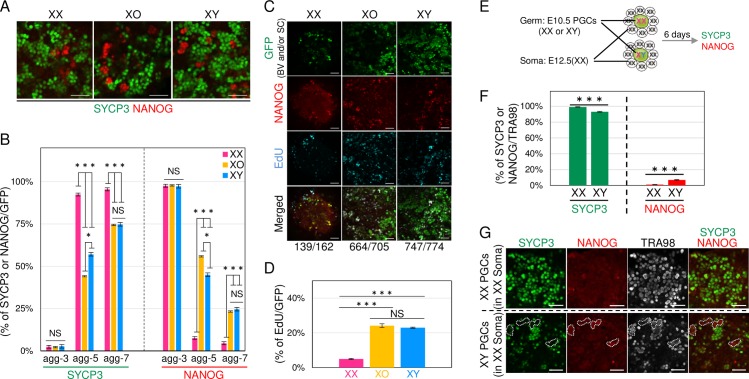
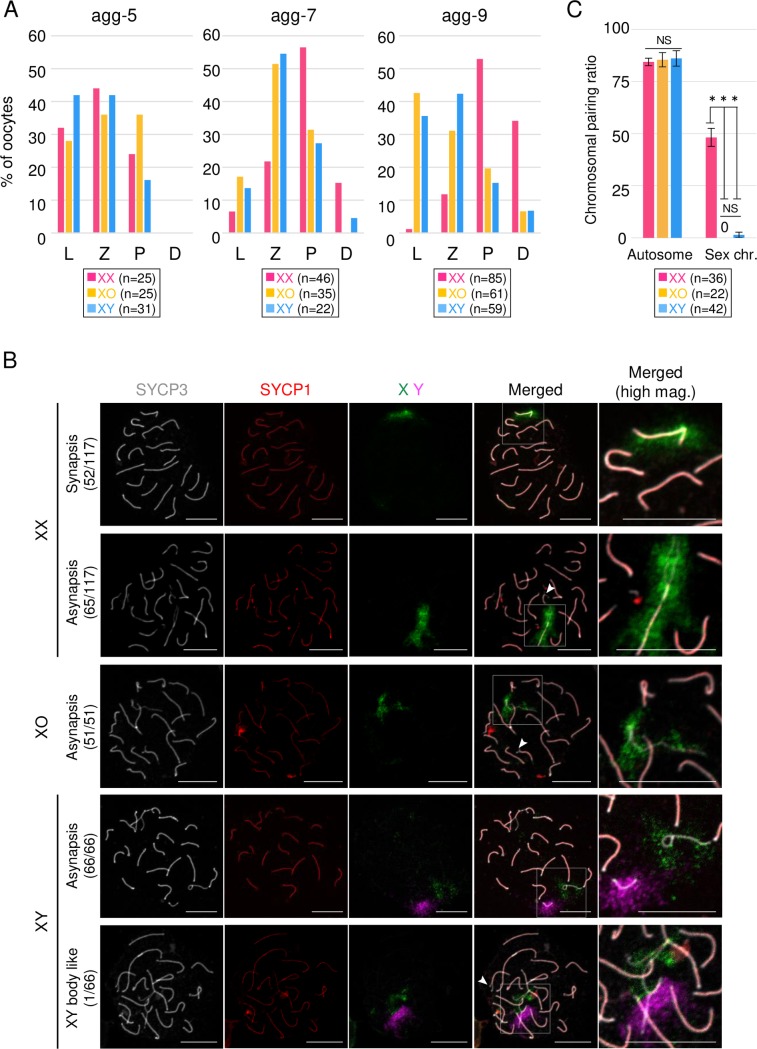
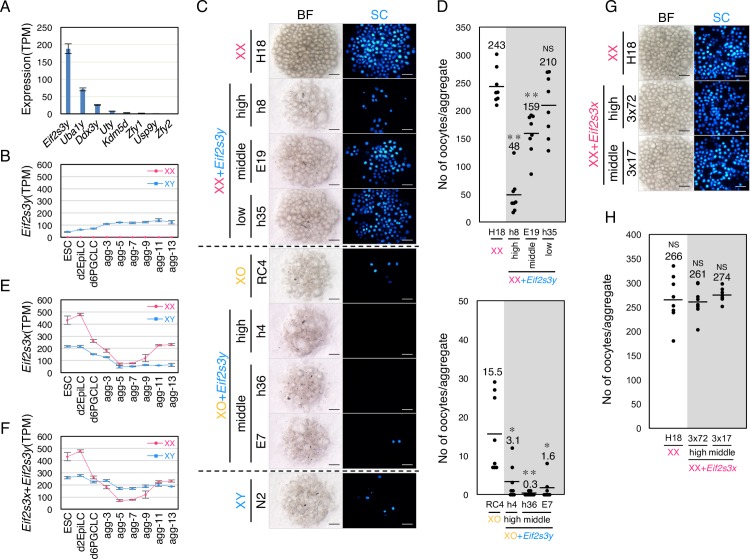
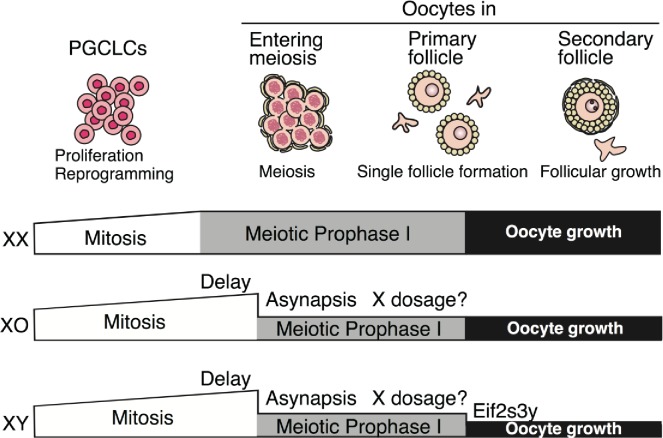
A set of sex chromosomes is required for gametogenesis in both males and females, as represented by sex chromosome disorders causing agametic phenotypes. Although studies using model animals have investigated the functional requirement of sex chromosomes, involvement of these chromosomes in gametogenesis remains elusive. Here, we elicit a germ cell-intrinsic effect of sex chromosomes on oogenesis, using a novel culture system in which oocytes were induced from embryonic stem cells (ESCs) harboring XX, XO or XY. In the culture system, oogenesis using XO and XY ESCs was severely disturbed, with XY ESCs being more strongly affected. The culture system revealed multiple defects in the oogenesis of XO and XY ESCs, such as delayed meiotic entry and progression, and mispairing of the homologous chromosomes. Interestingly, Eif2s3y, a Y-linked gene that promotes proliferation of spermatogonia, had an inhibitory effect on oogenesis. This led us to the concept that male and female gametogenesis appear to be in mutual conflict at an early stage. This study provides a deeper understanding of oogenesis under a sex-reversal condition.


Conflict of interest statement

The authors have declared that no competing interests exist.

Figures

Fig 1
Fig 1. Formation of XX, XO and XY oocytes in culture.
(A) Schematic illustration of the experimental design. PGCLCs derived from XX, XO and XY ESCs were reaggregated with E12.5 female (XX) gonadal somatic cells. (B) Oocyte differentiation from XX, XO and XY ESCs in culture. Images are rOvaries at the days indicated. Blimp1-mVenus (BV) is a marker of PGC(LC)s and stella-CFP (SC) is a marker of PGC(LC)s and oocytes. BF, bright field. Scale bars, 200 μm. (C) The number of oocytes formed in culture. Each dot indicates the number of oocytes formed in one rOvary. The numbers in the graph indicate the average number of oocytes/rOvary formed in each genotype. XpO and XmO indicate cells having a paternal and maternal X chromosome, respectively. (D) Time-course of the number of PGCLCs/oocytes. The average number of oocytes at the days indicated and SD are shown. The data was compiled from at least three independent experiments. P values were calculated by Steel Dwass test. ***P<0.001, **P<0.01, *P<0.05; NS, not significant.
Fig 2
Fig 2. Transcriptome analysis of XX, XO and XY oogenesis in vitro.
(A) PCA analysis of ESCs, EpiLCs, PGCLCs and PGCLCs/oocytes in agg-3-7. Each dot represents the data compiled from three independent experiments, except in the case of ESCs, where the dots represent the data from two independent experiments. (B) Heatmap analysis of the transcriptome of agg-7. The heatmap and clustering are based on the average of the transcripts per million (TPM) gene expression levels. The number of DEGs and representative genes are shown at the right of the heatmap. (C) PCA analysis of PGCLCs/oocytes in agg-9-13. Each dot represents the data compiled from two independent experiments. (D) Heatmap analysis of the transcriptomes of agg-9 and -11. The heatmap and clustering are based on the average of the transcripts per million (TPM) gene expression levels. The number of DEGs and representative genes are shown at the right of the heatmap. (E) Immunostaining of active Caspase 3. The graph depicts the results of the immunostaining analysis. (F) Immunostaining of cleaved PARP1. The graph depicts the results of the immunostaining analysis. Scale bars, 10 μm. The data was compiled from at least three independent experiments. P values were calculated by Tukey’s HSD test. ***P<0.001, *P<0.05; NS, not significant.
Fig 3
Fig 3. Meiotic initiation and progression in XX, XO and XY PGCLC/oocytes.
(A) Meiotic initiation in XX, XO and XY PGCLC/oocytes. Images show the immunofluorescence analysis of SYCP3 (green) and NANOG (red) in PGCLCs/oocytes at agg-7. Scale bars, 50 μm. (B) Time-course of meiotic entry. The graph shows the average percentage and SD of SYCP3- or NANOG-positive cells at the days indicated. The data were compiled from two independent experiments. (C) EdU incorporation into NANOG-positive cells. Images show the immunofluorescence analysis of BV/SC (green), NANOG (red), EdU (Blue) and their merged images in rOvaries. The number below the images indicates NANOG-positive cells per EdU-positive cells. Scale bars, 50 μm. (D) The percentage of EdU-positive cells per BV- and/or SC-positive cells. The graph indicates the average percentage and SD of EdU-positive cells per BV- and/or SC-positive cells. The data were compiled from two independent experiments. (E) Schematic diagram of the reconstitution experiment using PGCs derived in vivo. XX or XY PGCs of E10.5 embryos were reaggregated with gonadal somatic cells of E12.5 female embryos. (F) The percentage of cells entering meiosis. The graph shows the average percentage and SD of SYCP3- or NANOG-positive cells at the days indicated. The data was compiled from four independent experiments. P values were calculated by t-test. ***P<0.001. (G) NANOG-positive XY germ cells in the rOvary. Images show the immunofluorescence analysis of SYCP3 (green), NANOG (red), TRA98 (a marker of germ cells: white) and their merged images. The dashed lines indicate representative NANOG-positive germ cells. Scale bars, 50 μm.
Fig 4
Fig 4. Meiotic progression and chromosome paring in XX, XO and XY oocytes.
(A) Meiotic progression in XX, XO and XY oocytes. The graphs show the percentages of the meiotic stage at the day of culture indicated. L, leptotene; Z, zygotene; P, pachytene; D, diplotene. (B) Pairing of homologous chromosomes in XX, XO and XY oocytes. Images show the immunofluorescence analysis of SYCP3 (white) and SYCP1 (red), and FISH analysis of the X chromosome (green) and Y chromosome (purple). The dashed squares in the merged images are shown at high magnification (right). The numbers of samples showing the phenotype are shown with the total number tested (left). Arrowheads indicate asynapsed bivalents at the end of the chromosomes. Scale bars, 10 μm. (C) Pairing rates of autosomes and sex chromosomes. Each value was calculated from three independent experiments (see also Materials and Methods). P values were calculated by Tukey’s HSD test. ***P<0.001, **P<0.01, *P<0.05; NS, not significant.
Fig 5
Fig 5. Inhibitory effect of Eif2s3y on oogenesis.
(A) Expression level of Y-linked genes in XY oocytes at agg-7. Black bars indicate SD. (B) Expression dynamics of Eif2s3y. The graph shows TPM and SD of Eif2s3y in XX and XY cells. (C) Oocyte differentiation from Eif2s3y-expressing XX and XO ESCs. Images are rOvaries at agg-21. The expression level of Eif2s3y is shown as high, middle or low, based on S6B Fig. Scale bars, 200 μm. (D) The number of oocytes formed in culture. Each dot indicates the number of oocytes formed in one rOvary. The numbers in the graph indicate the average number of oocytes formed in each genotype. P values were calculated by Steel Dwass test. ***P<0.001, **P<0.01, *P<0.05; NS, not significant. (E) Expression dynamics of Eif2s3x. The graph shows TPM and SD of Eif2s3y in XX and XY cells. (F) Total amount of Eif2s3x and Eif2s3y transcripts. (G) Oocyte differentiation from Eif2s3x-expressing XX ESCs. Images are rOvaries at agg-21. The expression level of Eif2s3x is shown as high or middle, based on S6B Fig. Scale bars, 200 μm. (H) The number of oocytes formed in culture. Each dot indicates the number of oocytes formed in one rOvary. The numbers in the graph indicate the average number of oocytes formed in each genotype. P values were calculated by Steel Dwass test. ***P<0.001, **P<0.01, *P<0.05; NS, not significant.
Fig 6
Fig 6. Summary of oogenesis in culture using XX, XO and XY ESCs.
Differentiation of XO and XY oocytes is disrupted at three points. First, meiotic initiation was delayed in XO and XY oocytes. Second, pairing of homologous chromosomes was severely disrupted in XO and XY in oocytes. Although X-transcripts in XO and XY oocytes were lower than those in XX, how it affects to loss of oocytes is not clear. Third, Eif3s3y has a negative impact on oogenesis, although the molecular function remains to be clarified.

Similar articles

Cited by

References

    1. McLaren A. Germ and somatic cell lineages in the developing gonad. Mol Cell Endocrinol. 2000;163(1–2):3–9. 10.1016/s0303-7207(99)00234-8 - DOI - PubMed
    1. Saitou M, Yamaji M. Primordial germ cells in mice. Cold Spring Harbor perspectives in biology. 2012;4(11). Epub 2012/11/06. 10.1101/cshperspect.a008375 . - DOI - PMC - PubMed
    1. Adams IR, McLaren A. Sexually dimorphic development of mouse primordial germ cells: switching from oogenesis to spermatogenesis. Development. 2002;129(5):1155–64. . - PubMed
    1. Jameson SA, Natarajan A, Cool J, DeFalco T, Maatouk DM, Mork L, et al. Temporal transcriptional profiling of somatic and germ cells reveals biased lineage priming of sexual fate in the fetal mouse gonad. PLoS Genet. 2012;8(3):e1002575 Epub 2012/03/23. 10.1371/journal.pgen.1002575 - DOI - PMC - PubMed
    1. Koubova J, Menke DB, Zhou Q, Capel B, Griswold MD, Page DC. Retinoic acid regulates sex-specific timing of meiotic initiation in mice. Proc Natl Acad Sci U S A. 2006;103(8):2474–9. Epub 2006/02/08. 10.1073/pnas.0510813103 - DOI - PMC - PubMed

Publication types