. 2017;110(1):355-374.
doi: 10.1007/s00015-016-0256-x. Epub 2017 Feb 24.

Impact of the electron donor on in situ microbial nitrate reduction in Opalinus Clay: results from the Mont Terri rock laboratory (Switzerland)

Affiliations

Impact of the electron donor on in situ microbial nitrate reduction in Opalinus Clay: results from the Mont Terri rock laboratory (Switzerland)

Nele Bleyen et al. Swiss J Geosci. 2017.

Abstract

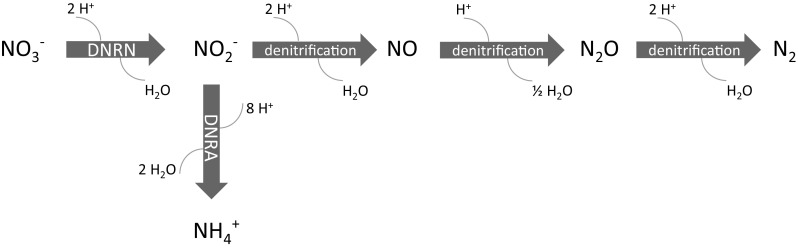
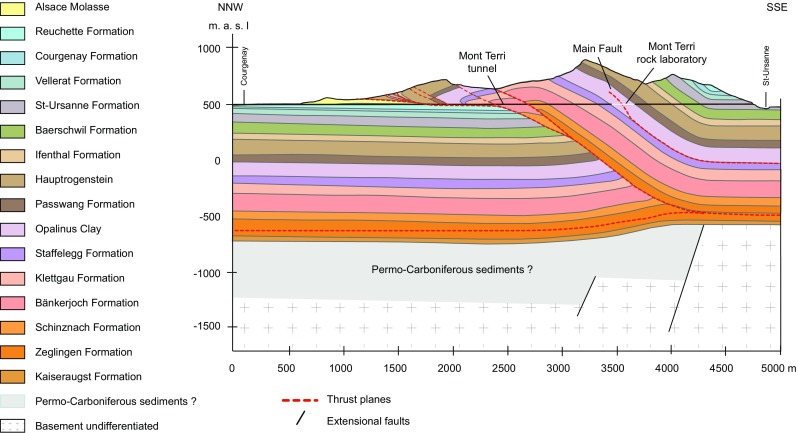
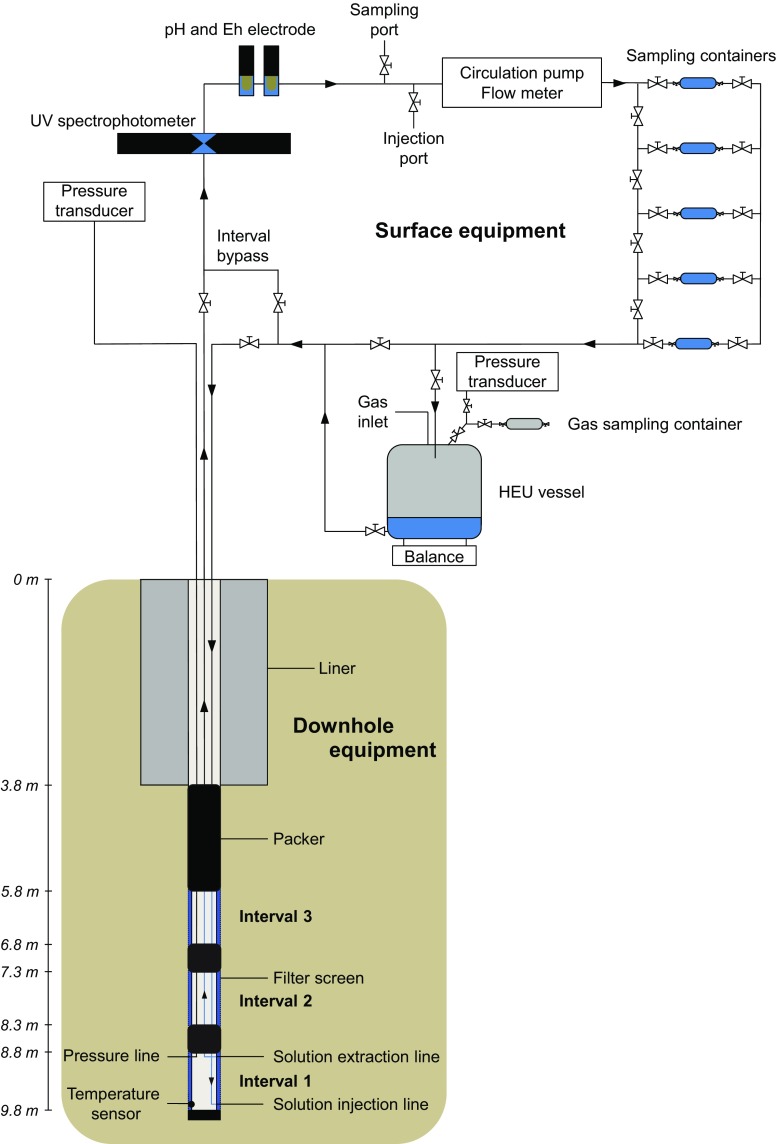
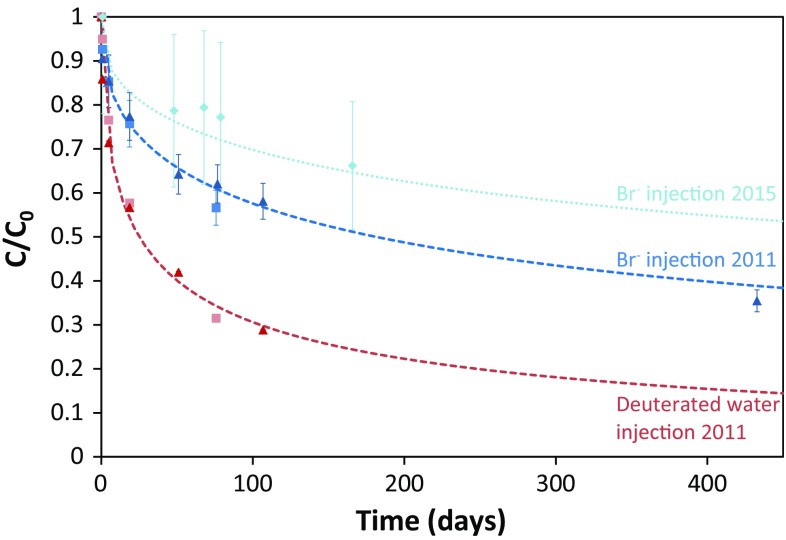
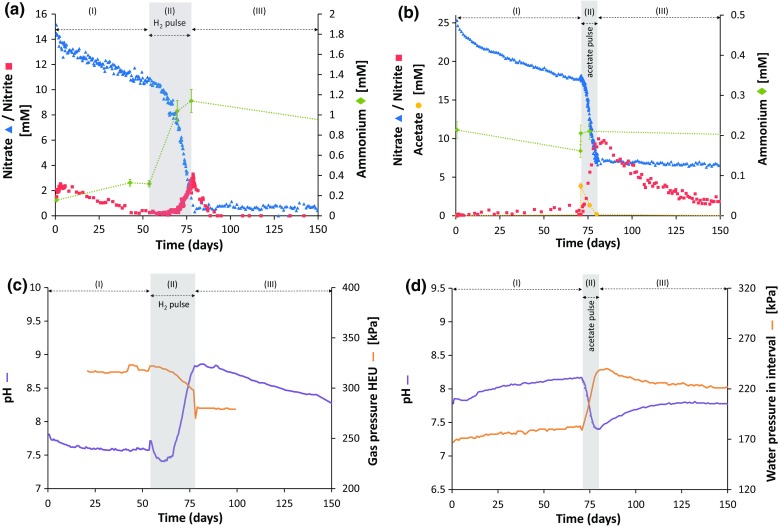
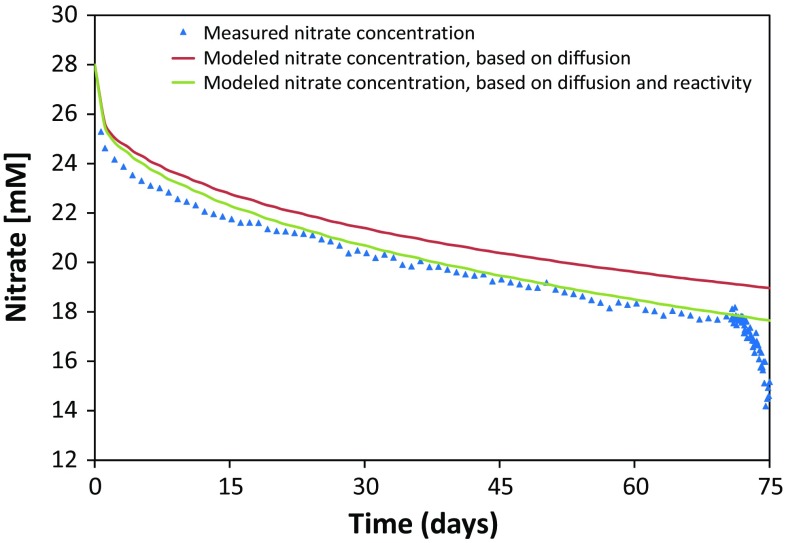
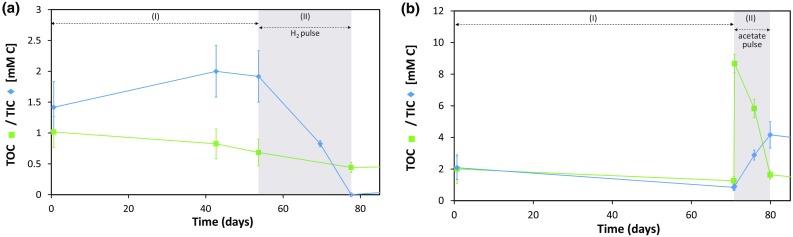
At the Mont Terri rock laboratory (Switzerland), an in situ experiment is being carried out to examine the fate of nitrate leaching from nitrate-containing bituminized radioactive waste, in a clay host rock for geological disposal. Such a release of nitrate may cause a geochemical perturbation of the clay, possibly affecting some of the favorable characteristics of the host rock. In this in situ experiment, combined transport and reactivity of nitrate is studied inside anoxic and water-saturated chambers in a borehole in the Opalinus Clay. Continuous circulation of the solution from the borehole to the surface equipment allows a regular sampling and online monitoring of its chemical composition. In this paper, in situ microbial nitrate reduction in the Opalinus Clay is discussed, in the presence or absence of additional electron donors relevant for the disposal concept and likely to be released from nitrate-containing bituminized radioactive waste: acetate (simulating bitumen degradation products) and H2 (originating from radiolysis and corrosion in the repository). The results of these tests indicate that-in case microorganisms would be active in the repository or the surrounding clay-microbial nitrate reduction can occur using electron donors naturally present in the clay (e.g. pyrite, dissolved organic matter). Nevertheless, non-reactive transport of nitrate in the clay is expected to be the main process. In contrast, when easily oxidizable electron donors would be available (e.g. acetate and H2), the microbial activity will be strongly stimulated. Both in the presence of H2 and acetate, nitrite and nitrogenous gases are predominantly produced, although some ammonium can also be formed when H2 is present. The reduction of nitrate in the clay could have an impact on the redox conditions in the pore-water and might also lead to a gas-related perturbation of the host rock, depending on the electron donor used during denitrification.

Keywords: Acetate; Clay; Hydrogen; Microorganisms; Nitrite; Nuclear waste disposal; Redox.


Figures

Fig. 1
Fig. 1
Biological pathways that reduce nitrate include dissimilative nitrate reduction to nitrite (DNRN), to gaseous N species like NO, N2O and N2 (denitrification) and to ammonium (DNRA). Each of these pathways requires specific reductase enzymes
Fig. 2
Fig. 2
Geological cross-section of the Mont Terri anticline and location of the Mont Terri rock laboratory (Nussbaum et al. 2017)
Fig. 3
Fig. 3
Schematic overview of the BN experiment, consisting of a vertical borehole rigged with a downhole equipment consisting of three packed-off intervals, each lined with a cylindrical sintered stainless steel filter screen to allow contact with the surrounding clay. Each interval is connected to a stainless steel water circulation unit, equipped with a circulation pump, a flow meter and water sampling containers. In two of the intervals, an online UV spectrophotometer and pH and Eh electrodes are also installed and in the circulation of Interval 1, also a Hydrogen Equilibration Unit (HEU) is available
Fig. 4
Fig. 4
Evolution of the bromide (blue) and deuterated water (red) concentration (represented in relative concentrations or C/C0) measured in the water in Interval 1 (triangles) and 2 (rectangles) during the first tracer diffusion tests in 2011. For Interval 1 a second bromide test was performed in 2015 (light blue diamonds). The expanded error (95% confidence) on the relative concentrations of bromide and deuterated water is, respectively, 6–22% and 0.55%. The dashed lines indicate the modeled concentrations based on a pore diffusion coefficient of bromide (2 × 10−11 m2 s−1) and of deuterium (1.2 × 10−10 m2 s−1), obtained based on the data from the first tracer diffusion tests in 2011. The dotted line indicates the modeled concentration for bromide based on the pore diffusion coefficient derived from the 2nd bromide diffusion test in 2015 (1 × 10−11 m2 s−1)
Fig. 5
Fig. 5
Evolution of the nitrogenous species, pH and pressures after injection of Intervals 1 and 2 with nitrate during tests INT1_2014 and INT2_2013 (Table 2). a, b Evolution of nitrate (blue), nitrite (red) and ammonium (green) concentrations after injection of a Interval 1 with 15 mM NO3- only and pulse injection with H2 after 54 days or b Interval 2 with 25 mM NO3- only and pulse injection with acetate after 70 days. c Evolution of the pH (purple) and gas pressure in the HEU (orange) after injection of Interval 1. d Evolution of the pH (purple) and water pressure (green) in Interval 2. Stages I and III: nitrate reactivity without additional electron donor; Stage II: nitrate reactivity during pulse injection with either H2 (Interval 1) or acetate (Interval 2). The errors on the values are 1% (pH), 10% ([NH4+], [CH3COO]), 7–15% ([NO3-]) and 15–20% ([NO2-]) for a 95% confidence interval. The uncertainties (95% confidence) on the pressures are 2 kPa (gas pressure) and 30 kPa (water pressure)
Fig. 6
Fig. 6
Comparison of measured (blue triangles) and modeled concentrations of nitrate after injection in Interval 2 during stage I. The modeled results were obtained using the pore diffusion coefficient of bromide (1.0 × 10−11 m2 s−1), derived from the second bromide tracer diffusion test carried out in 2015. Either only diffusion (red) or a combination of diffusion and nitrate reactivity (green) were taken into account in the model to fit the measured data
Fig. 7
Fig. 7
Evolution of the TOC (green) and TIC (blue) concentrations in Interval 1 and 2 after initial injection with NO3- only and pulse injection with H2 (a Interval 1; pulse after 54 days) or acetate (b Interval 2; pulse after 70 days). Open markers indicate concentrations below detection limit, i.e. 0.4 mmol C L−1 TIC. The error bars indicate the 95% confidence intervals

References

    1. Almeida J, Reis M, Carrondo M. Competition between nitrate and nitrite reduction in denitrification by Pseudomonas fluorescens. Biotechnology and Bioengineering. 1995;46:476–484. doi: 10.1002/bit.260460512. - DOI - PubMed
    1. Alt-Epping, P., Gimmi, T., & Waber, N. (2008). Porewater chemistry (PC) experiment: Reactive transport simulations. Mont Terri Technical Report, TR 07-03, Federal Office of Topography (swisstopo), Wabern, Switzerland. www.mont-terri.ch.
    1. ANDRA (2005). Dossier 2005. ANDRA research on the geological disposal of high-level long-lived radioactive waste. Results and perspectives. ANDRA report, ANDRA, Châtenay-Malabry, France.
    1. Bagnoud A, de Bruijn I, Andersson AF, Diomidis N, Leupin OX, Schwyn B, Bernier-Latmani R. A minimalistic microbial food web in an excavated deep subsurface clay rock. FEMS Microbiology Ecology. 2016;92:fiv138. doi: 10.1093/femsec/fiv138. - DOI - PubMed
    1. Bertani G. STUDIES ON LYSOGENESIS I: The mode of phage liberation by lysogenic Escherichia coli. Journal of Bacteriology. 1951;62:293–300. - PMC - PubMed

LinkOut - more resources