. 2020 Mar 5:2020:4173578.
doi: 10.1155/2020/4173578. eCollection 2020.

Functional Comparison between Healthy and Multiple Myeloma Adipose Stromal Cells

Affiliations

Functional Comparison between Healthy and Multiple Myeloma Adipose Stromal Cells

Nicolas Espagnolle et al. Stem Cells Int. .

Abstract

Multiple myeloma (MM) is an incurable B cell neoplasia characterized by the accumulation of tumor plasma cells within the bone marrow (BM). As a consequence, bone osteolytic lesions develop in 80% of patients and remain even after complete disease remission. We and others had demonstrated that BM-derived mesenchymal stromal cells (MSCs) are abnormal in MM and thus cannot be used for autologous treatment to repair bone damage. Adipose stromal cells (ASCs) represent an interesting alternative to MSCs for cellular therapy. Thus, in this study, we wondered whether they could be a good candidate in repairing MM bone lesions. For the first time, we present a transcriptomic, phenotypic, and functional comparison of ASCs from MM patients and healthy donors (HDs) relying on their autologous MSC counterparts. In contrast to MM MSCs, MM ASCs did not exhibit major abnormalities. However, the changes observed in MM ASCs and the supportive property of ASCs on MM cells question their putative and safety uses at an autologous or allogenic level.


Conflict of interest statement

The authors declare that there is no conflict of interest regarding the publication of this article.

Figures

Figure 1
Figure 1
Transcriptomic comparison between multiple myeloma (MM) and healthy donor (HD) adipose stromal cells (ASCs). (a) Heatmap of differentially expressed genes between HD ASCs (blue, n = 12) and MM ASCs (green, n = 12). (b) Principal component analysis of total gene expression from HD ASCs (blue, n = 12) and MM ASCs (green, n = 12). Each point corresponds to one patient.
Figure 2
Figure 2
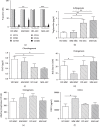
Phenotype and differentiation potential of HD and MM ASCs compared with autologous MSCs. (a) Expression of CD73, CD90, CD105, CD31, CD45, and CD200 in cells after primoculture. Data are mean % positive cells ± SEM (n = 12 independent experiments). Adipogenic differentiation with triglyceride dosage (b), chondrogenic differentiation with glycosaminoglycan dosage (c), osteoblastic differentiation with quantification of alizarin red (d), and alkaline phosphatase activity (e) evaluated from all cell sources. Data are the mean ± SEM (n = 9 independent experiments). (f) DKK1 secretion from HD/MM ASCs or MSCs. Data are the mean ± SEM (n = 8 independent experiments). p < 0.05, ∗∗p < 0.01, ∗∗∗p < 0.001.
Figure 3
Figure 3
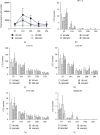
Hematopoiesis support potential of HD and MM ASCs compared with autologous MSCs. CD34+ hematopoietic stem cells were cocultured with HD/MM ASCs or MSCs. At days 7, 14, 21, 28, and 35, nonadherent hematopoietic cells were counted (a) and tested for hematopoietic progenitor content (b) burst forming unit (BFU)-erythroid (BFU-E), (c) colony forming unit (CFU)-granulocytes (CFU-G), (d) CFU-monocytes (CFU-M), (e) CFU-granulocyte macrophages (CFU-GM), and (f) mixed CFU. Data are the mean ± SEM number of CFU (n = 4 independent experiments).
Figure 4
Figure 4
Comparison of promyeloma activities from HD and MM ASCs compared with autologous MSCs. (a) ELISA of GDF15 secretion from HD/MM MSCs and HD/MM ASCs. Data are the mean ± SEM (n = 11 independent experiments). (b) ELISA of IL-6 secretion. Data are the mean ± SEM (n = 9 independent experiments). (c) Number of MOLP6 MM cells on day 7 after coculture with HD/MM MSCs and HD/MM ASCs. Data are the mean ± SEM (n = 9 independent experiments). Represents % increase compared to HD MSC condition. p < 0.05, ∗∗p < 0.01, ∗∗∗p < 0.001.

References

    1. Palumbo A., Anderson K. Multiple myeloma. The New England Journal of Medicine. 2011;364(11):1046–1060. doi: 10.1056/NEJMra1011442. - DOI - PubMed
    1. Raab M. S., Podar K., Breitkreutz I., Richardson P. G., Anderson K. C. Multiple myeloma. The Lancet. 2009;374(9686):324–339. doi: 10.1016/S0140-6736(09)60221-X. - DOI - PubMed
    1. Kyle R. A., Rajkumar S. V. Criteria for diagnosis, staging, risk stratification and response assessment of multiple myeloma. Leukemia. 2009;23(1):3–9. doi: 10.1038/leu.2008.291. - DOI - PMC - PubMed
    1. Esteve F. R., Roodman G. D. Pathophysiology of myeloma bone disease. Best Practice & Research Clinical Haematology. 2007;20(4):613–624. doi: 10.1016/j.beha.2007.08.003. - DOI - PubMed
    1. Raje N., Roodman G. D. Advances in the biology and treatment of bone disease in multiple myeloma. Clinical Cancer Research. 2011;17(6):1278–1286. doi: 10.1158/1078-0432.CCR-10-1804. - DOI - PubMed