. 2017;4(1):23.
doi: 10.1186/s40562-017-0089-0. Epub 2017 Oct 24.

Using ultra-low frequency waves and their characteristics to diagnose key physics of substorm onset

Affiliations

Using ultra-low frequency waves and their characteristics to diagnose key physics of substorm onset

I J Rae et al. Geosci Lett. 2017.

Abstract

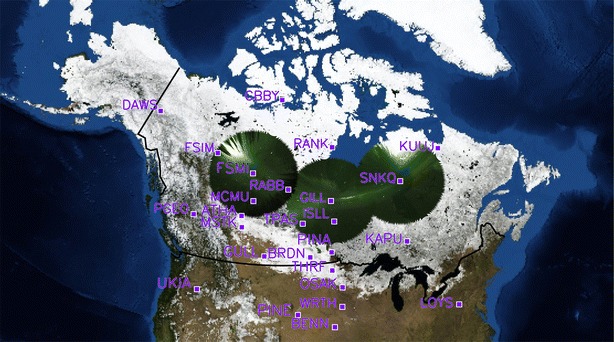
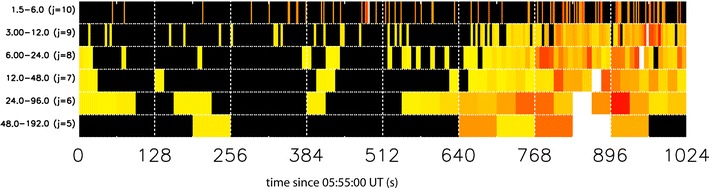
Substorm onset is marked in the ionosphere by the sudden brightening of an existing auroral arc or the creation of a new auroral arc. Also present is the formation of auroral beads, proposed to play a key role in the detonation of the substorm, as well as the development of the large-scale substorm current wedge (SCW), invoked to carry the current diversion. Both these phenomena, auroral beads and the SCW, have been intimately related to ultra-low frequency (ULF) waves of specific frequencies as observed by ground-based magnetometers. We present a case study of the absolute and relative timing of Pi1 and Pi2 ULF wave bands with regard to a small substorm expansion phase onset. We find that there is both a location and frequency dependence for the onset of ULF waves. A clear epicentre is observed in specific wave frequencies concurrent with the brightening of the substorm onset arc and the presence of "auroral beads". At higher and lower wave frequencies, different epicentre patterns are revealed, which we conclude demonstrate different characteristics of the onset process; at higher frequencies, this epicentre may demonstrate phase mixing, and at intermediate and lower frequencies these epicentres are characteristic of auroral beads and cold plasma approximation of the "Tamao travel time" from near-earth neutral line reconnection and formation of the SCW.


Conflict of interest statement

The authors declare that they have no competing interests.

Figures

Fig. 1
Fig. 1
Locations of the ground magnetometers from the CARISMA, THEMIS, CANMOS and McMAC magnetometer chains (for details see text). Overplotted in the figure are data from the GILL THEMIS ASI at 06:04:20 UT which approximately correspond to the time of auroral brightening in this substorm event
Fig. 2
Fig. 2
North–south slices (keograms) from the GILL THEMIS ASI and GILL NORSTAR MSP from 05:30:30 to 06:30:30 UT. From top to bottom, the figure shows data from the white-light GILL ASI, together with the 6300 A (red), 5577 A (green) and 4861 A (blue) emission lines from the GILL NORSTAR MSP. The orange vertical line denotes the first observation of ULF waves during this interval, at 06:04:20 UT, discussed later in the text
Fig. 3
Fig. 3
AWESOME (Murphy et al. 2009a) analysis of the substorm in 2008-03-05/06:04:20 UT, run from 05:55:00 UT. Displayed in the figure are wavelet-derived power spectra as a function of time and wavelet period (s) or j (wavelet basis). The colours represent normalised wavelet coefficients, whereby black represents wavelet coefficients below the pre-determined threshold for each j and yellow-orange-red-white are coefficients rising above the threshold in increasing amplitude
Fig. 4
Fig. 4
A minimum curvature fit for the onset times in the (left) j = 5 or 48–192 s, (centre) j = 6 or 24–96 s, and (right) j = 7 or 12–48 s period bands as derived at each magnetometer station. Coloured, annotated contours represent the onset times, and the contours of each panel are separated by 32 s to show consistent onset contours across wave bands. The maximum error in this fit is of the order of seconds and hence represents the actual onset time at each station within stated errors. Stations that did not record an onset in the right-hand panel at lower latitudes are not used in this analysis
Fig. 5
Fig. 5
A minimum curvature fit to the difference in onset times across the entire Canadian sector for (a) Pi2 and Pi1-2, where red (blue) represents Pi2 waves occurring first (second), and (b) Pi1 and Pi1-2, where blue represents Pi1 waves occurring second, with respect to Pi1-2 waves. The uncertainty in the relative timing between ULF wave bands is defined as the summation of each individual ULF wave band uncertainty. Hence, the timing uncertainties associated with each comparison are as follows: Pi1–Pi1-2 is ± 24 s, Pi1-2–Pi2 is ± 48 s. Any regions in white represent locations where the onset of ULF waves in each band is at the same time within the inherent uncertainties outlined here. Each relative timing analysis thus uses contours which start at the first resolvable timing difference outside these different uncertainties, and those that cannot be resolved are marked in white

References

    1. Akasofu SI. The development of the auroral substorm. Planet Space Sci. 1964;12(4):273–282. doi: 10.1016/0032-0633(64)90151-5. - DOI
    1. Akasofu SI. Magnetospheric substorms. Q J R Astron Soc. 1977;18(2):170–187.
    1. Angelopoulos V. The THEMIS mission. Space Sci Rev. 2008;141:5–34. doi: 10.1007/s11214-008-9336-1. - DOI
    1. Arnoldy RL, et al. Simultaneous measurement of aurora-related, irregular magnetic pulsations at northern and southern high latitudes. J Geophys Res. 1987;92(A11):12221–12232. doi: 10.1029/JA092iA11p12221. - DOI
    1. Atkinson G. Current system of geomagnetic bays. J Geophys Res. 1967;72(23):6063–6067. doi: 10.1029/JZ072i023p06063. - DOI

LinkOut - more resources