. 2020 Jul;41(10):2553-2566.
doi: 10.1002/hbm.24982. Epub 2020 Mar 26.

Multi-scale network regression for brain-phenotype associations

Affiliations

Multi-scale network regression for brain-phenotype associations

Cedric Huchuan Xia et al. Hum Brain Mapp. 2020 Jul.

Abstract

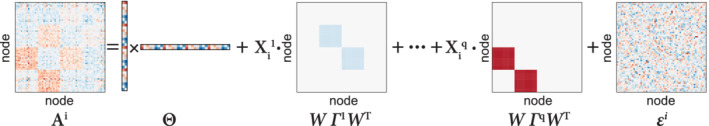
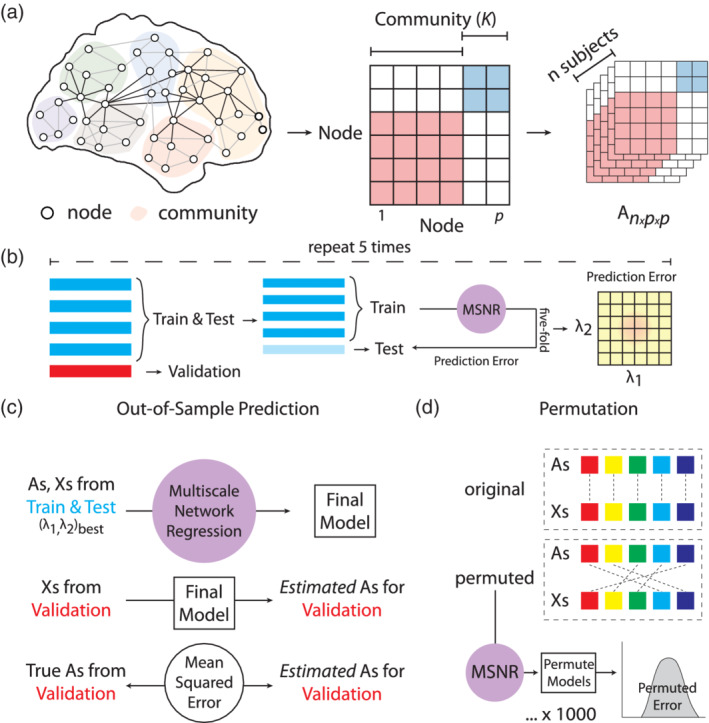
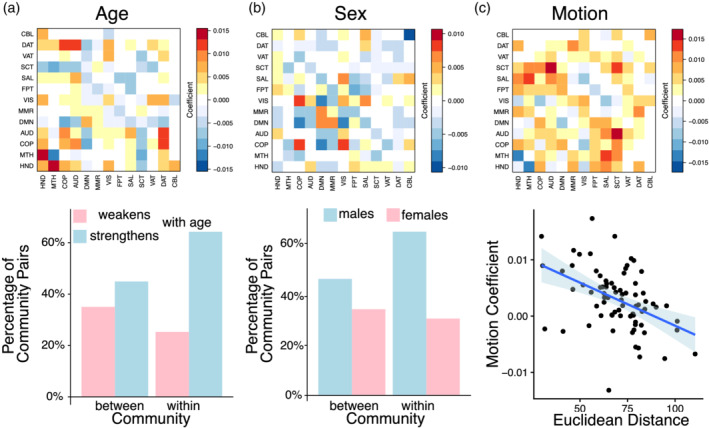
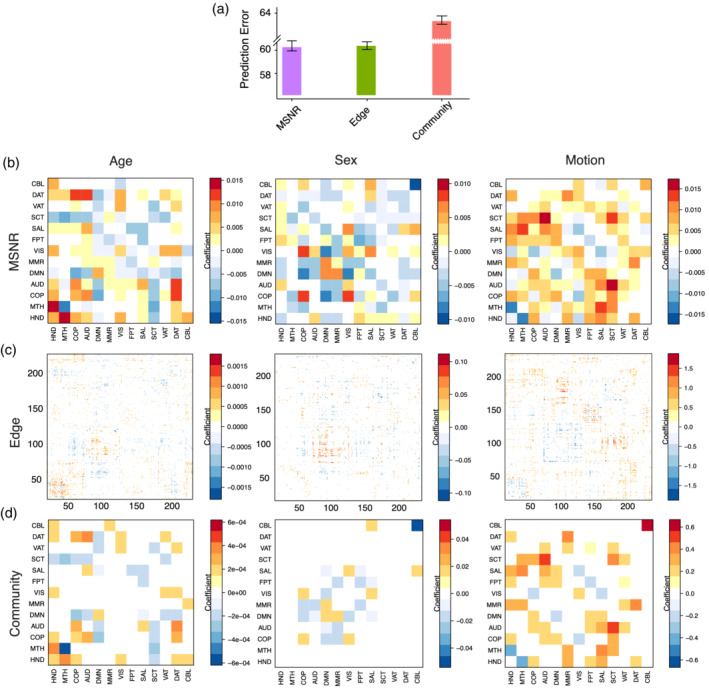
Brain networks are increasingly characterized at different scales, including summary statistics, community connectivity, and individual edges. While research relating brain networks to behavioral measurements has yielded many insights into brain-phenotype relationships, common analytical approaches only consider network information at a single scale. Here, we designed, implemented, and deployed Multi-Scale Network Regression (MSNR), a penalized multivariate approach for modeling brain networks that explicitly respects both edge- and community-level information by assuming a low rank and sparse structure, both encouraging less complex and more interpretable modeling. Capitalizing on a large neuroimaging cohort (n = 1, 051), we demonstrate that MSNR recapitulates interpretable and statistically significant connectivity patterns associated with brain development, sex differences, and motion-related artifacts. Compared to single-scale methods, MSNR achieves a balance between prediction performance and model complexity, with improved interpretability. Together, by jointly exploiting both edge- and community-level information, MSNR has the potential to yield novel insights into brain-behavior relationships.

Keywords: functional connectivity; multivariate analysis; network neuroscience.


Conflict of interest statement

R.T.S. received consulting income from Genentech/Roche and income for editorial duties from the American Medical Association and Research Square. All other authors declare no conflict of interest.

Figures

Figure 1
Figure 1
A schematic for Multi‐Scale Network Regression (MSNR). We developed a penalized multivariate approach for modeling brain networks that explicitly respects both edge‐ and community‐level information. We specified the MSNR model in Equation (2), which is visually represented here. Under the model, Ai is the connectivity matrix for the i‐th subject, Θ is a low‐rank matrix representing the mean connectivity across all subjects, Γ1, …, Γq are sparse matrices representing the community‐level connectivity associated with the covariates Xi1Xiq, and ɛi is the noise
Figure 2
Figure 2
A schematic for MSNR model training and evaluation. (a) MSNR is designed to study the brain connectivity‐phenotype relationship by taking into account both edge‐ and community‐level information. The model takes in an n × p × p matrix, where n is the number of subjects and p is the number of nodes in each symmetric adjacency matrix. The nodes belong to K communities, determined a priori. (b) 20% (n = 202) of the total sample (n = 1, 015) were randomly selected as the left‐out validation data. We conducted five‐fold cross‐validation to select the values of the tuning parameters λ1 and λ2. These two parameters represent the nuclear norm penalty on the mean connectivity matrix (Θ) and the l1 norm of the community‐level connectivity‐covariate relationship matrices (Γ1, …, Γq), respectively. This entire procedure was repeated five times. (c) The model was then trained using the tuning parameters determined in (b) on the rest 80% of the total data set (n = 813). Out‐of‐sample prediction error was then calculated as the Frobenius norm of the difference between the known and estimated connectivity matrices on the validation set. (d) We also evaluated the final model through a permutation procedure, where we disrupted the linkage between brain connectivity and covariate data to generate a null distribution of out‐of‐sample prediction error
Figure 3
Figure 3
Tuning parameter selection and model evaluation of MSNR in a large neuroimaging dataset. (a) We used five‐fold cross‐validation in each data partition to estimate the test prediction error associated with various values of λ1 and λ2. The matrix here represents the average error across five different data partition. (b) After the initial search, we repeated the search on a finer scale, focusing on the range of λ1 and λ2 indicated by the dashed‐line box. (c) As visualized, no boundary effect was observed in the grid search, revealing a smooth convex landscape for the objective, with warmer color indicating lower prediction error. (d) In each data partition, a permutation procedure showed that the MSNR fit to the original data significantly outperformed that to the permutated data with regards to prediction error on the validation set (p < .001). Consistent across five data partitions, the prediction error was consistently multiple standard deviations (z‐score) below the mean of the null distributions
Figure 4
Figure 4
MSNR describes meaningful individual differences in brain connectivity. Top row represents the coefficient matrix Γ for each of the three phenotypes modeled in the MSNR. (a) We counted the number of positive and negative coefficients related to age. More within‐community, rather than between‐community, connectivity strengthened as the age increased. Conversely, more between‐community, rather than within‐community, connectivity weakened over age. (b) Stronger within‐community than between‐community connectivity was more representative of male functional brain networks, whereas stronger between‐community than within‐community connectivity was more representative of female functional brain networks. (c) Coefficient for in‐scanner motion was negatively correlated with the average Euclidean distance between communities (p < .001)
Figure 5
Figure 5
MSNR achieves a balance between out‐of‐sample prediction performance and model interpretability compared to common single‐scale mass‐univariate approaches. (a) We compared out‐of‐sample prediction performance of MSNR to common single‐scale mass univariate analysis such as edge‐ and community‐based methods. Among the three methods, the community‐based approach had the highest prediction error. In contrast, MSNR had similar prediction error as the edge‐based approach. Error bar represents the standard deviation across five different data partitions. (b) MSNR coefficients in Γ describe the multivariate connectivity‐phenotype relationships. These correspond to age, sex, and in‐scanner motion, respectively. Results from single‐scale models were visualized in (c) for edge‐based and in (d) for community‐based approaches. Multiple comparisons were corrected using FDR

References

    1. Avants, B. B. , Tustison, N. J. , Song, G. , Cook, P. A. , Klein, A. , & Gee, J. C. (2011). A reproducible evaluation of ANTs similarity metric performance in brain image registration. NeuroImage, 54(3), 2033–2044. 10.1016/J.NEUROIMAGE.2010.09.025 - DOI - PMC - PubMed
    1. Avants, B. B. , Tustison, N. J. , Wu, J. , Cook, P. A. , & Gee, J. C. (2011). An open source multivariate framework for n‐tissue segmentation with evaluation on public data. Neuroinformatics, 9(4), 381–400. 10.1007/s12021-011-9109-y - DOI - PMC - PubMed
    1. Bassett, D. S. , & Siebenhühner, F. (2013). Multiscale network organization in the human brain In Multiscale analysis and nonlinear dynamics (pp. 179–204). Weinheim, Germany: Wiley‐VCH Verlag GmbH & Co. KGaA; 10.1002/9783527671632.ch07 - DOI
    1. Bassett, D. S. , & Sporns, O. (2017). Network neuroscience. Nature Neuroscience, 20(3), 353–364. 10.1038/nn.4502 - DOI - PMC - PubMed
    1. Bassett, D. S. , Xia, C. H. , & Satterthwaite, T. D. (2018). Understanding the emergence of neuropsychiatric disorders with network neuroscience. Biological Psychiatry: Cognitive Neuroscience and Neuroimaging, 3(9), 742–753. 10.1016/J.BPSC.2018.03.015 - DOI - PMC - PubMed

Publication types