

Review
doi: 10.1111/trf.15760.
Epub 2020 Mar 26.
Human ABO gene transcriptional regulation
Affiliations
- PMID: 32216153
- PMCID: PMC7187371
- DOI: 10.1111/trf.15760
Item in Clipboard
Review
Human ABO gene transcriptional regulation
Transfusion.
2020 Apr.
No abstract available
Conflict of interest statement
The authors have disclosed no conflicts of interest.
Figures
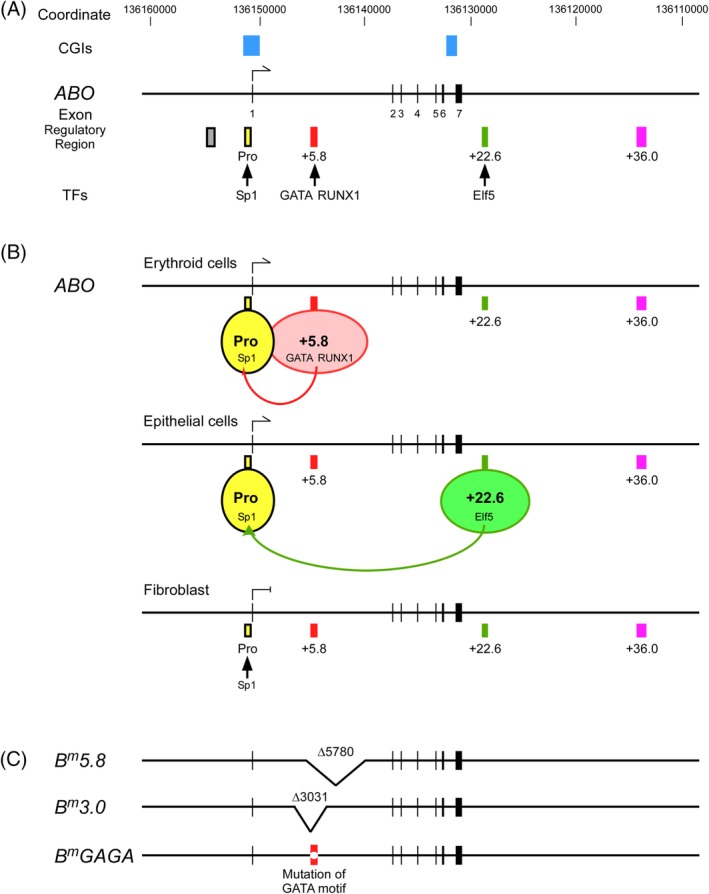
Schematics of transcriptional regulation of ABO expression. (A) A map of the 50‐kb region of genomic DNA from the upstream to downstream region of the human ABO gene. The diagram shows ABO gene Exons 1‐7 represented as vertical lines with coordinates in hg19 and CGIs. Below the diagram, regulatory regions including the proximal promoter, the erythroid cell‐specific regulatory element or the +5.8‐kb site, the epithelial cell‐specific regulatory element or the +22.6‐kb site, and the DHS region +36.0 are shown. Pro, promoter: +5.8, the +5.8‐kb site: +22.6, the +22.6‐kb site: +36.0, region +36.0. The colored boxes are represented as follows: yellow, the proximal promoter; light red, the +5.8‐kb site; dark green, the +22.6‐kb site; purple, region +36.0. Also, the CCAAT‐binding factor/NF‐Y enhancer region is shown as a gray box. Binding of TFs to individual regions is also indicated. (B) Schematic diagram of cell‐specific regulation of ABO expression. The top diagram indicates putative interaction of the proximal promoter with the +5.8‐kb site for ABO expression in erythroid cells. The second diagram from the top indicates putative interaction of the proximal promoter with the +22.6‐kb site for the ABO expression in epithelial cells. The third diagram from the top indicates the proximal promoter not interacting with either the +5.8‐kb site or the +22.6‐kb site without ABO expression in fibroblasts, in which neither GATA‐1,2 nor Elf5 is expressed. C. Schema of B
m
5.8, B
m
3.0, and B
m
GAGA. The deletions in B
m
5.8 and B
m
3.0 are each represented by a V‐shaped segment. Variant of the GATA motif in the +5.8‐kb site of B
m
GAGA is denoted as a clear circle in a red box. [Color figure can be viewed at http://wileyonlinelibrary.com ]
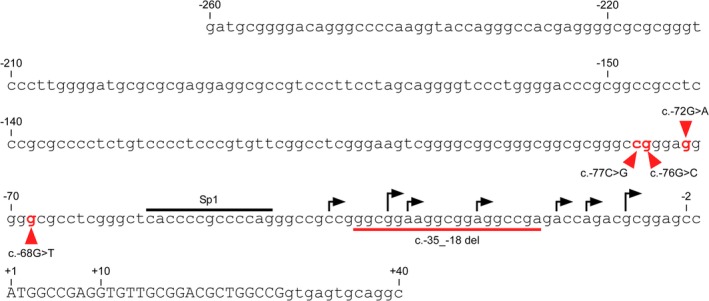
Nucleotide sequence of the 5′ ‐flanking region in ABO. The sequence is given in full, from position −260 to +40, relative to the translation start ATG site of ABO. The upper case letters denote the coding sequence of Exon 1, and the lower case letters the noncoding genomic sequence. High arrows above the sequence indicate the transcription initiation sites that were determined by 5′ ‐RACE using human pancreas cDNA by Yamamoto et al.,5 and low arrows denote the transcription initiation sites that were determined by in vitro erythroid culture of AC133−CD34+ cells.35 The proximal ABO promoter is located between −150 and −2 relative to the ATG translation start site.37, 38 The recognition motif for TF Sp1 is indicated by an overbar. Nucleotide substitutions at −77, −76, −72, and –68 are indicated in red, and the deletion between −35 and −18 is denoted by an underbar. [Color figure can be viewed at http://wileyonlinelibrary.com ]
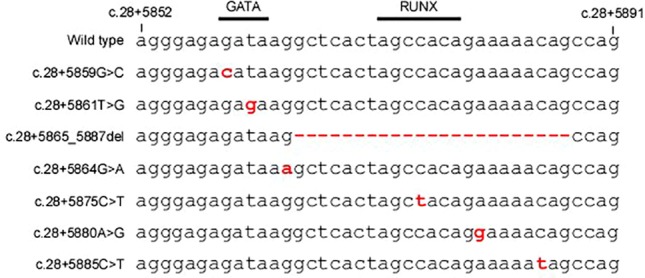
Alignment of variants within the +5.8‐kb site found in weak phenotypes. The wild‐type sequence between c.28 + 5852 and c.28 + 5891 in Intron 1 of ABO is shown at the top. The motifs for TFs GATA and RUNX1 are indicated by overbars. In alignment with the wild‐type sequence, the variants found within the +5.8‐kb site in weak phenotypes are shown. However, two reports have described variants in the coding exon of Am,46, 47 while a number of variants of exons and splicing sites are reportedly associated with A3 and B3.20 Those variants are described according to HGVS nomenclature using the nucleotide sequences of accession numbers NG_006669.1 and NM_020469.1 as a reference. Relationship between the variant descriptions according to the HGVS nomenclature and those in the original reports is shown in Table 1. Positions c.28 + 5852 and c.28 + 5891 correspond to +5881 and +5920 relative to the ABO translation start site, respectively, according to the nucleotide sequences of accession number NT_035014.4 as a reference, which was used in the original reports.30, 32, 33 [Color figure can be viewed at http://wileyonlinelibrary.com ]
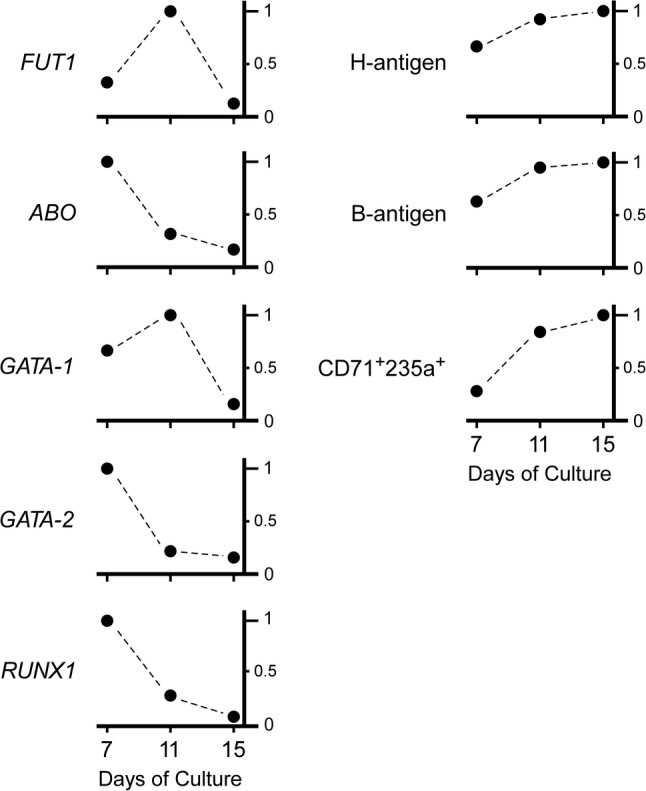
Schematic illustration of the expression of cell surface antigens and genes during the course of in vitro erythroid cell differentiation. The diagrams were constructed with the expression of genes such as FUT1, ABO, GATA‐1, GATA‐2, and RUNX1 as well as the cell surface expression of B antigen and H antigen 7 days, 11 days, and 15 days after in vitro erythroid cell differentiation from CD34+ cells reported previously.42 The time course of the relative expression of individual genes or antigens is indicated. The maximum gene expression or cell population showing antigen expression during erythroid differentiation was expressed as 1.0 on the vertical axis, whereas the relative expression ratios at other time points were calculated for individual genes and antigens. Also, changes in the proportions of cells expressing CD71 antigen and CD235 antigen that were not included in that report were added to the diagrams.
References
-
- Landsteiner K. Zur Kenntnis der antifermentativen lytischen and agglutinierenden Wirkung des Blutserums and der lymph. Zentralbl Bakteriol 1900;27:357‐63.
-
- Hakomori S. Antigen structure and genetic basis of histo‐blood groups A, B and O. their changes associated with human cancer. Biochim Biophys Acta 1999;1473:247‐66. - PubMed
-
- Yamamoto F. Molecular genetics of ABO. Vox Sang 2000;78:91‐103. - PubMed
-
- Yamamoto F. Cloning and regulation of the ABO genes. Transfus Med 2001;11:281‐94. - PubMed
-
- Yamamoto F, McNeill PD, Hakomori S. Genomic organization of human histo‐blood group ABO genes. Glycobiology 1995;5:51‐8. - PubMed
Publication types
MeSH terms
Substances
LinkOut - more resources
Full Text Sources
