. 2020 Apr 28;59(16):1565-1581.
doi: 10.1021/acs.biochem.0c00098. Epub 2020 Apr 7.

Fluorescence-Detected Conformational Changes in Duplex DNA in Open Complex Formation by Escherichia coli RNA Polymerase: Upstream Wrapping and Downstream Bending Precede Clamp Opening and Insertion of the Downstream Duplex

Fluorescence-Detected Conformational Changes in Duplex DNA in Open Complex Formation by Escherichia coli RNA Polymerase: Upstream Wrapping and Downstream Bending Precede Clamp Opening and Insertion of the Downstream Duplex

Raashi Sreenivasan et al. Biochemistry. .

Abstract

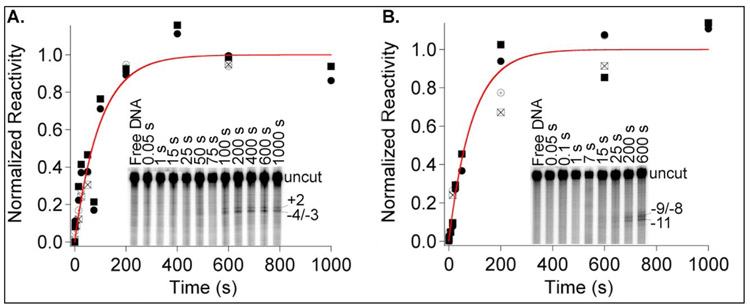
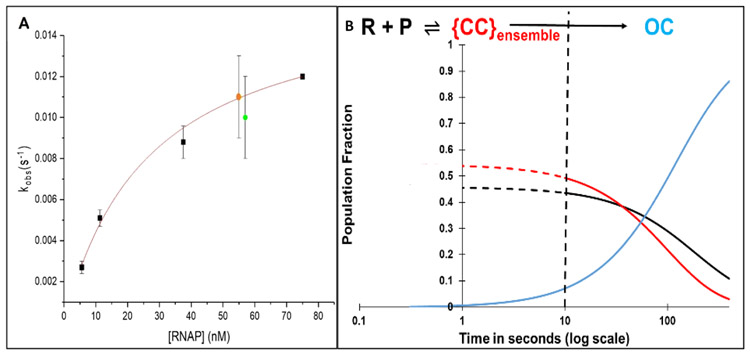
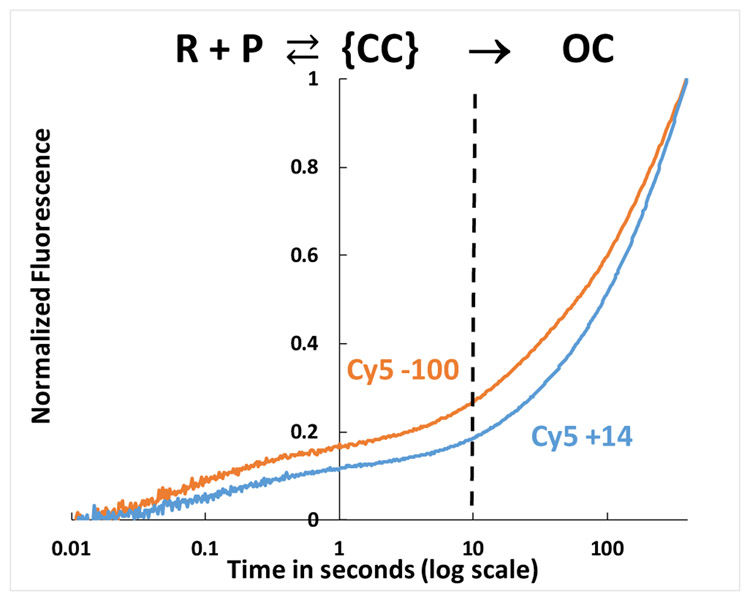
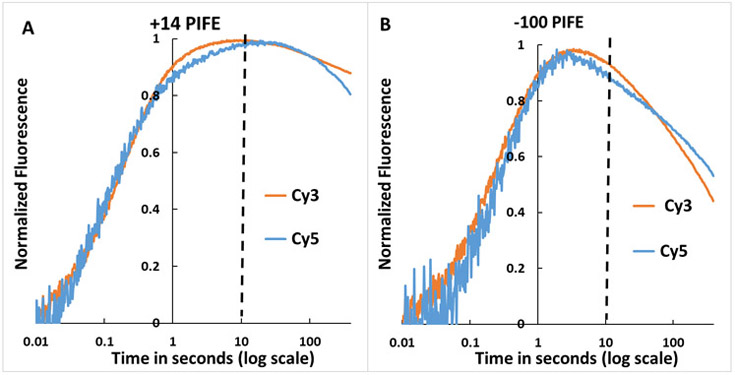
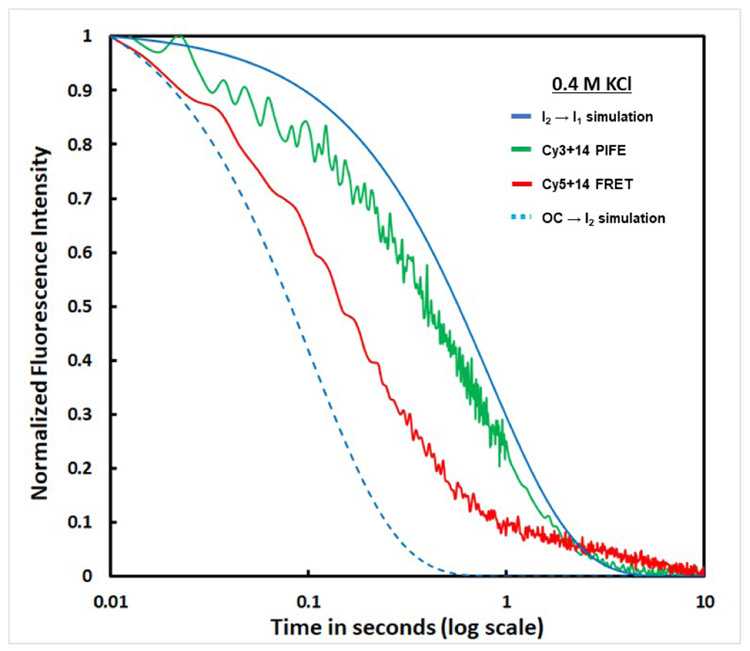
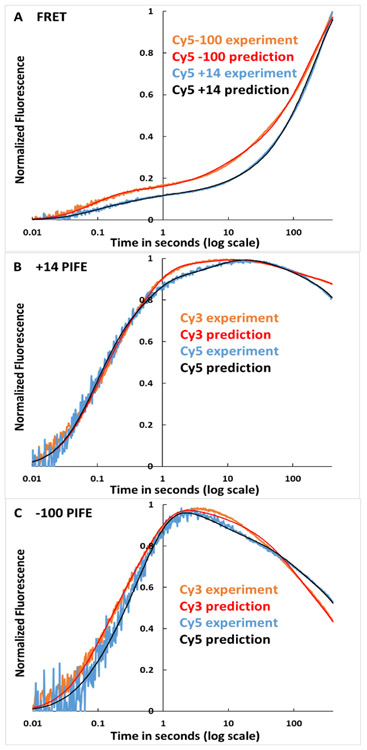
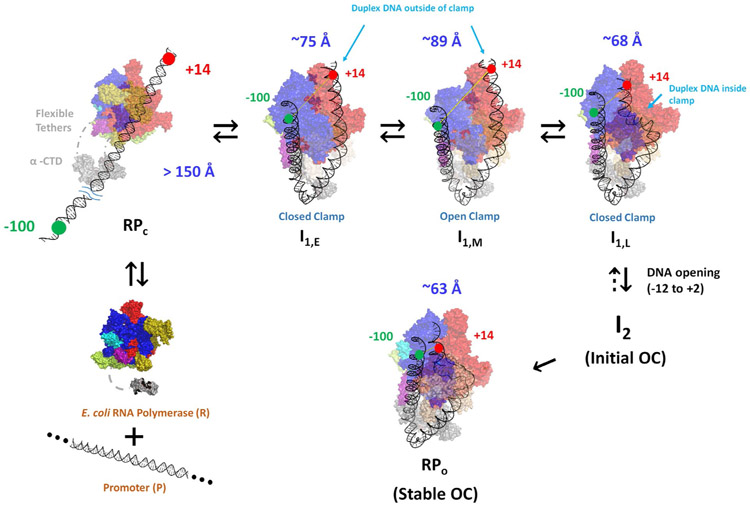
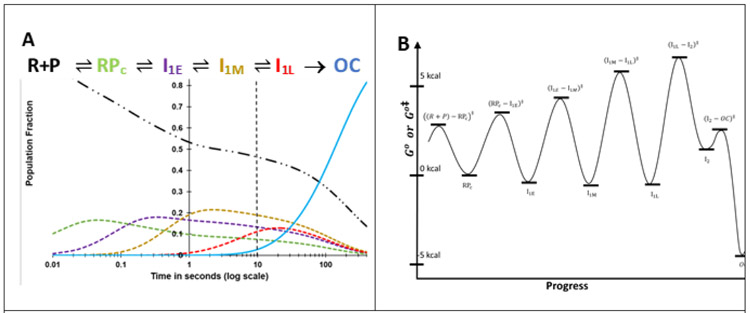
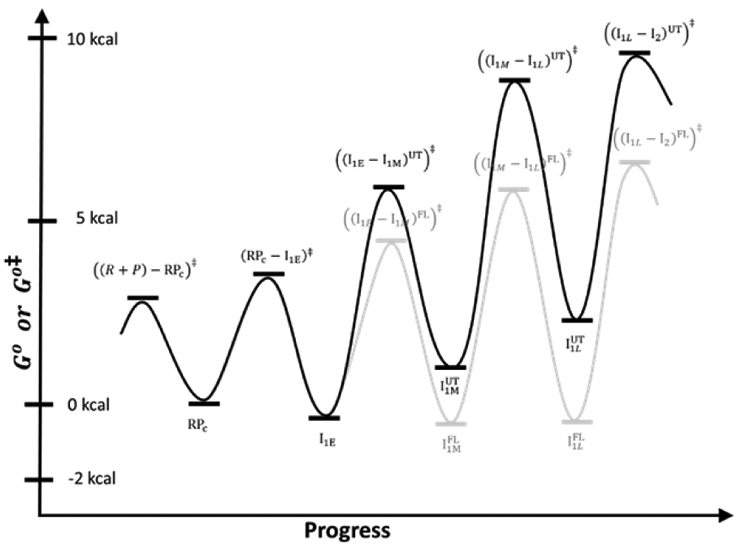
FRET (fluorescence resonance energy transfer) between far-upstream (-100) and downstream (+14) cyanine dyes (Cy3, Cy5) showed extensive bending and wrapping of λPR promoter DNA on Escherichia coli RNA polymerase (RNAP) in closed and open complexes (CC and OC, respectively). Here we determine the kinetics and mechanism of DNA bending and wrapping by FRET and of formation of RNAP contacts with -100 and +14 DNA by single-dye protein-induced fluorescence enhancement (PIFE). FRET and PIFE kinetics exhibit two phases: rapidly reversible steps forming a CC ensemble ({CC}) of four intermediates [initial (RPC), early (I1E), mid (I1M), and late (I1L)], followed by conversion of {CC} to OC via I1L. FRET and PIFE are first observed for I1E, not RPc. FRET and PIFE together reveal large-scale bending and wrapping of upstream and downstream DNA as RPC advances to I1E, decreasing the Cy3-Cy5 distance to ∼75 Å and making RNAP-DNA contacts at -100 and +14. We propose that far-upstream DNA wraps on the upper β'-clamp while downstream DNA contacts the top of the β-pincer in I1E. Converting I1E to I1M (∼1 s time scale) reduces FRET efficiency with little change in -100 or +14 PIFE, interpreted as clamp opening that moves far-upstream DNA (on β') away from downstream DNA (on β) to increase the Cy3-Cy5 distance by ∼14 Å. FRET increases greatly in converting I1M to I1L, indicating bending of downstream duplex DNA into the clamp and clamp closing to reduce the Cy3-Cy5 distance by ∼21 Å. In the subsequent rate-determining DNA-opening step, in which the clamp may also open, I1L is converted to the initial unstable OC (I2). Implications for facilitation of CC-to-OC isomerization by upstream DNA and upstream binding, DNA-bending transcription activators are discussed.


Figures

Figure 1.
Figure 1.. Kinetics of OC Formation Monitored by MnO4 Reactivity.
Fast (50 ms) MnO4 snapshots monitor the time course of opening individual thymines in OC formation after mixing excess RNAP (55 nM) with λPR promoter DNA (0.3 nM) at 19 °C. Representative gels are shown as insets. Kinetics of development of MnO4 reactivity are plotted for thymines on the nt strand (+2 (⊕, □***) and −4/−3 (☒***, □***) in panel A and for the t strand (−9/−8 (⊕, □***) and −11 (☒***, ) in panel B. Rate constants kobs for OC formation from these fits are the same within uncertainty (template strand kobs = 0.010 ± 0.002 s−1 ; non-template strand kobs = 0.011 ± 0.002 s−1). Times indicated are times after mixing RNAP with DNA at which the MnO4 snapshot was initiated. Gels were quantified and results normalized as described in Materials and Methods.
Figure 2.
Figure 2.. Panel A: Dependence of Rate Constant kobs for λPR OC Formation on RNAP Concentration in RNAP Excess.
First order rate constants kobs (Eq. 1) for OC formation in excess RNAP are plotted as a function of RNAP concentration. ∎*** : kobs values from filter binding assays at 20°C.4, , : kobs values from MnO4 footprinting of template and non-template strands, respectively at 19 °C (Fig 1). A fit of these data to hyperbolic Eq. 1 gives a composite {CC} binding constant K{CC} = (5 ± 1) x 107 M−1 and an isomerization rate constant kisom = 0.014 ± 0.003 s−1 for conversion of {CC} to OC. Panel B: Simulated Time Evolution of {CC} and OC Formation for FRET/PIFE Conditions (50 nM λPR Promoter and RNAP). Fractional populations of open complexes (OC) ──, closed complexes {CC} ──, and free promoter DNA ──, predicted from KCC and kisom as a function of time (log scale) assuming that the {CC} population equilibrates with free promoter DNA by 10 s. Dashed curves (– – - and– – -) assume equilibration of {CC} and P occurs in 1 s . The dashed vertical line at 10 s marks the onset of OC formation from the equilibrium mixture of {CC} and free promoter DNA determined from this simulation.
Figure 3.
Figure 3.. FRET-detected Bending and Wrapping of Promoter DNA by RNAP as {CC} Ensemble Advances and Forms the Stable OC.
Time course (log scale) of normalized FRET acceptor (Cy5) emission intensity after mixing Cy3-Cy5 dye-labelled λPR DNA (50 nM final) with E. coli RNAP (50 nM final) at 19°C and exciting FRET donor (Cy3) at 515nm. Both dye orientations are shown: Cy5(+14) Cy3(−100) ──, Cy3(+14) Cy5(−100) ──. The vertical dashed line at 10 s corresponds to the onset of OC formation at these conditions.
Figure 4.
Figure 4.. OC Formation Monitored by Single-Dye Cy3, Cy5 Fluorescence (PIFE) at Downstream (+14) and Far-Upstream (−100) Positions of λPR Promoter DNA.
Representative time courses (log scale) of normalized single-dye fluorescence (PIFE) of Cy3- or Cy5-labeled λPR DNA after mixing with RNAP (final concentrations 50 nM RNAP and λPR DNA) at 19 °C. +14 PIFE (Panel A) and −100 PIFE (Panel B) from Cy3 ── and Cy5 ──. Cy3 was excited at 515 nm and Cy5 at 610 nm. The vertical dashed line at 10 s is the predicted onset of OC formation (see Fig. 2B).
Figure 5.
Figure 5.. Unwrapping (detected by FRET) and Release of Downstream Contacts (detected by +14 PIFE) in OC Dissociation after an Upshift to 0.4 M KCl at 19 °C.
Representative time courses (log scale) of reductions in Cy5+14 acceptor FRET ── and Cy3+14 PIFE ── after destabilizing the 19 °C OC with 0.4 M KCl. Blue curves are simulations based on 0.4 M KCl rate constants, interpolated to 19 °C from results at 10 °C and 37 °C. These predict the time course of conversion of the initial OC to the unstable open intermediate I2 (OC → I2, rate constant kOC → I2 ≈ 9.7 s−1;– –) and subsequent DNA-closing, designated as I2 → I1 with rate constant kI2 → I1 = ~1.2 s−1; ──
Figure 6.
Figure 6.. Comparison of Predicted and Observed FRET and PIFE Kinetics of OC Formation at λPR Promoter.
Panel A: FRET data (Fig. 3) for Cy5-100 ── and Cy5+14 ──. Panel B: +14 PIFE data (Fig 4A) for Cy3 ── and Cy5 ──. Panel C: −100 PIFE data (Fig. 4B) for Cy3 ── and Cy5 ──. Predictions use rate constants and amplitudes in Table S4, obtained from fitting these data sets to Eq. S8 for Mechanism 2. For comparison, fits in SI Fig. S2 use average rate constants (Table 3) and amplitudes (Table S5) for the entire data sets.
Figure 7.
Figure 7.. Illustrations of Bending and Wrapping of Promoter DNA in CC Intermediates and OC from FRET Distances and PIFE Contacts.
Proposed mechanism of OC formation by RNAP determined by FRET and PIFE probes at −100 and +14 on promoter DNA. Unbound reactants (unbent promoter DNA, free RNAP) are at lower left. The absence of FRET and PIFE in the initial CC (RPC; upper left) shows that promoter DNA is not yet bent and wrapped on RNAP. Promoter DNA in subsequent CC intermediates (I1E, I1M, I1L) and in OC is highly bent and wrapped, making RNAP-DNA contacts at both −100 and +14. To explain the FRET distances and PIFE effects, we propose that concerted upstream bending/wrapping of upstream duplex DNA around the α subunits and onto the upper β’ clamp and bending of downstream duplex DNA onto the top of the β clamp in I1E (top left-center) trigger clamp opening to form I1M (top right-center). Clamp-opening triggers descent of the downstream duplex into the clamp and clamp-closing to form I1L (top right), which opens the initiation bubble to form the initial unstable OC (I2). Stabilization of I2 by binding of RNAP mobile elements to the downstream duplex yields the stable OC (bottom right).
Figure 8.
Figure 8.. A) Time Evolution of Populations of Unbound Promoter DNA, Intermediates in the {CC} Ensemble and the Stable λPR Promoter OC.
Simulations of population fractions of reactant, intermediates and product vs time (0.01 s to 400 s) for 5-step Mechanism 2 at 50 nM final concentrations of RNAP and promoter DNA, 19 ° C, using rate constants (Table 3) from analysis of FRET and PIFE kinetic data. Free promoter DNA — .. –; closed complex intermediates RPC – – –, I1,E – – – , I1M– – – , I1,L – – –, OC ──. The dashed vertical line at 10 s marks the onset of OC formation from the equilibrium mixture of {CC} and free promoter DNA predicted from filter binding and MnO4 kinetic data (Fig. 2B). B) Standard Free Energy (G°) vs. Progress Diagram for OC Formation with FL λPR Promoter DNA. G° values for CC intermediates and the stable OC are obtained from the equilibrium constants of Table 3 (ΔG° = −RT lnKi) and are expressed relative to RPC, which is arbitrarily assigned G° = 0 kcal. The G° value for I2 is obtained from K5 = k5/k−5, where k−5 = 1.2 s−1 (see Fig. 5, there designated kI2 → I1). Activation free energies Go relative to the same reference are calculated from the relationship ΔGo = − RTln(k/k max) where kmax is the (maximum) rate constant for the hypothetical situation ΔGo = 0. For purposes of illustration, we choose kmax= 5 x 10³ s−1 for all steps.
Figure 9.
Figure 9.. Proposed Standard Free Energies (G°***) vs. Progress Diagram for OC Formation with UT-47 λPR Promoter DNA and Comparison with FL λPR Promoter DNA.
Standard free energies (G°) for CC intermediates formed by UT-47 λPR promoter DNA are obtained from equilibrium constants as described in SI and are expressed relative to RPC, which is arbitrarily assigned G° = 0 kcal. Effects of truncation on the steps converting I1E to I1L are assumed to be entirely on the forward rate constant of these steps. Activation free energies Go relative to the same RPC reference are calculated from the relationship ΔGo = − RTln(k/kmax) where kmax, the (maximum) rate constant for the hypothetical situation ΔGo = 0, is arbitrarily assigned the value kmax = 5 x 10³ s−1 for all steps. Diagram from Fig. 8B for the full-length (FL) promoter is shown for comparison.

References

    1. McClure WR (1985) Mechanism and control of transcription initiation in prokaryotes, Annual Review of Biochemistry 54, 171–204. - PubMed
    1. Record MT Jr., Reznikoff WS, Craig ML, Mcquade KL and Schlax PJ. (1996) Escherichia coli RNA Polymerase (E sigma70), Promoters, and the Kinetics of the Steps of Transcription Initiation., Second Edition of Escherichia coli and Salmonella typhimurium: Cellular and Molecular Biology, 792–821.
    1. Saecker RM, Record MT Jr., and DeHaseth PL (2011) Mechanism of bacterial transcription initiation: RNA polymerase-promoter binding, isomerization to initiation-competent open complexes, and initiation of RNA synthesis, Journal of Molecular Biology 412, 754–771. - PMC - PubMed
    1. Ruff EF, Record MT Jr., and Artsimovitch I (2015) Initial events in bacterial transcription initiation, Biomolecules 5, 1035–1062. - PMC - PubMed
    1. Saecker RM, Tsodikov OV, Mcquade KL, Schlax PE Jr, Capp MW, and Record MT Jr. (2002) Kinetic studies and structural models of the association of E. coli σ70 RNA polymerase with the λPR promoter: large scale conformational changes in forming the kinetically significant intermediates, Journal of Molecular Biology 319, 649–671. - PubMed