. 2020 Jun 5;126(12):1723-1745.
doi: 10.1161/CIRCRESAHA.120.316443. Epub 2020 Mar 27.

Epigenetic Metabolic Reprogramming of Right Ventricular Fibroblasts in Pulmonary Arterial Hypertension: A Pyruvate Dehydrogenase Kinase-Dependent Shift in Mitochondrial Metabolism Promotes Right Ventricular Fibrosis

Affiliations

Epigenetic Metabolic Reprogramming of Right Ventricular Fibroblasts in Pulmonary Arterial Hypertension: A Pyruvate Dehydrogenase Kinase-Dependent Shift in Mitochondrial Metabolism Promotes Right Ventricular Fibrosis

Lian Tian et al. Circ Res. .

Abstract

Rationale: Right ventricular (RV) fibrosis in pulmonary arterial hypertension contributes to RV failure. While RV fibrosis reflects changes in the function of resident RV fibroblasts (RVfib), these cells are understudied.

Objective: Examine the role of mitochondrial metabolism of RVfib in RV fibrosis in human and experimental pulmonary arterial hypertension.

Methods and results: Male Sprague-Dawley rats received monocrotaline (MCT; 60 mg/kg) or saline. Drinking water containing no supplement or the PDK (pyruvate dehydrogenase kinase) inhibitor dichloroacetate was started 7 days post-MCT. At week 4, treadmill testing, echocardiography, and right heart catheterization were performed. The effects of PDK activation on mitochondrial dynamics and metabolism, RVfib proliferation, and collagen production were studied in RVfib in cell culture. Epigenetic mechanisms for persistence of the profibrotic RVfib phenotype in culture were evaluated. PDK expression was also studied in the RVfib of patients with decompensated RV failure (n=11) versus control (n=7). MCT rats developed pulmonary arterial hypertension, RV fibrosis, and RV failure. MCT-RVfib (but not left ventricular fibroblasts) displayed excess mitochondrial fission and had increased expression of PDK isoforms 1 and 3 that persisted for >5 passages in culture. PDK-mediated decreases in pyruvate dehydrogenase activity and oxygen consumption rate were reversed by dichloroacetate (in RVfib and in vivo) or siRNA targeting PDK 1 and 3 (in RVfib). These interventions restored mitochondrial superoxide and hydrogen peroxide production and inactivated HIF (hypoxia-inducible factor)-1α, which was pathologically activated in normoxic MCT-RVfib. Redox-mediated HIF-1α inactivation also decreased the expression of TGF-β1 (transforming growth factor-beta-1) and CTGF (connective tissue growth factor), reduced fibroblast proliferation, and decreased collagen production. HIF-1α activation in MCT-RVfib reflected increased DNMT (DNA methyltransferase) 1 expression, which was associated with a decrease in its regulatory microRNA, miR-148b-3p. In MCT rats, dichloroacetate, at therapeutic levels in the RV, reduced phospho-pyruvate dehydrogenase expression, RV fibrosis, and hypertrophy and improved RV function. In patients with pulmonary arterial hypertension and RV failure, RVfib had increased PDK1 expression.

Conclusions: MCT-RVfib manifest a DNMT1-HIF-1α-PDK-mediated, chamber-specific, metabolic memory that promotes collagen production and RV fibrosis. This epigenetic mitochondrial-metabolic pathway is a potential antifibrotic therapeutic target.

Keywords: DNA methyltransferase 1 (DNMT1); Warburg metabolism; dichloroacetate; hypoxia-inducible factor 1-alpha (HIF-1α); transforming growth factor beta-1 (TGF-β1).


Figures
Figure 1.
Figure 1.. PDK1 and PDK3 are the predominant isoforms upregulated in MCT-RVfib.
Compared to control, monocrotaline (MCT)-derived RV fibroblasts (MCT-RVfib) display upregulation in glucose transporter 1 (Glut1), pyruvate dehydrogenase kinase (PDK) isoform 1 & 3, and phosphorylated pyruvate dehydrogenase (p-PDH). Both sodium dichloroacetate (DCA) and small interfering RNA (siRNA) targeting PDK isoforms 1 & 3 (siPDK1&3) treatments reduce PDK1, PDK3 and p-PDH in MCT-RVfib. (A) mRNA expression of Glut1 (P=0.027 by student’s t-test; n=9 and n=8 for PBS and MCT groups, respectively) and 4 isoforms of PDK (P=0.015, 0.12, 0.01 and 0.49 by student’s t-test for comparison in PDK1, PDK2, PDK3 and PDK4, respectively; n=9 for PDK1, PDK2 and PDK3 of PBS groups and n=8 for the other groups). (B) Immunoblotting of PDK1 and PDK3 with treatment of DCA or siPDK1&3 (The sample sizes for PBS, MCT and MCT+DCA groups are: 7, 8 and 4 respectively for measurement of PDK1, and 6, 8 and 4 respectively for measurement of PDK3. The sample sizes for MCT+siCON (control siRNA) and MCT+siPDK1&3 are: both 5 for measurement of PDK1 and both 9 for measurement of PDK3. P=0.0068 and 0.014 by student’s t-test for MCT vs. PBS and MCT+DCA vs. MCT respectively in PDK1; P=0.001 and 0.049 by student’s t-test for MCT vs. PBS and MCT+DCA vs. MCT respectively in PDK3; P=0.0093 and 0.042 by paired t-test for MCT+siPDK1&3 vs. MCT+siCON in PDK1 and PDK3, respectively). (C) Immunoblotting of p-PDH with DCA or siPDK1&3 treatment (n=6, 8 and 8 for PBS, MCT and MCT+DCA groups, respectively. n=4 for both MCT+siCON and MCT+siPDK1&3 groups. P=0.013 and 0.0003 by student’s and paired t-test respectively for MCT vs. PBS and MCT+DCA vs. MCT, respectively. P=0.001 by paired t-test for MCT+siPDK1&3 vs. MCT+siCON). siCON, control siRNA. *, P<0.05 and **, P<0.01 versus PBS group; $, P<0.05, $ $, P<0.01 and $ $ $, P<0.001 versus the corresponding vehicle control group (MCT or MCT+siCON group). Immunoblotting images were taken with Chemidoc MP Imaging System and analyzed with ImageJ.
Figure 2.
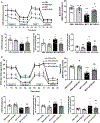
Figure 2.. Warburg Metabolism in MCT-RVfib is mediated by PDK1&3
Monocrotaline (MCT)-derived RV fibroblasts (MCT-RVfib) display lower oxygen consumption rate (OCR), higher glucose consumption and lactate production, and a lower ratio of OCR to extracellular acidification rate (ECAR) (OCR/ECAR), compared to control. Both sodium dichloroacetate (DCA) and small interfering RNA (siRNA) targeting pyruvate dehydrogenase kinase (PDK) isoforms 1&3 (siPDK1&3) treatments increase OCR and OCR/ECAR, and reduce glucose consumption and lactate production in MCT-RVfib. Note that the glucose consumption and lactate production are lower in the cells with DCA treatment than that with siPDK1&3 treatment. This likely reflects that DCA was replaced daily as DCA-treated cells received new culture medium daily whereas the culture medium for siRNA-treated cells was not changed during the course of the protocol. Representative OCR measurement via Seahorse XFe24 Extracellular Flux Analyzer and summary of basal OCR, OCR/ECAR, glucose consumption and lactate production in cell culture medium with treatment of (A) DCA and (B) siPDK1&3. (A) The sample sizes for PBS, PBS+DCA, MCT, MCT+DCA groups are: 8, 6, 8 and 7 in basal OCR measurement respectively, 7, 5, 6 and 6 in OCR/ECAR measurement respectively, 6, 6, 8 and 6 in the measurement of glucose consumption respectively, and 6 for all the groups in the measurement of lactate production. P values by student’s or paired t-test for PBS+DCA vs. PBS, MCT vs. PBS and MCT+DCA vs. MCT are 0.98, 0.0002 and 0.013 respectively in basal OCR, 0.40, 0.012 and 0.0076 respectively in OCR/ECAR, 0.18, 0.043 and 0.031 respectively in glucose consumption, and 0.0015, 0.0028 and 0.0057 respectively in lactate production. (B) The sample sizes for PBS+siCON, PBS+siPDK1&3, MCT+siCON, MCT+siPDK1&3 groups are: 6, 6, 7 and 7 in both basal OCR and OCR/ECAR measurements respectively, 6, 6, 8, 6 for in the measurement of glucose consumption, and 6 for all the groups in the measurement of lactate production. P values by student’s or paired t-test for PBS+siPDK1&3 vs. PBS+siCON, MCT+siCON vs. PBS+siCON and MCT+siPDK1&3 are: 0.94, 0.0001 and 0.016 respectively in basal OCR, 0.44, 0.025 and 0.0094 respectively in OCR/ECAR, 0.42, 0.041 and 0.037 respectively in glucose consumption, and 0.11, 0.043 and 0.0065 respectively in lactate production. FCCP, carbonyl cyanide 4-(trifluoromethoxy)phenylhydrazone; AA, antimycin A; Rot, rotenone; siCON, control siRNA. *, P<0.05, **, P<0.01 and ***, P<0.001 versus PBS or PBS+siCON group; $, P<0.05, $ $, P<0.01 and $ $ $, P<0.001 versus the corresponding vehicle control group (MCT or MCT+siCON group).
Figure 3.
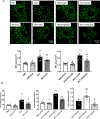
Figure 3.. Increased mitochondrial fission and proliferation in MCT-RVfib are mediated by PDK1&3
Monocrotaline (MCT)-derived RV fibroblasts (MCT-RVfib) display excess mitochondrial fission and increased proliferation rate compared to control. Both sodium dichloroacetate (DCA) and small interfering RNA (siRNA) targeting pyruvate dehydrogenase kinase (PDK) isoforms 1 & 3 (siPDK1&3) treatments inhibit mitochondrial fission and decrease proliferation rate in MCT-RVfib, and only siPDK3 (not siPDK1) reduced proliferation rate in MCT-RVfib. (A) Representative mitochondrial network stained with MitoTracker™ Green FM in RVfib with DCA or siPDK1&3 treatment and the summary of mitochondrial fragmentation count (MFC) (n=8, 5, 10 and 5 for PBS, PBS+DCA, MCT and MCT+DCA groups, respectively. P=0.56, 0.0000035 and 0.0093 by student’s t-test for PBS+DCA vs. PBS, MCT vs. PBS and MCT+DCA vs. MCT, respectively. n=6 for PBS+siCON, PBS+siPDK1&3, MCT+siCON and MCT+siPDK1&3 groups. P=0.43 and 0.0025 by paired t-test for PBS+siPDK1&3 vs. PBS+siCON and MCT+siPDK1&3 vs. MCT+siCON, respectively. P=0.0005 by student’s t-test for MCT+siCON vs. PBS+ siCON). (B) Summary of proliferation rates (n=6 for PBS, PBS+DCA, MCT and MCT+DCA groups and n=5 for the other groups. P=0.07 and 0.03 by paired t-test for PBS+DCA vs. PBS and MCT+DCA vs. MCT, respectively. P=0.0022 by student’s t-test for MCT vs. PBS. P=0.81 and 0.0056 by paired t-test for PBS+siPDK1&3 vs. PBS+siCON and MCT+siPDK1&3 vs. MCT+siCON, respectively. P=0.0079 by student’s t-test for MCT+siCON vs. PBS+ siCON. P= 0.006 and 0.049 by ANOVA followed by Tukey’s post hoc test for MCT+siPDK1 vs. MCT+siCON and MCT+siPDK3 vs. MCT+siCON, respectively). siCON, control siRNA. **, P<0.01, and ***, P<0.001 versus PBS or PBS+siCON group; $, P<0.05 and $ $, P<0.01 versus the corresponding vehicle control group (MCT or MCT+siCON group). Immunofluorescent images were taken with a Leica SP8 confocal, laser-scanning microscope and analyzed with ImageJ.
Figure 4.
Figure 4.. Increased production of type III collagen in MCT-RVfib is mediated by PDK1&3
Monocrotaline (MCT)-derived RV fibroblasts (MCT-RVfib) have greater collagen production in type III compared to control. Both sodium dichloroacetate (DCA) and small interfering RNA (siRNA) targeting pyruvate dehydrogenase kinase (PDK) isoforms 1 & 3 (siPDK1&3) treatments reduce type III collagen production in MCT-RVfib, and only siPDK1 (not siPDK3) reduced type I and III collagen production. (A) mRNA expression of type I and III collagen (n=9 and 8 for PBS and MCT groups, respectively. P=0.072 and 0.045 by student’s t-test for MCT vs. PBS in type I collagen and type III collagen, respectively); (B) Immunoblotting of type I and III collagen (n=3 per group. P=0.11 and 0.024 by student’s t-test for MCT vs. PBS in collagen I and collagen III, respectively); (C) Immunoblotting of type III collagen in RVfib treated with DCA or siPDK1&3 (n=6, 8, 8, 5 and 5 for PBS, MCT, MCT+DCA, MCT+siCON and MCT+siPDK1&3 groups, respectively. P=0.0007 and 0.016 by student’s or paired t-test for MCT vs. PBS and MCt+DCA vs. MCT respectively. P=0.0002 by paired t-test for MCT+siPDK1&3 vs. MCT+siCON); (D) Effects of siPDK1 and siPDK3 individually on type I and III collagen mRNA in a MCT-RVfib cell line with triplicate measurement using qRT-PCR analysis (P=0.0009 and 0.0005 by ANOVA followed by Tukey’s post hoc test for MCT+siPDK1 vs. MCT+siCON and MCT+siPDK3 vs. MCT+siCON respectively in type I collagen; P=0.0002 and 0.018 with ANOVA followed by Tukey’s post hoc test for MCT+siPDK1 vs. MCT+siCON and MCT+siPDK3 vs. MCT+siCON respectively in type III collagen;). siCON, control siRNA. *, P<0.05, **, P<0.01, and ***, P<0.001versus PBS group; $, P<0.05, $ $, P<0.01, and $ $ $, P<0.001 versus the corresponding vehicle control group (MCT or MCT+siCON group). Immunoblotting images were taken with Chemidoc MP Imaging System and analyzed with ImageJ.
Figure 5.
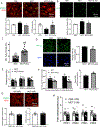
Figure 5.. Impaired mitochondrial redox signaling, Drp1 activation and production of fibrogenic cytokines in MCT-RVfib are mediated by PDK1&3.
Compared to control, monocrotaline (MCT)-derived RV fibroblasts (MCT-RVfib) display decrease in the production of mitochondrial (Mito.) superoxide (MitoSOX) and H2O2 and increases in the intensity of nuclear hypoxia-inducible factor 1-alpha (HIF-1α), phosphorylated dynamin-related protein 1 at Serine 616 (p-Drp1S616), transforming growth factor beta-1 (TGF-β1), and connective tissue growth factor (CTGF). All these changes are reversed by both sodium dichloroacetate (DCA) and small interfering RNA (siRNA) targeting pyruvate dehydrogenase kinase (PDK) isoforms 1 & 3 (siPDK1&3) treatments. (A) Summary of fluorescence intensity of MitoSOX (n=72, 75, 75, 80 and 42 cells from PBS, MCT, MCT+DCA, MCT+siCON and MCT+siPDK1&3 groups respectively were analyzed. P=8.8×10⁻¹⁰, 0.021 and 0.0000033 by ANOVA followed by Tukey’s post hoc test for MCT vs. PBS, MCT+DCA vs. MCT and MCT+siDPK1&3 vs. MCT+siCON, respectively) and mitochondrial H2O2 (n=12, 26 and 19 cells from PBS, MCT and MCT+DCA groups respectively were analyzed. P=4.4×10⁻⁸ and 0.0002 by ANOVA followed by Tukey’s post hoc test for MCT vs. PBS and MCT+DCA vs. MCT, respectively). (B) Representative immunofluorescent images of HIF-1α in RVfib and summary of the fluorescence intensity in the nuclei (more than 95 cells from 3 cell lines per group were analyzed; P=0.0003 by student’s t-test). (C) mRNA expression of HIF-1α in MCT-RVfib treated with DCA or siPDK1&3 (n=6 for both MCT and MCT+DCA groups. n=5 for both MCT+siCON and MCT+siPDK1&3 groups. P=0.025 and 0.0019 by paired t-test for MCT+DCA vs. MCT and MCT+siPDK1&3 vs. MCT+siCON, respectively). (D) Immunoblotting of p-Drp1S616 (n=3, 4, 4, 4, and 4 for PBS, MCT, MCT+DCA, MCT+siCON and MCT+siPDK1&3 groups, respectively. P=0.017 and 0.047 by student’s or paired t-test for MCT vs. PBS and MCT+DCA vs. MCT, respectively. P=0.2 by paired t-test for MCT+siPDK1&3 vs. MCT+siCON). (E) Immunoblotting of TGF-β1 and CTGF (n=3, 4, 4, 4 and 4 for PBS, MCT, MCT+DCA, MCT+siCON and MCT+siPDK1&3 groups, respectively. P=0.0033 and 0.0004 by student’s or paired t-test for MCT vs. PBS and MCT+DCA vs. MCT respectively in TGF-β1. P=0.049 and 0.011 by student’s or paired t-test for MCT vs. PBS and MCT+DCA vs. MCT respectively in CTGF. P=0.029 and 0.0033 by paired t-test for MCT+siPDK1&3 vs. MCT+siCON in TGF-β1 and CTGF, respectively). siCON, control siRNA. *, P<0.05, **, P<0.01 and ***, P<0.001 versus PBS group; $, P<0.05, $ $, P<0.01 and $ $ $, P<0.001 versus the corresponding vehicle control group (MCT or MCT+siCON group). Immunoblotting images were taken with Chemidoc MP Imaging System and analyzed with ImageJ. Immunofluorescent images were taken with a Leica SP8 confocal, laser-scanning microscope and analyzed with ImageJ.
Figure 6.
Figure 6.. Increased DNA methyltransferase activity underlies the chamber-specific changes in mitochondrial redox signaling, HIF-1α activation and PDK expression in MCT-RVfib
Compared to control, monocrotaline (MCT)-derived RV fibroblasts (MCT-RVfib) display increases in the expression of DNA methyltransferase 1 (DNMT1) and 5-methylcytosin (5-mc) and a decrease in the expression of superoxide dismutase 2 (SOD2). Treatment with 5-Azacytidine (5-Aza) in MCT-RVfib restores these changes, increases the production of mitochondrial (Mito.) H2O2, reduces nuclear hypoxia-inducible factor 1-alpha (HIF-1α), and restores the mitochondrial metabolism. Whereas in left ventricular fibroblasts (LVfib) there was no difference in the expression of DNMT1, SOD2 or pyruvate dehydrogenase kinase (PDK) between MCT and control groups. (A) Representative immunofluorescent images of DNMT1 and SOD2 and summary of the fluorescence intensity (more than 90 cells from 3 cell lines per group were analyzed; P=0.0039 by student’s t-test for MCT vs. PBS in DNMT1 and P=0.017 by paired t-test for MCT+5-Aza vs. MCT in DNMT1. P=0.012 by student’s t-test for MCT vs. PBS in SOD2 and P=0.043 by paired t-test for MCT+5-Aza vs. MCT in SOD2). (B) Representative immunofluorescent images of 5-mc in RVfib and summary of the fluorescence intensity in the nuclei (more than 120 cells from 3 cell lines in PBS group and 4 cell lines in MCT and MCT+5-Aza groups were analyzed. P=0.000052 by student’s t-test for MCT vs. PBS and P=0.029 by paired t-test for MCT+5-Aza vs. MCT). (C) Summary of the fluorescence intensity of mitochondrial H2O2 (n=19 cells per group were analyzed. P=6.3×10⁻⁸ by student’s t-test). (D) Representative immunofluorescent images of HIF-1α in MCT-RVfib treated with 5-Azacytidine and summary of the fluorescence intensity in the nuclei (more than 80 cells from 4 cell lines per group were analyzed. P=0.038 by paired t-test). (E) Summary of immunoblotting data on the expression of PDK isoform 1 (PDK1), PDK3, the phosphorylated pyruvate dehydrogenase (p-PDH)/total PDH ratio (n=5 per group. P=0.019, 0.67 and 0.0062 by paired t-test in PDK1, PDK3 and p-PDH, respectively). (F) Summary of glucose consumption (n=5 per group. P=0.026), lactate production (n=5 per group. P=0.0026) and oxygen consumption rate (OCR) (n=3 per group. P=0.0776). Paired t-test was used. (G) Representative immunofluorescent images of DNMT1 and SOD2 in LVfib and summary of the fluorescence intensity (n = 5 per group. P=0.47 and 0.62 by student’s t-test for MCT vs. PBS LVfib in DNMT1 and SOD2, respectively). (H) mRNA expression of 4 PDK isoforms in LVfib (P=0.59, 0.33, 0.64 and 0.17 by student’s t-test for PDK1, PDK2, PDK3 and PDK4, respectively. n=7 for MCT PDK2 and PDK3 groups, and n=8 for the other groups). *, P<0.05, **, P<0.01 and ***, P<0.001 versus PBS group; $, P<0.05, $ $, P<0.01 and $ $ $, P<0.001 versus the MCT group. Immunofluorescent images were taken with a Leica SP8 confocal, laser-scanning microscope and analyzed with ImageJ.
Figure 7.
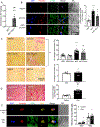
Figure 7.. DCA is effective in reducing phospho-PDH expression in vivo and PDK1 is the predominant isoform in the fibrotic RVs of patients with PAH and RVF
Monocrotaline (MCT) rats developed greater right ventricular (RV) fibrosis and had higher phosphorylated pyruvate dehydrogenase (p-PDH) levels in RV fibroblasts (RVfib) than control, and treatment with sodium dichloroacetate (DCA) reduced RV fibrosis and p-PDH levels in RVfib in MCT rats. In contrast, left ventricles (LVs) from MCT rats did not develop greater fibrosis than control. RV from pulmonary arterial hypertension (PAH) patients displayed greater fibrosis and had higher expression of pyruvate dehydrogenase kinase isoform 1 (PDK1) in fibroblasts than control. (A) Summary of DCA levels measured using mass spectrometry in RVs from MCT (n=6) and DCA-treated MCT (n=8) rats (P=0.0076 by student’s t-test). (B) Representative immunofluorescent images of p-PDH in RV tissues and summary of fluorescence intensity of vimentin-positive cells, i.e., RVfib (n=5 per group. P=0.0007 and 0.029 by ANOVA followed by Tukey’s post hoc test for MCT vs. PBS and MCT+DCA vs. MCT, respectively). (C) Representative picrosirius red-stained images of RVs or LVs from rats and summary of collagen area fraction (n=12, 5, 14 and 10 RVs from PBS, PBS+DCA, MCT, MCT+DCA groups, respectively. n=6 LVs from PBS and MCT groups. P=0.99, 0.0000010 and 0.04 by ANOVA followed by Tukey’s post hoc test for PBS+DCA vs. PBS, MCT vs. PBS and MCT+DCA vs. MCT in RV collagen area fraction, respectively. P=0.71 by student’s t-test for MCT vs. PBS in LV collagen area fraction). (D) Representative picrosirius red-stained images of RVs from patients and summary of collagen area fraction (n=7 and 11 for control and PAH patients, respectively. P=0.000052 by student’s t-test for PAH vs. control). (E) Representative immunofluorescent images of PDK1 and PDK3 in vimentin-positive cells (RVfib) (n=7 per group. P=0.049 and 0.39 by student’s t-test in PDK1 and PDK3, respectively). DIC, differential interference contrast. *, P<0.05 and ***, P<0.001 versus control (or PBS) group; $, P<0.05 and $ $, P<0.01 versus the MCT group. Immunofluorescent images were taken with a Leica SP8 confocal, laser-scanning microscope and analyzed with ImageJ. Histology images were taken with a Leica digital color camera attached to a Leica DM4 microscope and analyzed with a Leica software (LAS V4.7).
Figure 8.
Figure 8.. The PDK inhibitor dichloroacetate is effective in reversing MCT RVF in vivo
Monocrotaline (MCT) rats developed right ventricular (RV) hypertrophy, dysfunction and pulmonary hypertension, and treatment with sodium dichloroacetate (DCA) improved RV function in MCT rats. (A) Summary of mean pulmonary artery pressure (mPAP) and RV systolic and end-diastolic pressures (RVSP and RVEDP, respectively) (The sample sizes for PBS, PBS+DCA, MCT and MCT+DCA groups are: 9, 6, 7, and 7 respectively in mPAP measurement, and 10, 6, 11 and 11 respectively in both RVSP and RVEDP measurements. P-values for PBS+DCA vs. PBS, MCT vs. PBS and MCT+DCA vs. MCT are: 0.98, 7.9×10⁻⁹ and 3.6×10⁻⁶ respectively in mPAP, 0.98, 7.1×10⁻¹¹ and 0.0006 respectively in RVSP, and 0.98, 0.000027 and 0.015 respectively in RVEDP). (B) Summary of hemodynamic measurements via echocardiography on pulmonary artery acceleration time (PAAT), RV free wall (RVFW) thickness, RVFW thickening, tricuspid annular plane systolic excursion (TAPSE) and cardiac output (CO) (The sample sizes for PBS, PBS+DCA, MCT and MCT+DCA groups are: 13, 7, 23 and 16 respectively in PAAT measurement, 14, 6, 23 and 17 respectively in RVFW thickness measurement, 13, 6, 23 and 17 respectively in RVFW thickening measurement, 14, 7, 23 add 15 respectively in TAPSE measurement, and 12, 6, 23 and 16 respectively in CO measurement. P-values for PBS+DCA vs. PBS, MCT vs. PBS and MCT+DCA vs. MCT are 0.63, 3.6×10⁻¹² and 0.000018 respectively in TAPSE, 0.96, 7.4×10⁻¹² and 0.000054 respectively in RVFW thickness, and 0.93, 1.6×10⁻¹⁴ and 0.00031 respectively in RVFW thickening). (C) Summary of Fulton index [ratio of RV weight to left ventricle plus septum weight (LV+S), i.e., RV/LV+S] and treadmill distance (The sample sizes for PBS, PBS+DCA, MCT and MCT+DCA groups are: 9, 6, 16 and 15 respectively in RV/LV+S measurement and 9, 5, 13 and 15 respectively in treadmill distance measurement. P-values for PBS+DCA vs. PBS, MCT vs. PBS and MCT+DCA vs. MCT are: 0.99, 8.2×10⁻¹³ and 0.0000018 respectively in RV/LV+S, and 0.97, 8.3×10⁻¹⁰ and 0.039 respectively in CO). (D) RV-PA coupling quantified by TAPSE/mPAP and RVFW thickening/mPAP (The sample sizes for PBS, PBS+DCA, MCT and MCT+DCA groups are 7, 6, 6 and 7 respectively. P-values for PBS+DCA vs. PBS, MCT vs. PBS and MCT+DCA vs. MCT are: 0.95, 9.8×10⁻⁹ and 0.07 respectively in TAPSE/mPAP, and 0.99, 3.6×10⁻⁶ and 0.1 respectively in RVFW thickening/mPAP. P=0.001 and 0.0027 by student’s t-test for MCT+DCA vs. MCT in TAPSE/mPAP and RVFW thickening/mPAP, respectively). (E) Proposed mechanistic pathway for the contribution of DNA methylation, pyruvate dehydrogenase kinase (PDK) and the associated Warburg metabolic phenotype to RV fibroblasts function in pulmonary arterial hypertension (PAH). DNMT1, DNA methyltransferase 1; SOD2, superoxide dismutase 2; HIF-1α, hypoxia-inducible factor 1-alpha; PDH, pyruvate dehydrogenase; siPDK1&3, small interfering RNA targeting PDK isoforms 1&3, TGF-β1, transforming growth factor beta-1; CTGF, connective tissue growth factor. The Tukey’s post hoc test after ANOVA was performed. ***, P<0.001 versus PBS group; $, P<0.05, $ $, P<0.01 and $ $ $, P<0.001 versus the MCT group.

References

    1. Sandoval J, Bauerle O, Palomar A, Gomez A, Martinez-Guerra ML, Beltran M and Guerrero ML. Survival in primary pulmonary hypertension. Validation of a prognostic equation. Circulation. 1994;89:1733–44. - PubMed
    1. D’Alonzo GE, Barst RJ, Ayres SM, Bergofsky EH, Brundage BH, Detre KM, Fishman AP, Goldring RM, Groves BM, Kernis JT and et al. Survival in patients with primary pulmonary hypertension. Results from a national prospective registry. Ann Intern Med. 1991;115:343–9. - PubMed
    1. Campo A, Mathai SC, Le Pavec J, Zaiman AL, Hummers LK, Boyce D, Housten T, Champion HC, Lechtzin N, Wigley FM, Girgis RE and Hassoun PM. Hemodynamic predictors of survival in scleroderma-related pulmonary arterial hypertension. Am J Respir Crit Care Med. 2010;182:252–60. - PMC - PubMed
    1. Ghio S, Klersy C, Magrini G, D’Armini AM, Scelsi L, Raineri C, Pasotti M, Serio A, Campana C and Vigano M. Prognostic relevance of the echocardiographic assessment of right ventricular function in patients with idiopathic pulmonary arterial hypertension. International journal of cardiology. 2010;140:272–8. - PubMed
    1. Humbert M, Sitbon O, Chaouat A, Bertocchi M, Habib G, Gressin V, Yaici A, Weitzenblum E, Cordier JF, Chabot F, et al. Survival in patients with idiopathic, familial, and anorexigen-associated pulmonary arterial hypertension in the modern management era. Circulation. 2010;122:156–63. - PubMed

Publication types

MeSH terms

Substances