Review
. 2020 May 1;318(5):H1139-H1158.
doi: 10.1152/ajpheart.00705.2019. Epub 2020 Mar 27.

Hemodynamic assessment of diastolic function for experimental models

Affiliations
Review

Hemodynamic assessment of diastolic function for experimental models

Leslie M Ogilvie et al. Am J Physiol Heart Circ Physiol. .

Abstract

Traditionally, the evaluation of cardiac function has focused on systolic function; however, there is a growing appreciation for the contribution of diastolic function to overall cardiac health. Given the emerging interest in evaluating diastolic function in all models of heart failure, there is a need for sensitivity, accuracy, and precision in the hemodynamic assessment of diastolic function. Hemodynamics measure cardiac pressures in vivo, offering a direct assessment of diastolic function. In this review, we summarize the underlying principles of diastolic function, dividing diastole into two phases: 1) relaxation and 2) filling. We identify parameters used to comprehensively evaluate diastolic function by hemodynamics, clarify how each parameter is obtained, and consider the advantages and limitations associated with each measure. We provide a summary of the sensitivity of each diastolic parameter to loading conditions. Furthermore, we discuss differences that can occur in the accuracy of diastolic and systolic indices when generated by automated software compared with custom software analysis and the magnitude each parameter is influenced during inspiration with healthy breathing and a mild breathing load, commonly expected in heart failure. Finally, we identify key variables to control (e.g., body temperature, anesthetic, sampling rate) when collecting hemodynamic data. This review provides fundamental knowledge for users to succeed in troubleshooting and guidelines for evaluating diastolic function by hemodynamics in experimental models of heart failure.

Keywords: EDP; compliance; guidelines; respiratory; tau.


Conflict of interest statement

No conflicts of interest, financial or otherwise, are declared by the authors.

Figures

Fig. 1.
Fig. 1.
Cardiac cycle in a mouse. A: left ventricle, atrial and aortic pressure throughout the cardiac cycle. Systole commences once the mitral valve closes (a), allowing a large increase in ventricular pressure, called isovolumetric contraction (1). The aortic valve opens (b) when ventricular pressure exceeds aortic pressure. Blood is ejected from the left ventricle to the aorta (2). Systole finishes with aortic valve closure (c), from which diastole commences. From aortic valve closure to mitral valve opening, ventricular pressure rapidly decreases, called isovolumetric relaxation (3). The mitral valve opens (d) when ventricular pressure falls below atrial pressure, and early rapid filling (4) of the left ventricle begins. Diastasis (5) describes the phase of low filling between early rapid filling and atrial systole (6). Atrial contraction delivers the final volume of blood to the left ventricle. The pressure in the ventricle following filling is termed the end-diastolic pressure. Finally, the mitral valve closes and systole begins. B: rate of change of left ventricle pressure throughout the cardiac cycle. The peak rate of contraction (dP/dtmax) and the peak rate of relaxation (dP/dtmin) (shown in gray) are measures of systolic and diastolic function, respectively. C: left ventricle volume throughout the cardiac cycle. LVEDP, left ventricle end-diastolic pressure.
Fig. 2.
Fig. 2.
Structural and cellular mechanisms of diastolic dysfunction. Diastolic dysfunction can result from pathological structural or cellular mechanisms within the myocardium, including elevated left atrial filling pressure (secondary to pulmonary hypertension), sinus arrythmias, mitral valve stenosis, and vascular rarefaction (reduced capillary density) at the structural level and myofilament dysfunction altering elastic recoil, abnormal calcium handling (sensitivity and/or compartmentation), extracellular matrix remodeling (excessive fibrosis or constituent changes), cardiomyocyte remodeling (such as hypertrophy), and metabolic disturbances (mitochondrial dysfunction or deviant substrate utilization) at the cellular level. Each of these mechanisms, structural or cellular, consequently lead to impaired ventricular relaxation and/or decreased myocardial compliance resulting in diastolic dysfunction.
Fig. 3.
Fig. 3.
Cardiac cycle by pressure-volume loops. A: the 4 phases of the cardiac cycle (blue) shown on a pressure-volume loop, plotted as instantaneous pressure vs. volume. The loop represents one cardiac cycle and highlights how the heart transitions between end diastole and end systole. B: a reduction in preload by occlusion of the inferior vena cava decreases filling pressures, shifting the loops to lower pressures and volumes at end systole and diastole. Connecting the end systole pressure-volume points generates a linear end-systolic pressure-volume relationship (ESPVR). Conversely, connecting the end-diastolic pressure-volume points generates an exponential end-diastolic pressure-volume relationship (EDPVR). C: a healthy EDPVR (black) and an EDPVR with diastolic dysfunction (red). In diastolic dysfunction, compliance is reduced and the EDPVR is shifted upward.
Fig. 4.
Fig. 4.
Tau Weiss: poor fit of measured data to an exponential curve and does not account for changes in end-diastolic pressure. When relaxation is fitted to an exponential curve, −1/τ is the slope of the natural logarithm (ln) of pressure and time. A,i: left ventricle pressure (LVP) vs. time and the pressure points (A,ii) included for the calculation of τ. B: rate of pressure change (dP/dt) vs. time and the dP/dt points used to calculate τ. The dotted vertical line in A and B marks peak rate of relaxation (dP/dtmin). C: ln(LVP) vs. time. D: ln(LVP) vs. time and the linear regression with slope equal to −1/τ. Note: ln(LVP) vs. time is a curvilinear function and therefore there is poor agreement between recorded data and an exponential curve.
Fig. 5.
Fig. 5.
Tau Glantz: accounts for changes in end-diastolic pressure but still shows poor fit of measured data to an exponential curve. When relaxation is fitted to an exponential curve, −1/τ is the slope of the linear regression of rate of pressure change (dP/dt) and left ventricle pressure (LVP). A: LVP vs. time and the pressure points included for the calculation of τ. B: dP/dt vs. time and the dP/dt points used to calculate τ. The dotted vertical line in A and B represents the dP/dtmin. C: dP/dt vs. pressure. D: dP/dt vs. pressure and the linear regression with slope equal to −1/τ. Note: dP/dt vs. LVP is a curvilinear function and therefore there is poor agreement between recorded data and an exponential curve.
Fig. 6.
Fig. 6.
Tau Logistic: independent of variability in end-diastolic pressure and an excellent fit of measured data to a logistic curve. When relaxation is fitted to a logistic curve, τ is the time for pressure to decay by 46% of the pressure recorded at peak rate of relaxation (dP/dtmin). A: left ventricle pressure (LVP) vs. time and the pressure points included in the calculation of τ. Baseline shift (PB) is equal to the minimum LV pressure. B: rate of pressure change (dP/dt) vs. time and the dP/dt points used to calculate τ. The dotted vertical line in A and B represents dP/dtmin. C: LVP vs. time. Using the pressure at time zero (pressure at dP/dtmin) and PB, the amplitude constant (PA) can be easily calculated. The gray box shows the time required for pressure to decay by 46%, equal to Tau Logistic. D: dP/dt vs. pressure. To determine Tau Logistic, substitute dP/dtmin and PA into the equation dP/dtmin = −PA/4·τ and solve for τ. E: dP/dt vs. LVP with curve fit showing excellent agreement between the data recorded and a logistic curve. τ = −PA/4·dP/dtmin.
Fig. 7.
Fig. 7.
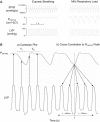
Schematic for measuring left ventricle hemodynamics and tracheal pressures to determine the influence of respiration on cardiac function. A: tracheal pressures (Ptrachea; used for monitoring respiratory function) were recorded simultaneously with hemodynamic measures [left ventricle pressure (LVP); rate of pressure change (dP/dt)] during eupneic (normal) breathing and with a mild respiratory load (induced by tracheal constriction). B: instantaneous tracheal pressure was recorded in reference to systolic and diastolic hemodynamic parameters. Ptrachea is divided into time in inspiration (TI; black) and time in expiration (TE; gray), which represents one complete respiratory cycle (a). However, this fails to capture the influence of respiration on cardiac function because the frequency of respiratory and cardiac function is not synchronized. To properly capture the influence of respiratory pressures on cardiac function, we performed cross-correlation analysis (b) of hemodynamic parameters in reference to peak tracheal pressure (peak inspiration). There is a rhythmic waveform in hemodynamic indices resulting from inspiratory and expiratory pressures. LVP cycles were measured ~0.4 s before and 0.6 s following a peak inspiratory pressure (time zero; dotted vertical line) to observe how respiration influences hemodynamic variables during inspiration and expiration.
Fig. 8.
Fig. 8.
Swings in respiratory pressure minimally influence systolic pressures and indices of function in rat. Tracheal pressures (Ptrachea; used for monitoring respiratory function) were recorded simultaneously with hemodynamic measures (as described in Fig. 7) during eupneic breathing (red) and with a mild respiratory load (black). Systolic parameters [heart rate; left ventricle pressure (LVP); peak contraction rate (dP/dtmax)] are shown across the respiratory cycle. A, D, and G show the relationship between systolic parameters and Ptrachea throughout the respiratory cycle. Peak tracheal inspiratory pressure occurs at time equal to zero (dotted vertical line; 0.0 s). B, C, E, F, H, and I show cross-correlations between peak inspiratory pressure and systolic parameters derived from LVP to observe how each hemodynamic parameter is affected by inspiration, then plateaus during expiration. During eupneic (B) and loaded breathing (C), heart rate shows minimal variability between inspiratory and expiratory phases of respiration (A). At peak inspiratory pressures, LVP is more negative in eupneic breathing (E) compared with expiration, which is amplified during loaded breathing (F). Respiratory loading increases LVP variability between inspiration and expiration compared with eupneic breathing (D). dP/dtmax decreases with respiratory loading compared with eupneic breathing (G). However, during normal (H) and loaded (I) breathing, dP/dtmax varies minimally between inspiratory and expiratory phases of respiration. bpm, beats/min.
Fig. 9.
Fig. 9.
Swings in respiratory pressure heavily influence diastolic pressures and indices of function in rat. Tracheal pressures (Ptrachea; used for monitoring respiratory function) were recorded simultaneously with hemodynamic measures during eupneic breathing (red) and loaded breathing (black). Diastolic parameters [end-diastolic pressure (EDP); peak relaxation rate (dP/dtmin); minimum left ventricle pressure (LVPmin); Tau Logistic (Tau L); Tau Glantz (Tau G)] are shown across the respiratory cycle. A, D, G, J, and M show the relationship between diastolic parameters and Ptrachea with normal and loaded breathing. Peak tracheal inspiratory pressure occurs at time zero (dotted vertical line; 0.0 s). B, C, E, F, H, I, K, L, N, and O show cross-correlations between peak inspiratory pressure and diastolic parameters derived from LVP to observe how each hemodynamic parameter is affected by inspiration compared with during expiration. EDP shows high variability between peak inspiration and expiration during eupneic breathing (B), which is amplified by an added respiratory load (A, C). dP/dtmin shows moderate variability between normal inspiration and expiration, which is magnified by approximately threefold during loaded breathing (D). Compared with eupneic breathing (E), dP/dtmin is less negative (i.e., slower relaxation) with respiratory loading (F). LVPmin is highly variable between peak inspiration and expiration (G) during eupneic breathing (H), which is amplified by respiratory loading (I). Tau L decreases moderately during inspiration as compared with expiration during eupneic breathing (K), which is enhanced during loaded breathing (J, L). Tau G is moderately sensitive to variability between inspiration to expiration during eupneic breathing (N). However, with respiratory loading (O), variability in Tau G between peak inspiration and expiration increases by almost 3 times (M). In both normal and loaded breathing, Tau G shows a heightened sensitivity to respiratory influences as compared with Tau L.
Fig. 10.
Fig. 10.
Diastolic, but not systolic, parameters are heavily influenced by inspiratory pressure. A summary of how systolic and diastolic parameters are affected by inspiration as compared with expiration during normal and loaded breathing. Zero identifies the value specific to each parameter at the late expiratory phase of respiration. Vertical bars represent the percentage by which each parameter changes from late expiration to inspiration. Systolic indices [instantaneous heart rate (iHR); left ventricle pressure (LVP); peak contraction rate (dP/dtmax)] are minimally influenced by inspiratory pressures during eupneic breathing (red). With a mild respiratory load (induced by tracheal constriction; black) the influence of inspiratory pressures on LVP increases moderately. By comparison to systolic parameters, diastolic parameters [peak relaxation rate (dP/dtmin); Tau Glantz (Tau G); Tau Logistic (Tau L); left ventricle pressure at minimum dP/dt (LVP@dP/dtmin); minimum LVP (LVPmin); end-diastolic pressure (EDP)] are heavily influenced by inspiratory pressure. This influence of inspiration is amplified with a mild respiratory load, particularly in Tau Glantz (decrease by ~3 times), LVPmin (decrease by ~3 times), and EDP (decrease by ~3 times) as compared with normal breathing. These parameters are sensitive to the respiratory influence; therefore, it is recommended that diastolic parameters are reported in separate respiratory phases: 1) inspiration and 2) expiration. Note: LVP@dP/dtmin and LVPmin are not frequently used to assess diastolic function. However, they are used in the calculation of Tau Logistic and were therefore included here.
Fig. 11.
Fig. 11.
Anesthetic effects on end-diastolic pressure (EDP) points. Pressure data from a single male mouse across decreasing levels of anesthetic. Data points correspond with the pressure recorded at end diastole. EDP decreases at higher anesthetic levels (2.5% isoflurane) and increases at lower anesthetic levels (1.0% isoflurane). At higher levels of anesthesia, ventilatory drive increases, creating a more negative intrathoracic pressure. When this pressure in the thorax decreases and transmits through the ventricle wall, EDP becomes more negative.
Fig. 12.
Fig. 12.
Diastolic function in males and females is not equal. End-diastolic pressure (EDP; A) and peak relaxation rate (dP/dtmin; B) in healthy, 16-wk-old male (blue) and female (red) Wistar rats. In females, EDP is lower and peak relaxation rate is more negative (i.e., faster relaxation). Values are means ± SD.
Fig. 13.
Fig. 13.
Cardiac function is influenced by core body temperature. The effect of core body temperature in a male mouse on end-diastolic pressure (EDP; black) and heart rate (red). As body temperature rises, approaching optimal core body temperature, EDP decreases and heart rate increases. bpm, beats/min.
Fig. 14.
Fig. 14.
Variability in diastolic and systolic parameters with a decreased sampling rate. The effect of decreasing sampling rate from 5 kHz to 500 Hz on diastolic [peak relaxation rate (dP/dtmin), blue; end-diastolic pressure (EDP), black] and systolic [peak contraction rate (dP/dtmax), red; maximum left ventricle pressure (LVPmax), gray] parameters in mice. Values are expressed as a percentage of the value recorded at a sampling rate of 5 kHz. Diastolic parameters are more sensitive to signal loss compared with systolic parameters.
Fig. 15.
Fig. 15.
The frequency distribution of cardiac software analysis programs for the evaluation of diastolic function by invasive hemodynamics published in American Journal of Physiology-Heart and Circulatory Physiology articles between January 2018 and December 2019.
Fig. 16.
Fig. 16.
The frequency distribution of each τ method published in American Journal of Physiology-Heart and Circulatory Physiology articles between January 2018 and December 2019.

References

    1. Adam RJ, Xia Z, Pravoverov K, Hong J, Case AJ, Schultz HD, Lisco SJ, Zucker IH, Wang HJ. Sympathoexcitation in response to cardiac and pulmonary afferent stimulation of TRPA1 channels is attenuated in rats with chronic heart failure. Am J Physiol Heart Circ Physiol 316: H862–H872, 2019. doi:10.1152/ajpheart.00696.2018. - DOI - PMC - PubMed
    1. Ahmad S, Masjoan Juncos JX, Ahmad A, Zaky A, Wei CC, Bradley WE, Zafar I, Powell P, Mariappan N, Vetal N, Louch WE, Ford DA, Doran SF, Matalon S, Dell’Italia LJ. Bromine inhalation mimics ischemia-reperfusion cardiomyocyte injury and calpain activation in rats. Am J Physiol Heart Circ Physiol 316: H212–H223, 2019. doi:10.1152/ajpheart.00652.2017. - DOI - PMC - PubMed
    1. Alderman EL, Glantz SA. Acute hemodynamic interventions shift the diastolic pressure-volume curve in man. Circulation 54: 662–671, 1976. doi:10.1161/01.CIR.54.4.662. - DOI - PubMed
    1. Allwood MA, Edgett BA, Eadie AL, Huber JS, Romanova N, Millar PJ, Brunt KR, Simpson JA. Moderate and severe hypoxia elicit divergent effects on cardiovascular function and physiological rhythms. J Physiol 596: 3391–3410, 2018. doi:10.1113/JP275945. - DOI - PMC - PubMed
    1. Allwood MA, Foster AJ, Arkell AM, Beaudoin MS, Snook LA, Romanova N, Murrant CL, Holloway GP, Wright DC, Simpson JA. Respiratory muscle weakness in the Zucker diabetic fatty rat. Am J Physiol Regul Integr Comp Physiol 309: R780–R787, 2015. doi:10.1152/ajpregu.00447.2014. - DOI - PubMed

Publication types