Multicenter Study
. 2020 Aug;296(2):E72-E78.
doi: 10.1148/radiol.2020201160. Epub 2020 Mar 27.

Frequency and Distribution of Chest Radiographic Findings in Patients Positive for COVID-19

Affiliations
Multicenter Study

Frequency and Distribution of Chest Radiographic Findings in Patients Positive for COVID-19

Ho Yuen Frank Wong et al. Radiology. 2020 Aug.

Abstract

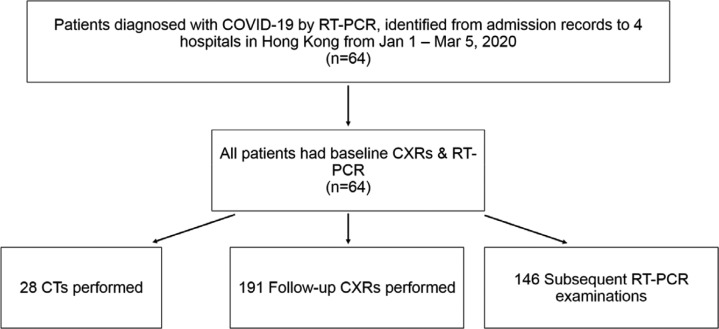
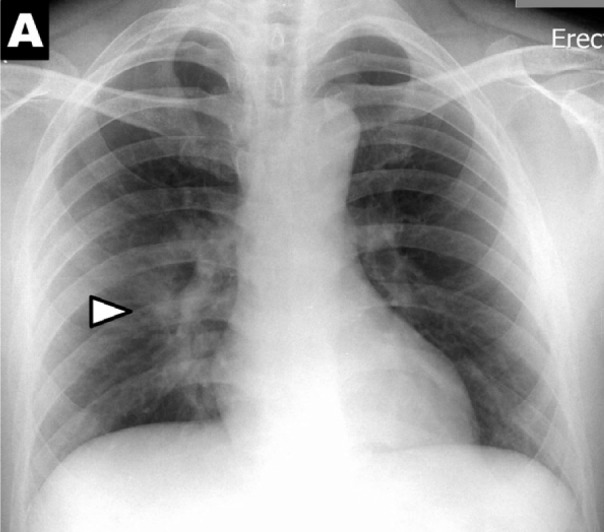
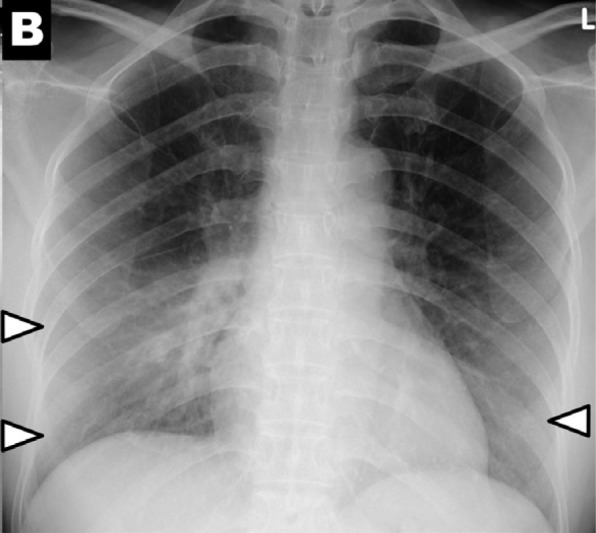
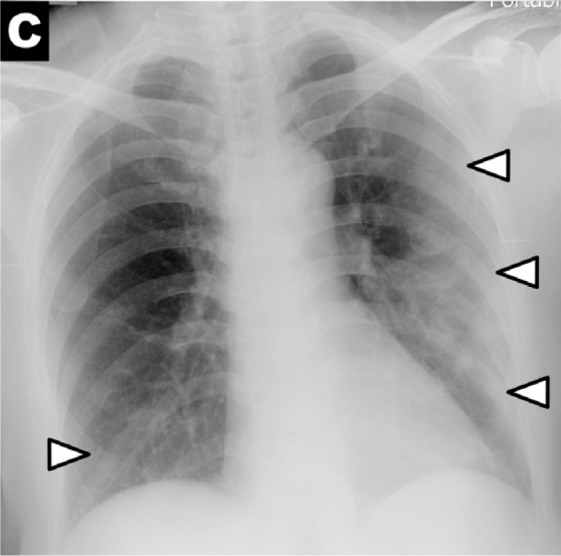
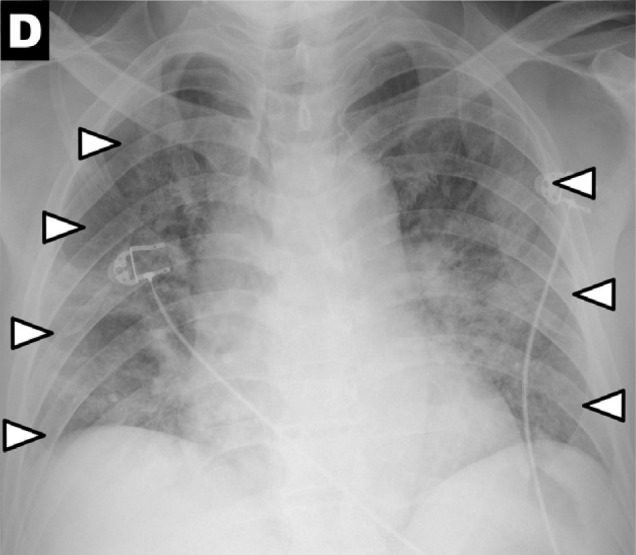
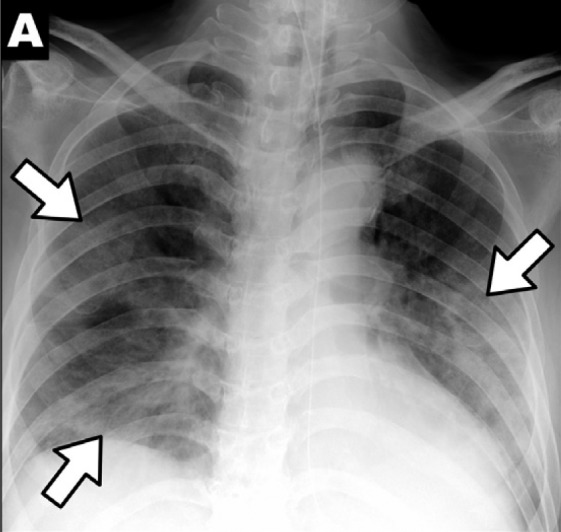
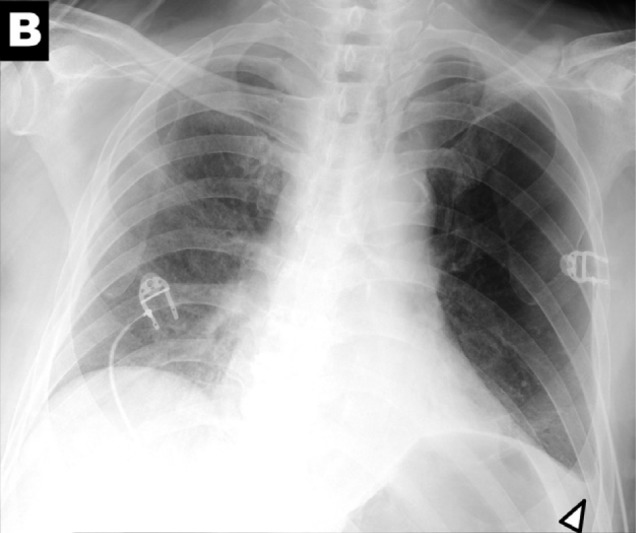
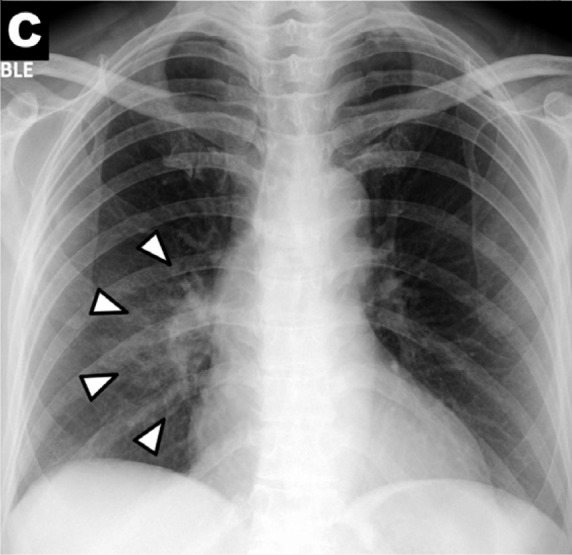
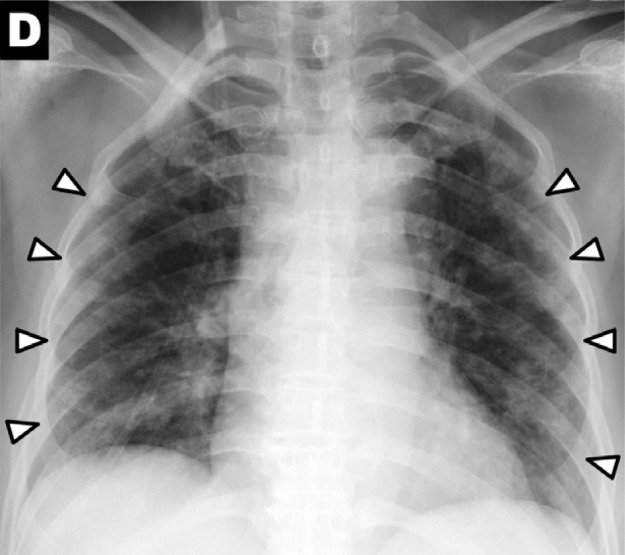
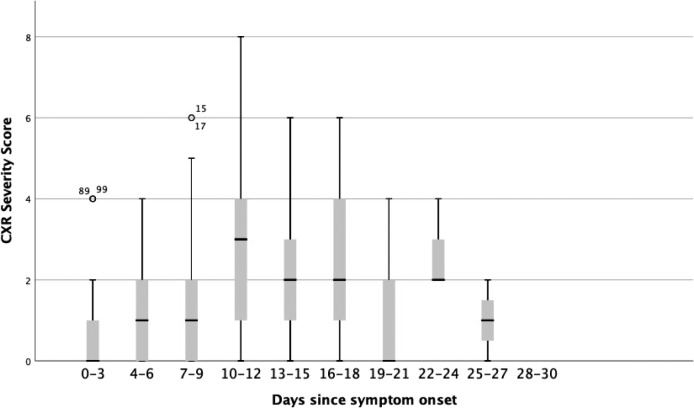
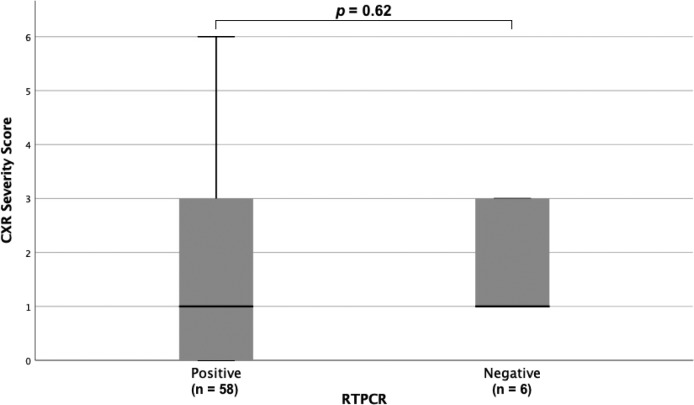
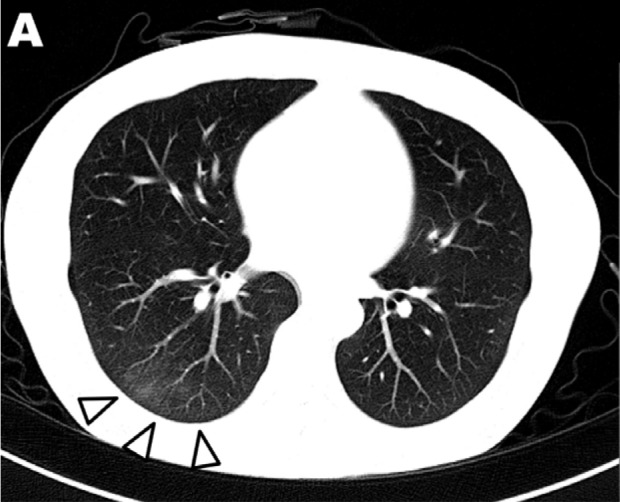
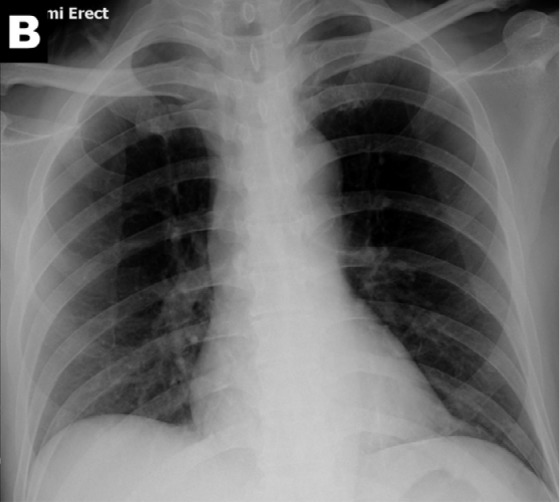
Background Current coronavirus disease 2019 (COVID-19) radiologic literature is dominated by CT, and a detailed description of chest radiography appearances in relation to the disease time course is lacking. Purpose To describe the time course and severity of findings of COVID-19 at chest radiography and correlate these with real-time reverse transcription polymerase chain reaction (RT-PCR) testing for severe acute respiratory syndrome coronavirus 2, or SARS-CoV-2, nucleic acid. Materials and Methods This is a retrospective study of patients with COVID-19 confirmed by using RT-PCR and chest radiographic examinations who were admitted across four hospitals and evaluated between January and March 2020. Baseline and serial chest radiographs (n = 255) were reviewed with RT-PCR. Correlation with concurrent CT examinations (n = 28) was performed when available. Two radiologists scored each chest radiograph in consensus for consolidation, ground-glass opacity, location, and pleural fluid. A severity index was determined for each lung. The lung scores were summed to produce the final severity score. Results The study was composed of 64 patients (26 men; mean age, 56 years ± 19 [standard deviation]). Of these, 58 patients had initial positive findings with RT-PCR (91%; 95% confidence interval: 81%, 96%), 44 patients had abnormal findings at baseline chest radiography (69%; 95% confidence interval: 56%, 80%), and 38 patients had initial positive findings with RT-PCR testing and abnormal findings at baseline chest radiography (59%; 95% confidence interval: 46%, 71%). Six patients (9%) showed abnormalities at chest radiography before eventually testing positive for COVID-19 with RT-PCR. Sensitivity of initial RT-PCR (91%; 95% confidence interval: 83%, 97%) was higher than that of baseline chest radiography (69%; 95% confidence interval: 56%, 80%) (P = .009). Radiographic recovery (mean, 6 days ± 5) and virologic recovery (mean, 8 days ± 6) were not significantly different (P = .33). Consolidation was the most common finding (30 of 64; 47%) followed by ground-glass opacities (21 of 64; 33%). Abnormalities at chest radiography had a peripheral distribution (26 of 64; 41%) and lower zone distribution (32 of 64; 50%) with bilateral involvement (32 of 64; 50%). Pleural effusion was uncommon (two of 64; 3%). The severity of findings at chest radiography peaked at 10-12 days from the date of symptom onset. Conclusion Findings at chest radiography in patients with coronavirus disease 2019 frequently showed bilateral lower zone consolidation, which peaked at 10-12 days from symptom onset. © RSNA, 2020.


Figures

Figure 1:
Figure 1:
Study flow chart
Figure 2a:
Figure 2a:
Chest x-ray scoring system. A score of 0-4 was assigned to each lung depending on the extent of involvement by consolidation or GGO (0 = no involvement; 1 = <25%; 2 = 25-50%; 3 = 50-75%; 4 = >75% involvement). The scores for each lung were summed to produce the final severity score. Examples of chest x-ray severity scoring in patients with COVD-19 (Days from symptom onset; R lung score + L lung score = total score): (A) Day 12; 1 + 0 = 1. (B) Day 5; 2 + 1 = 3. (C) Day 3; 1 + 3 = 4. (D) Day 10; 4 + 3 = 7.
Figure 2b:
Figure 2b:
Chest x-ray scoring system. A score of 0-4 was assigned to each lung depending on the extent of involvement by consolidation or GGO (0 = no involvement; 1 = <25%; 2 = 25-50%; 3 = 50-75%; 4 = >75% involvement). The scores for each lung were summed to produce the final severity score. Examples of chest x-ray severity scoring in patients with COVD-19 (Days from symptom onset; R lung score + L lung score = total score): (A) Day 12; 1 + 0 = 1. (B) Day 5; 2 + 1 = 3. (C) Day 3; 1 + 3 = 4. (D) Day 10; 4 + 3 = 7.
Figure 2c:
Figure 2c:
Chest x-ray scoring system. A score of 0-4 was assigned to each lung depending on the extent of involvement by consolidation or GGO (0 = no involvement; 1 = <25%; 2 = 25-50%; 3 = 50-75%; 4 = >75% involvement). The scores for each lung were summed to produce the final severity score. Examples of chest x-ray severity scoring in patients with COVD-19 (Days from symptom onset; R lung score + L lung score = total score): (A) Day 12; 1 + 0 = 1. (B) Day 5; 2 + 1 = 3. (C) Day 3; 1 + 3 = 4. (D) Day 10; 4 + 3 = 7.
Figure 2d:
Figure 2d:
Chest x-ray scoring system. A score of 0-4 was assigned to each lung depending on the extent of involvement by consolidation or GGO (0 = no involvement; 1 = <25%; 2 = 25-50%; 3 = 50-75%; 4 = >75% involvement). The scores for each lung were summed to produce the final severity score. Examples of chest x-ray severity scoring in patients with COVD-19 (Days from symptom onset; R lung score + L lung score = total score): (A) Day 12; 1 + 0 = 1. (B) Day 5; 2 + 1 = 3. (C) Day 3; 1 + 3 = 4. (D) Day 10; 4 + 3 = 7.
Figure 3a:
Figure 3a:
Chest x-ray findings in COVID-19: (A) patchy consolidations, (B) pleural effusion, (C) perihilar distribution, and (D) peripheral distribution.
Figure 3b:
Figure 3b:
Chest x-ray findings in COVID-19: (A) patchy consolidations, (B) pleural effusion, (C) perihilar distribution, and (D) peripheral distribution.
Figure 3c:
Figure 3c:
Chest x-ray findings in COVID-19: (A) patchy consolidations, (B) pleural effusion, (C) perihilar distribution, and (D) peripheral distribution.
Figure 3d:
Figure 3d:
Chest x-ray findings in COVID-19: (A) patchy consolidations, (B) pleural effusion, (C) perihilar distribution, and (D) peripheral distribution.
Figure 4:
Figure 4:
Change in COVID-19 chest x-ray (CXR) severity score with duration since symptom onset. A score of 0-4 was assigned to each lung depending on the extent of involvement by consolidation or GGO (0 = no involvement; 1 = <25%; 2 = 25-50%; 3 = 50-75%; 4 = >75% involvement). The scores for each lung were summed to produce the final severity score. Kruskal-Wallis test (p=0.01) indicated a significant difference between the scores at different time points.
Figure 5:
Figure 5:
Baseline chest x-ray (CXR) severity scores between COVID-19 patients with initially positive (n=58) and negative RT-PCR (n=6) for SARS-2COV nucleic acid. There was no statistical difference (p = 0.62).
Figure 6a:
Figure 6a:
Ground glass opacities seen on computed tomography in a patient with COVID-19 (Image A) but not visible on CXR (Image B). Abbreviations RT-PCR – reverse transcriptase polymerase chain reaction, GGO- ground glass opacity
Figure 6b:
Figure 6b:
Ground glass opacities seen on computed tomography in a patient with COVID-19 (Image A) but not visible on CXR (Image B).

Comment in

Similar articles

Cited by

References

    1. Zhu N, Zhang D, Wang W, et al. . A Novel Coronavirus from Patients with Pneumonia in China, 2019. N Engl J Med. January 2020. doi:10.1056/nejmoa2001017. - PMC - PubMed
    1. Huang C, Wang Y, Li X, et al. . Clinical features of patients infected with 2019 novel coronavirus in Wuhan, China. Lancet. 2020;395(10223):497-506. doi:10.1016/S0140-6736(20)30183-5. - PMC - PubMed
    1. World Health Organization . Coronavirus Disease 2019 (COVID-19) Situation Report - 51.; 2020.
    1. World Health Organization . Coronavirus Disease 2019 (COVID-19) Situation Report - 62.; 2020.
    1. Zhou S, Wang Y, Zhu T, Xia L. CT Features of Coronavirus Disease 2019 (COVID-19) Pneumonia in 62 Patients in Wuhan, China. Am J Roentgenol. March 2020:1–8. doi:10.2214/AJR.20.22975. - PubMed

Publication types

MeSH terms