

Cardiopulmonary exercise test indices of respiratory buffering before and after aerobic exercise training in women with pulmonary hypertension: Differentiation by magnitudes of change in six-minute walk test performance
- PMID: 32217288
- PMCID: PMC10367185
- DOI: 10.1016/j.rmed.2020.105900
Cardiopulmonary exercise test indices of respiratory buffering before and after aerobic exercise training in women with pulmonary hypertension: Differentiation by magnitudes of change in six-minute walk test performance
Abstract
While aerobic exercise training (AET) has generally been shown to improve 6-min walk test (6MWT) distance (6MWD) in patients with pulmonary hypertension (PH), a substantial number of patients appear to adapt differently, with minimal or even negative changes in 6MWT distance being reported.
Purpose: To compare post-aerobic exercise training adaptations in cardiorespiratory functional capacity across three groups of patients with PH: those with high (HI), low (LI) and negative (NEG) post-training increases in 6MWD.
Methods: Participants were 25 females (age 54 ± 11 years; BMI 31 ± 7 kg/m2) who completed a vigorous, 10-week, thrice weekly, supervised treadmill walking exercise program. Cardiopulmonary exercise tests (CPET) and 6MWT were completed before and after training. Ten of the 25 participants were classified as HI (range = 47-143 m), 11 were classified as LI (range = 4-37 m) and 4 were classified as NEG (range = -17 to -53 m).
Results: Peak CPET duration, WR and time to anaerobic threshold (AT) were significantly higher (p < 0.05) after training in both the LI and HI groups but not in the NEG group. There was a significant improvement in VE/VCO2 (p = 0.042), PETCO2 (p = 0.011) and TV (p = 0.050) in the HI group after training, but not in the NEG or LI group.
Conclusion: These findings suggest that sustained ventilatory inefficiency and restricted respiratory buffering may mediate exercise intolerance and impede the ability to adapt to exercise training in some patients with PH.
Keywords: Aerobic exercise training; Pulmonary hypertension; Six-minute walk test.
Copyright © 2020. Published by Elsevier Ltd.
Conflict of interest statement
Declaration of competing interest The authors declare that they have no known competing financial interests or personal relationships that could have appeared to influence the work reported in this paper.
Figures

 , LI
, LI  , HI
, HI  . 6MWT = six-minute walk test; MCID = minimal clinically important difference.
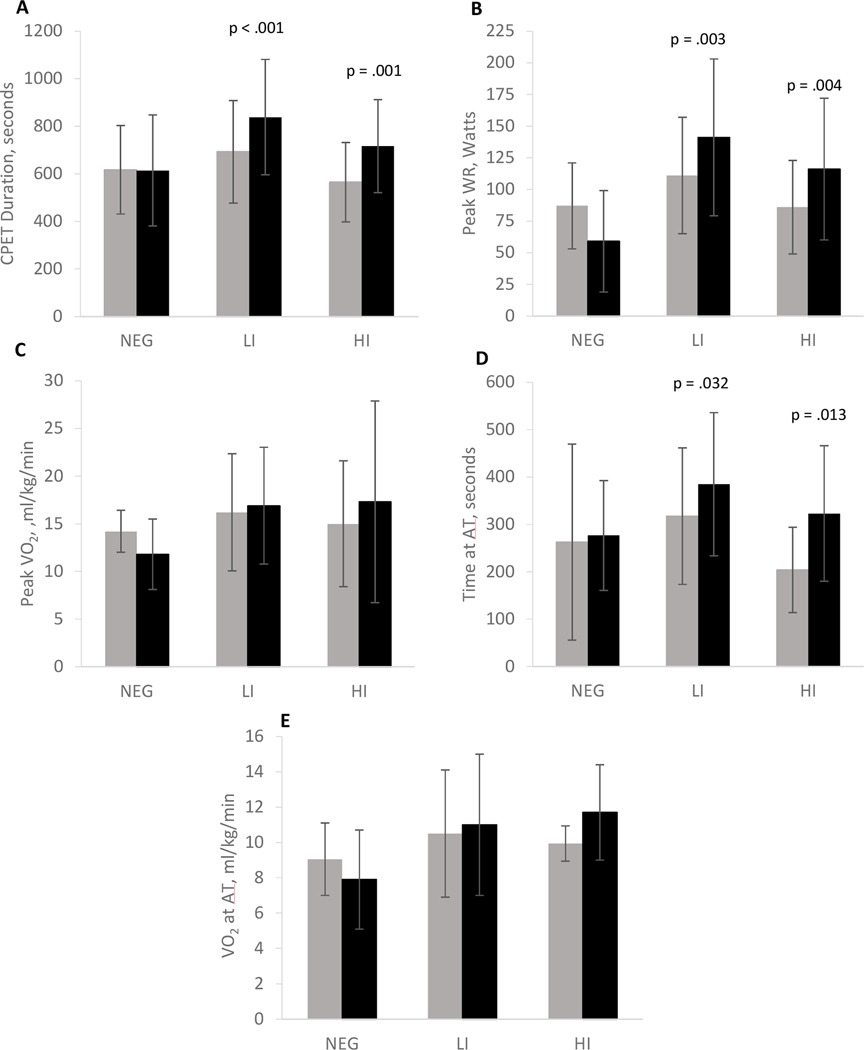 and after AET . P-values represent significant differences within each of the groups post vs pre AET. CPET = cardiopulmonary exercise test; WR = work rate; VO2 = peak oxygen consumption; AT = anaerobic threshold; AET = aerobic exercise training.
 and after AET . P-values represent significant differences within each of the groups post vs pre AET.VE/VCO2 = ventilatory quotient for carbon dioxide; PETCO2 = end tidal partial carbon dioxide pressure; VE = expired minute ventilation, VCO2 = expired volume of carbon dioxide.
 , LI
, LI  and HI
  groups. 6MWD = 6-minute walk distance; VCO2 = ventilatory quotient for carbon dioxide; PETCO2 = end tidal carbon dioxide partial pressure; AT = anaerobic threshold.
References
-
- Galie N, Hoeper MM, Humbert M, et al. Guidelines for the diagnosis and treatment of pulmonary hypertension: the Task Force for the Diagnosis and Treatment of Pulmonary Hypertension of the European Society of Cardiology (ESC) and the European Respiratory Society (ERS), endorsed by the International Society of Heart and Lung Transplantation (ISHLT). Eur Heart J 2009;30:2493–537. - PubMed
-
- Deano RC, Glassner-Kolmin C, Rubenfire M, et al. Referral of patients with pulmonary hypertension diagnoses to tertiary pulmonary hypertension centers: the multicenter RePHerral study. JAMA Intern Med 2013;173:887–93. - PubMed
-
- Sisniega C, Zayas N, Pulido T. Advances in medical therapy for pulmonary arterial hypertension. Curr Opin Cardiol 2019;34:98–103. - PubMed
-
- Becker-Grunig T, Klose H, Ehlken N, et al. Efficacy of exercise training in pulmonary arterial hypertension associated with congenital heart disease. Int J Cardiol 2013;168:375–81. - PubMed
