Review
. 2020 Mar 25;12(4):732.
doi: 10.3390/polym12040732.

Natural Compounds as Sustainable Additives for Biopolymers

Affiliations
Review

Natural Compounds as Sustainable Additives for Biopolymers

Nadka Tzankova Dintcheva et al. Polymers (Basel). .

Abstract

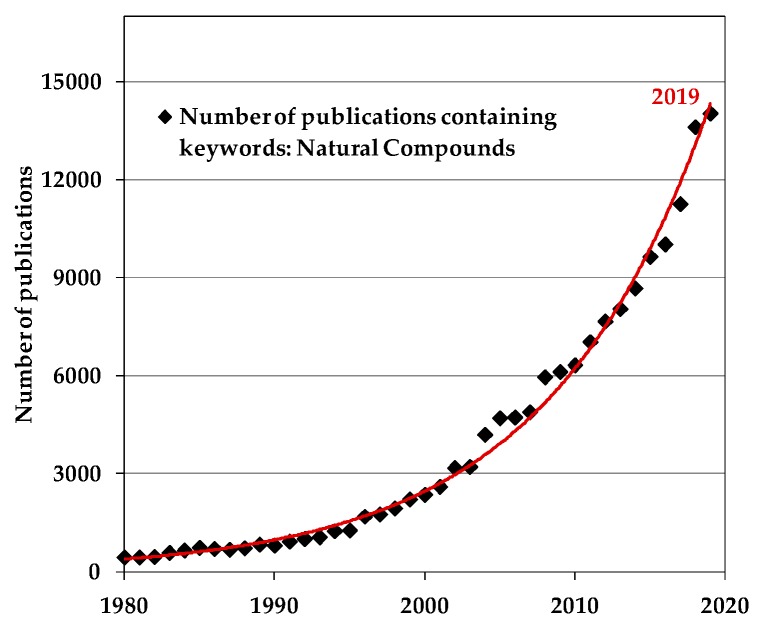
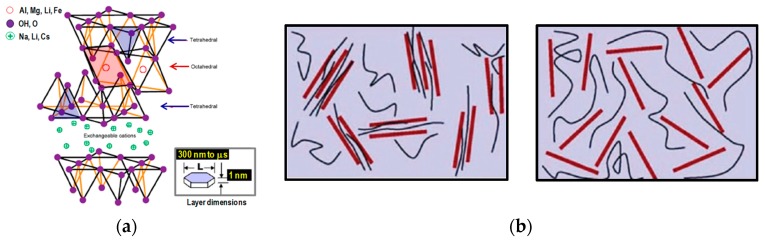
In the last few decades, the interest towards natural compounds, coming from a natural source and biodegradable, for biopolymers is always increasing because of a public request for the formulation of safe, eco-friendly, and sustainable materials. The main classes of natural compounds for biopolymers are: (i) naturally occurring fillers (nFil), such as nano-/micro- sized layered alumino-silicate: halloysite, bentonite, montmorillonite, hydroxyapatite, calcium carbonate, etc.; (ii) naturally occurring fibers (nFib), such as wood and vegetable fibers; (iii) naturally occurring antioxidant molecules (nAO), such as phenols, polyphenols, vitamins, and carotenoids. However, in this short review, the advantages and drawbacks, considering naturally occurring compounds as safe, eco-friendly, and sustainable additives for biopolymers, have been focused and discussed briefly, even taking into account the requests and needs of different application fields.

Keywords: biopolymers; natural antioxidants; natural fibers; natural fillers.


Conflict of interest statement

The authors declare no conflicts of interest.

Figures

Figure 1
Figure 1
The trend of published papers vs. publication year (Scopus data revelation in January 2020).
Figure 2
Figure 2
(a) Structure of layered alumino-silicate and (b) intercalated (left) and exfoliated (right) morphology of layered alumino-silicate into polymer and biopolymer matrices [32], Reproduced with permission from Bayer G, Plast Addit Compound; published by Elsevier, 2002.
Figure 3
Figure 3
Storage modulus, E’, for (a) polylactic acid (PLA) and (b) PCL-based nanocomposite systems [37], Reproduced with permission from Fukushima K, Mater. Sci. Eng. C; published by Elsevier, 2009.
Figure 4
Figure 4
(a) Sample deflection recorded during creep tests for the sample PLA (squares), polyamide 11 (PA11) (diamond), PLA70 (circles), and PLA70-silicate at 3 wt.% (triangles). (b,c) The pictures show the samples PLA70 and PLA70-silicate at the end of the test, that is, after the temperature had reached ≈160 °C [38], Reproduced with permission from Nuzzo A, Macromol. Mater. Eng.; published by Wiley, 2014.
Figure 5
Figure 5
Effect of natural unmodified montmorillonite (Na-MMT) and organo-modified layered montmorillonite (OMMT) on mechanical properties: compressive strength (a), bending strength (b) and impact toughness (c) of PLA/polybutylene succinate (PBS) foams [40], Reproduced with permission Figure 2014.
Figure 6
Figure 6
(a) Elongation at break (EB) and (b) Young’s modulus (E) of different samples without and with montmorillonite and compatilizing agent as a function of accelerated weathering exposure, using UV-B lamps (~313 nm). (c) energy dispersive X-ray analysis (EDX) of Cloisite 15A [28], Reproduced with permission from Dintcheva NTz, Polym. Degrad. Stab.; published by Elsevier, 2009.
Figure 7
Figure 7
(a) Schematic representation of the “tortuous path” model for nanocomposites. (b) Transmission electron micrograph (TEM) of PLA nanocomposite containing 3 wt.% of montmorillonite, showing aligned clay platelets. (c) Water vapor transmission rates (WVTR) of PLA nanocomposites as a function of wt. nanofillers for two different PLA grades [41], Reproduced with permission from Duan Z, J. Membrane Sci.; published by Elsevier, 2013.
Figure 8
Figure 8
(a) Yield strength and (b) strain at break for poly-L-lactic acid (PLLA) samples before and after 5 weeks of aging as a function of hydroxyapatite (nHA) content. (c) Mass loss and (d) degree of crystallinity for amorphous sample, as a function of the aging time for PLLA containing nHA at 0, 5, and 10 wt.% [42], Reproduced with permission from Delabarde C, Polym. Degrad. Stab.; published by Elsevier, 2011.
Figure 9
Figure 9
(a,b) Stress-strain curves of neat PLA and PLA containing hydroxyapatite (HA) nanoparticles modified with phosphorus-based organic additives [43], Reproduced with permission from Hajibeygi M, Polym. Adv. Technol.; published by Wiley, 2019.
Figure 10
Figure 10
TGA curves of the CaCO3-PLA bio-composites with various loading of CaCO3: (a) micro-CaCO3-1740; (b) nano-CaCO3-1041; (c) nano-CaCO3-280 [44], Reproduced with permission from Nekhamanuraka B, Energy Procedia; published by Elsevier, 2014.
Figure 11
Figure 11
(a) TGA thermogram of CL–PLA/CC nanocomposites [45], Reproduced with permission from Kumar V, Composites: Part B; published by Elsevier, 2014.
Figure 12
Figure 12
Mechanical properties: (a) tensile stress, (b) tensile modulus, and (c) unnotched Charpy impact strength of neat PLA and PLA/flax, without and with triacetin [50], Reproduced with permission from Oksman K, Compos. Sci. Technol.; published by Elsevier, 2003.
Figure 13
Figure 13
Mechanical properties: (a) Tensile strength, (b)Young’s modulus, (c) elongation at break, and (d) Charpy impact strength of the composites and neat PLA (MD—machine direction; CD—cross direction; standard deviation are shown as error bars; the letter in the figures a, b, c, d, and e means that there are significant differences between the mean values measured in MD) [67], Reproduced with permission from Graupner N, Composites: Part A; published by Elsevier, 2009.
Figure 13
Figure 13
Mechanical properties: (a) Tensile strength, (b)Young’s modulus, (c) elongation at break, and (d) Charpy impact strength of the composites and neat PLA (MD—machine direction; CD—cross direction; standard deviation are shown as error bars; the letter in the figures a, b, c, d, and e means that there are significant differences between the mean values measured in MD) [67], Reproduced with permission from Graupner N, Composites: Part A; published by Elsevier, 2009.
Figure 14
Figure 14
Dimensionless elongation at break, EB(t)/EB(t0), of the starch-based biodegradable film (Mater-Bi®), additivated with (a) vitamin E (V-E) and quercetin (Q) and (b) synthetic antioxidant (AO) and light stabilizer (LS) [79], Reproduced with permission from Dintcheva NTz, J. Polym. Eng.; published by De Gruyter, 2014.
Figure 15
Figure 15
(a) Carbonyl functionalities, (b) molecular weight variation, and (c) elongation at break of neat PLA (PR0) and PLA containing 1 and 3 wt.% of R (PR1 and PR3) as a function of the irradiation time [82], Reproduced with permission from Agustin-Salazar S, ACS Sustainable Chem. Eng.; published by ACS Publications, 2014.
Figure 16
Figure 16
Variation of anhydride band area for neat PLA and PLA containing (a) 0.5 and 1 wt.% [93], Reproduced with permission from Dintcheva NTz, Polym. Degrad. Stab.; published by Elsevier, 2017, and (b) 2 and 3 wt.% of ferulic acid (FA) [26], Reproduced with permission from Dintcheva NTz, Polym. Degrad. Stab.; published by Elsevier, 2018.

References

    1. Scott G., Gilead D., editors. Degradable Polymers. Chapman & Hall; London, UK: 1995.
    1. Gross R.A., Kalra B. Biodegradable Polymers for the Environment. Science. 2002;297:803–807. doi: 10.1126/science.297.5582.803. - DOI - PubMed
    1. Basrioli C., editor. Handbook of Biodegradable Polymers. Rapra Technol. Lim.; Shropshire, UK: 2005.
    1. Platt D.K., editor. Biodegradable Polymers—Market Report. Rapra Technol. Lim.; Shropshire, UK: 2006.
    1. Ebnesajjad S. Handbook of Biopolymers and Biodegradable Plastics. Elsevier; Oxford, UK: 2013.

LinkOut - more resources