. 2020 Mar 25;12(4):771.
doi: 10.3390/cancers12040771.

VIRMA-Dependent N6-Methyladenosine Modifications Regulate the Expression of Long Non-Coding RNAs CCAT1 and CCAT2 in Prostate Cancer

Affiliations

VIRMA-Dependent N6-Methyladenosine Modifications Regulate the Expression of Long Non-Coding RNAs CCAT1 and CCAT2 in Prostate Cancer

Daniela Barros-Silva et al. Cancers (Basel). .

Abstract

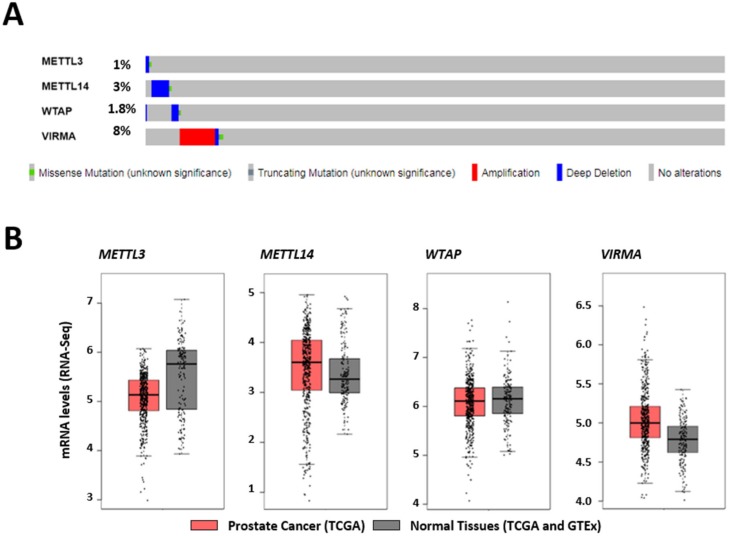
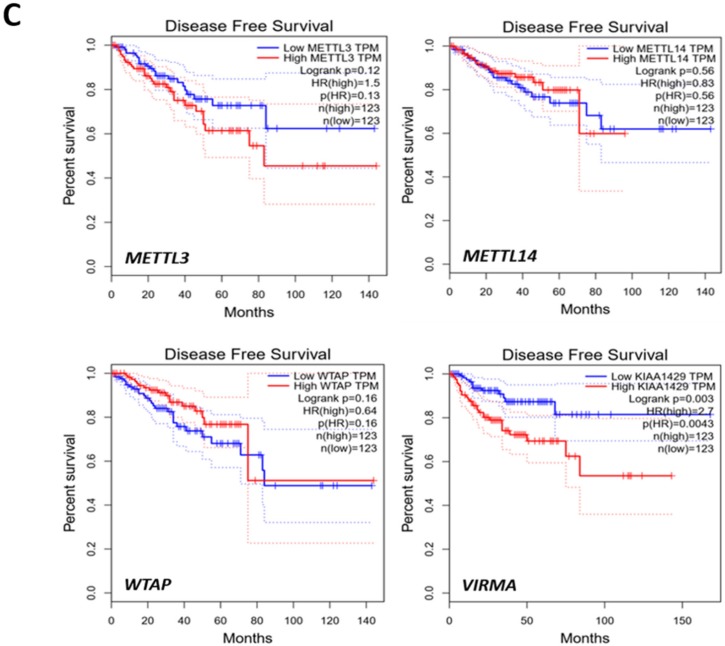
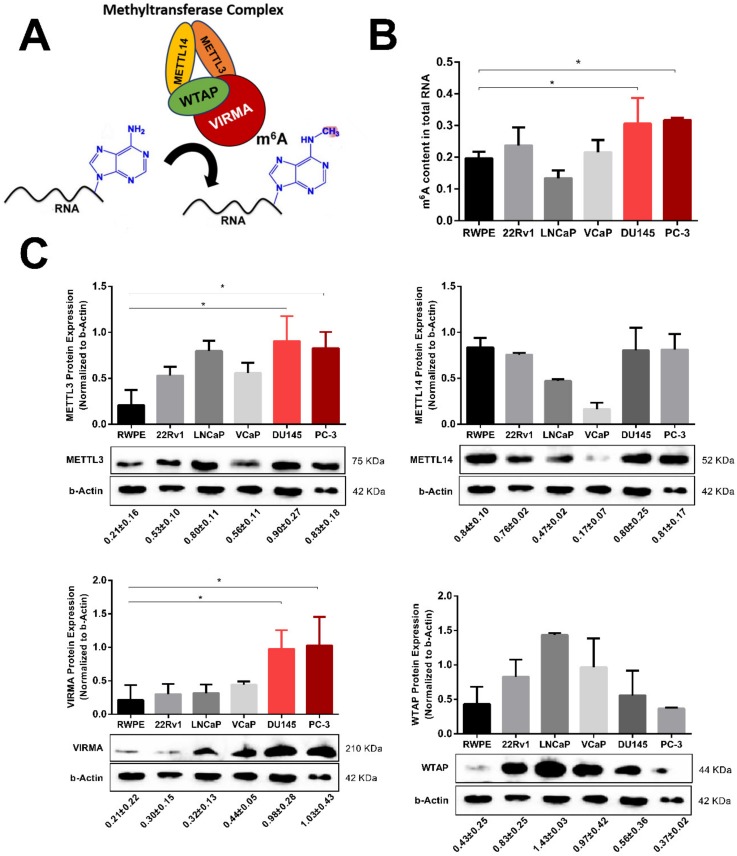
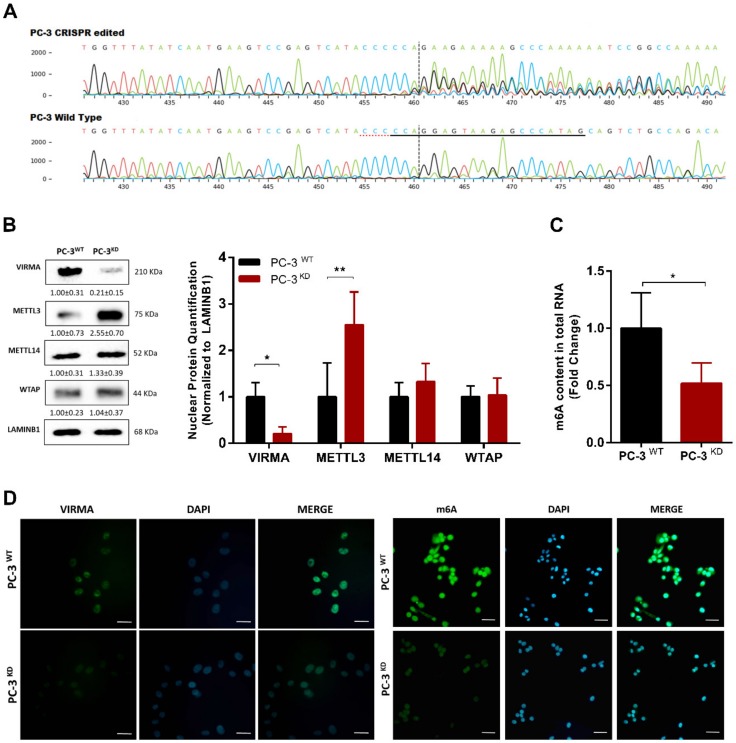
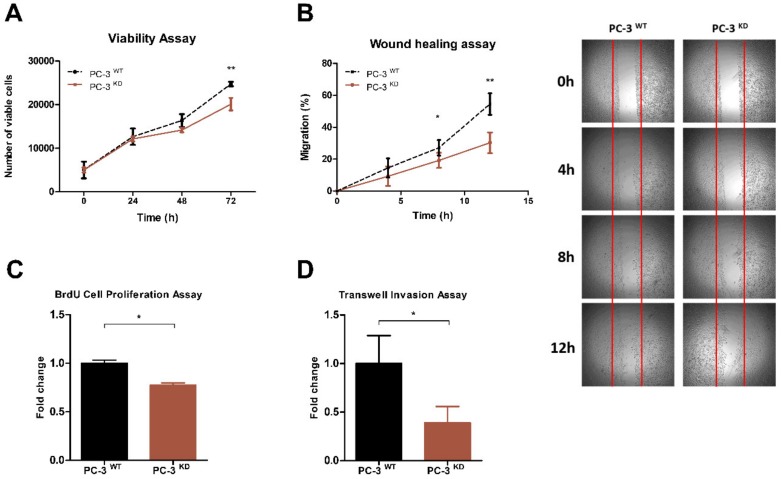
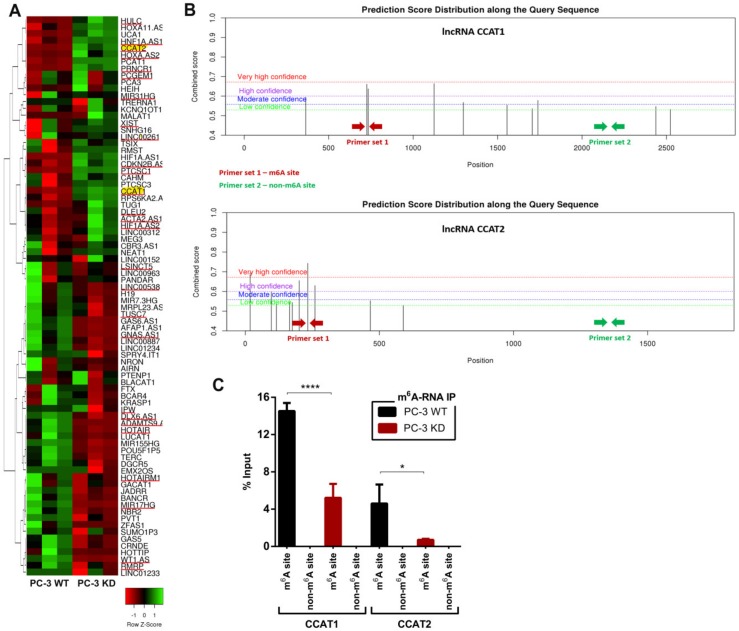
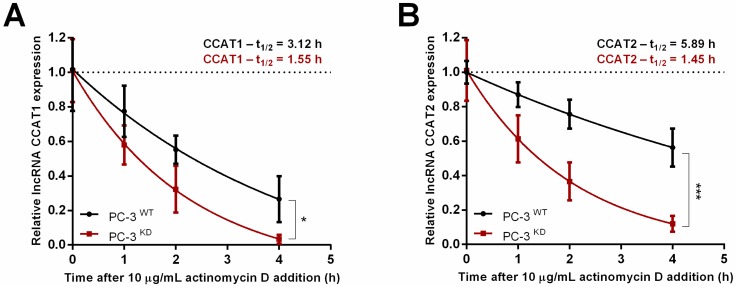
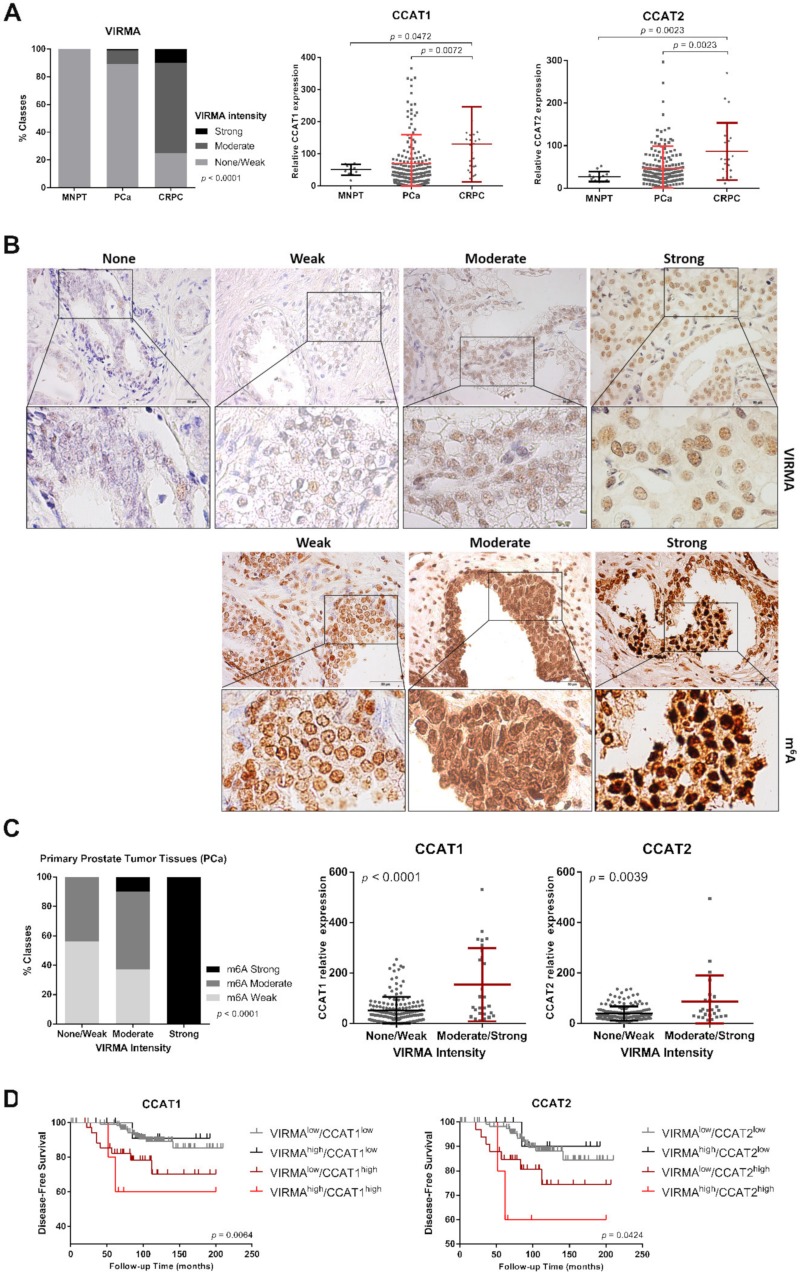
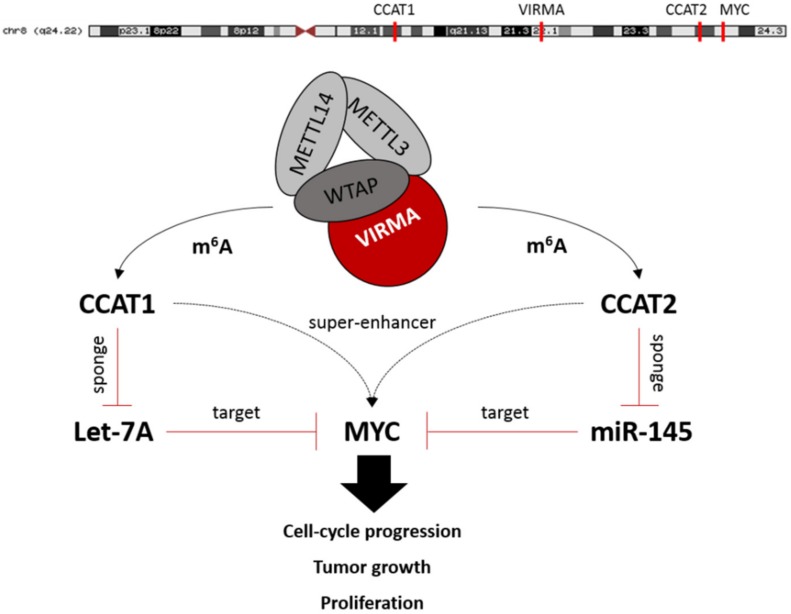
RNA methylation at position N6 in adenosine (m6A) and its associated methyltransferase complex (MTC) are involved in tumorigenesis. We aimed to explore m6A biological function for long non-coding RNAs (lncRNAs) in prostate cancer (PCa) and its clinical significance. m6A and MTC levels in PCa cells were characterized by ELISA and western blot. Putative m6A-regulated lncRNAs were identified and validated by lncRNA profiler qPCR array and bioinformatics analysis, followed by m6A/RNA co-immunoprecipitation. Impact of m6A depletion on RNA stability was assessed by Actinomycin D assay. The association of m6A-levels with PCa prognosis was examined in clinical samples. Higher m6A-levels and VIRMA overexpression were detected in metastatic castration-resistant PCa (mCRPC) cells (p < 0.05). VIRMA knockdown in PC-3 cells significantly decreased m6A-levels (p = 0.0317), attenuated malignant phenotype and suppressed the expression of oncogenic lncRNAs CCAT1 and CCAT2 (p < 0.00001). VIRMA depletion and m6A reduction decreased the stability and abundance of CCAT1/2 transcripts. Higher expression of VIRMA, CCAT1, and CCAT2 as a group variable was an independent predictor of poor prognosis (HR = 9.083, CI95% 1.911-43.183, p = 0.006). VIRMA is a critical factor sustaining m6A-levels in PCa cells. VIRMA downregulation attenuates the aggressive phenotype of PCa by overall reduction of m6A-levels decreasing stability and abundance of oncogenic lncRNAs.

Keywords: N6-Methyladenosine; VIRMA; epitranscriptome; long non-coding RNAs; prostate cancer.


Conflict of interest statement

The authors declare no conflict of interest.

Figures

Figure 1
Figure 1
VIRMA expression is increased in prostate cancer (PCa) and associates with tumor relapse. (A) Alteration frequency of METTL3, METTL14, WTAP, and VIRMA in PCa TCGA cohort (n = 492). (B) mRNA expression levels of m6A modifying enzymes in clinical tissue samples of The Cancer Genome Atlas (TCGA) and GTEx prostate adenocarcinoma (n = 492, red boxplot) and adjacent normal specimens (n = 152, grey boxplot). (C) Disease-free survival curves of patients with high mRNA expression (red line) and with low mRNA expression (blue line) (Mantel–Cox test).
Figure 1
Figure 1
VIRMA expression is increased in prostate cancer (PCa) and associates with tumor relapse. (A) Alteration frequency of METTL3, METTL14, WTAP, and VIRMA in PCa TCGA cohort (n = 492). (B) mRNA expression levels of m6A modifying enzymes in clinical tissue samples of The Cancer Genome Atlas (TCGA) and GTEx prostate adenocarcinoma (n = 492, red boxplot) and adjacent normal specimens (n = 152, grey boxplot). (C) Disease-free survival curves of patients with high mRNA expression (red line) and with low mRNA expression (blue line) (Mantel–Cox test).
Figure 2
Figure 2
m6A RNA methylation is increased in androgen-independent prostate cancer cells. (A) Schematic illustration representing the methyltransferase complex (MTC) subunits that establish the m6A methylation mark; (B) m6A modification levels of total RNA assessed by ELISA in normal prostate basal epithelium cells (RWPE) and 5 different PCa cell lines (22RV1, LNCaP, VCaP, Du145, PC-3); (C) Western blot analysis showing the protein levels of each of the MTC subunits in the same cells. Shown is the relative protein abundance (normalized to β-actin). Data are shown as means ± SD and are representative of at least three independent experiments. * p < 0.05, Mann–Whitney U test.
Figure 3
Figure 3
VIRMA knockdown in PC-3 cells caused global m6A reduction. (A) Sanger sequencing of PC-3 Wild Type (control) and CRISPR edited sequences in the regions around the guide sequence (the horizontal black underlined region represents the RNA guide sequence, the horizontal red underline is the PAM site and the vertical black dotted line represents the cut site); (B) Western blot quantification of the total amount of METTL3, METTL14, WTAP, and VIRMA in the nuclear protein fraction after VIRMA knockdown. Relative protein abundance was determined by normalization with LAMINB1. Bars represent mean ± SD based on 3 independent experiments, * p < 0.05, Mann–Whitney U test. (C) Global m6A modification levels in total RNA after VIRMA silencing in PC-3 cells, * p < 0.05 and ** p < 0.001, Mann–Whitney U test; (D) VIRMA expression and m6A levels assessed by confocal immunofluorescent assay (scale bar = 20 µm).
Figure 4
Figure 4
VIRMA expression promotes PC-3 cells growth and progression in vitro. (A) MTT assay for the number of viable PC-3WT and PC-3KD cells at 24 h, 48 h, and 72 h after seeding. (B) Quantitation of Wound-healing assay for PC-3WT and PC-3KD. Points and connecting line on the left panel represent the migration index of wound-healing assay over the course of 12 h. The distance migrated by PC-3KD cells is represented as relative to that migrated by PC-3WT cells in the same time period. Representative photos are shown in the panel on the right. (C) Proliferation of PC-3WT and PC-3KD cells assessed by BrdU assay at 24 h. (D) Invasion of PC-3WT and PC-3KD cells assessed by Matrigel transwell assay at 24 h. Column bars in (C) and (D) represent the average number of cells from 3 independent experiments. Error bars represent ± SD. ** p < 0.001 * p < 0.05, Mann–Whitney U test.
Figure 5
Figure 5
VIRMA expression endorses long non-coding RNAs (lncRNAs) expression in m6A-dependent way. (A) Heat map and clustering analysis of lncRNAs expression in PC-3WT and PC-3KD cells, 3 biological replicates per condition. The 27 lncRNAs differentially expressed are underline red and the selected ones are further highlighted in yellow; (B) Potential m6A binding sites at lncRNAs CCAT1 and CCAT2 predicted with high and very high confidence (red and purple lines) by SRAMP (http://www.cuilab.cn/sramp/) [19]. Red and green arrows indicate the regions corresponding to PCR amplicons used for lncRNA quantification in immunoprecipitation experiments; (C) Abundance CCAT1 and CCAT2 transcripts in m6A-RNA IP pools from PC-3WT and PC-3KD cells. After purification precipitated RNA was used as a template for reverse transcription and real-time PCR with primers as indicated in 5b. Data is represented as percentage of input; **** p < 0.0001 and * p < 0.05, Mann–Whitney U test.
Figure 6
Figure 6
m6A stabilizes CCAT1 and CCAT2 lncRNAs. VIRMA knockdown decreases the stability of lncRNA CCAT1 (A) and CCAT2 (B) in PC-3 cells upon treatment with Actinomycin D, * p < 0.05 and *** p < 0.0001, Sum of squares F test.
Figure 7
Figure 7
VIRMA, CCAT1, and CCAT2 are overexpressed in PCa tissues and associate with poor prognosis. (A) On the left, the contingency graph displaying the immunostaining intensity of VIRMA (chi-square test) and, on the right, the scatter plot representing the relative lncRNA expression (Mann–Whitney U test) in morphologically normal prostate tissue (MNPT), hormone-naïve PCa (PCa) and castration-resistant PCa (CRPC); (B) Representative images of VIRMA and m6A immunostaining in the IPO-Porto patient cohort; (C) m6A immunostaining intensity and relative lncRNA expression in hormone-naïve PCa tissues stratified according to VIRMA immunostaining intensity; (D) Kaplan–Meier survival curves of VIRMA and CCAT1/2, log-rank test.
Figure 8
Figure 8
Proposed mechanism of the interplay between the putative VIRMA-dependent m6A-regulated CCAT1/2 lncRNAs and MYC proto-oncogene.

References

    1. Rawla P. Epidemiology of Prostate Cancer. World J. Oncol. 2019;10:63. doi: 10.14740/wjon1191. - DOI - PMC - PubMed
    1. Esteller M., Pandolfi P.P. The epitranscriptome of noncoding RNAs in cancer. Cancer Discov. 2017;7:359–368. doi: 10.1158/2159-8290.CD-16-1292. - DOI - PMC - PubMed
    1. Meyer K.D., Jaffrey S.R. Rethinking m6A readers, writers, and erasers. Ann. Rev. Cell Dev. Biol. 2017;33:319–342. doi: 10.1146/annurev-cellbio-100616-060758. - DOI - PMC - PubMed
    1. Tong J., Flavell R.A., Li H.B. RNA m 6 A modification and its function in diseases. Front. Med. 2018;12:481–489. doi: 10.1007/s11684-018-0654-8. - DOI - PubMed
    1. Shi H., Wei J., He C. Where, when, and how: Context-dependent functions of RNA methylation writers, readers, and erasers. Mol. Cell. 2019;74:640–650. doi: 10.1016/j.molcel.2019.04.025. - DOI - PMC - PubMed

LinkOut - more resources