. 2020 Mar 26;11(1):1571.
doi: 10.1038/s41467-020-15357-y.

The secreted protease Adamts18 links hormone action to activation of the mammary stem cell niche

Affiliations

The secreted protease Adamts18 links hormone action to activation of the mammary stem cell niche

Dalya Ataca et al. Nat Commun. .

Abstract

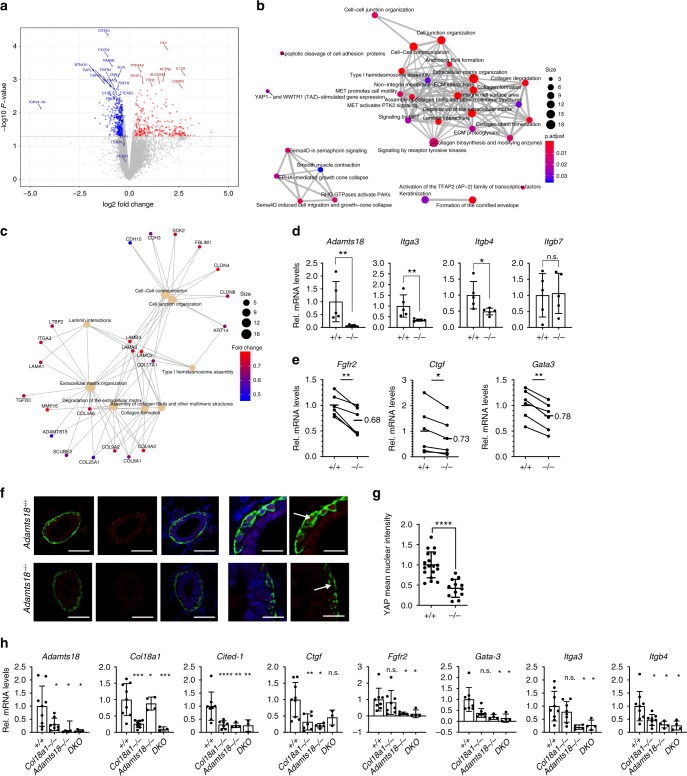
Estrogens and progesterone control breast development and carcinogenesis via their cognate receptors expressed in a subset of luminal cells in the mammary epithelium. How they control the extracellular matrix, important to breast physiology and tumorigenesis, remains unclear. Here we report that both hormones induce the secreted protease Adamts18 in myoepithelial cells by controlling Wnt4 expression with consequent paracrine canonical Wnt signaling activation. Adamts18 is required for stem cell activation, has multiple binding partners in the basement membrane and interacts genetically with the basal membrane-specific proteoglycan, Col18a1, pointing to the basement membrane as part of the stem cell niche. In vitro, ADAMTS18 cleaves fibronectin; in vivo, Adamts18 deletion causes increased collagen deposition during puberty, which results in impaired Hippo signaling and reduced Fgfr2 expression both of which control stem cell function. Thus, Adamts18 links luminal hormone receptor signaling to basement membrane remodeling and stem cell activation.


Conflict of interest statement

The authors declare no competing interests.

Figures

Fig. 1
Fig. 1. Adamts18 expression in the mouse mammary gland.
a Dot plot showing Adamts18 mRNA expression normalized to Hprt in FACS-sorted CD24+ CD49f− (luminal), CD24+ CD49f+ (myoepithelial) and CD24− CD49f− (stromal) cells. Data represent mean ± SD from n = 3 independent experiments. Student t-test, two-tailed. b Bar plot showing Adamts18 mRNA levels normalized to Hprt in mammary glands at different developmental stages. Each bar represents pool of 3 mice, mean ± SD for technical replicates. ce Representative micrographs showing Adamts18 mRNA localization in mouse mammary gland during puberty (c), adulthood (d) and pregnancy day 12.5 (e). Red dots represent Adamts18 in situ hybridization signal, green: α-Sma, blue: DAPI, arrows show myoepithelial cells; scale bar, 50 μm. f Relative Adamts18 transcript levels normalized to Krt5 in mammary glands from 6 control and 5 E2-treated mice. Data represent mean ± SD, unpaired Student t-test, two-tailed. g Dot plot showing plasma progesterone levels determined by LC/MS during diestrus (n = 10) or estrus (n = 9). Data represent mean ± SD, Student t-test, two-tailed. h Dot plot showing Adamts18 mRNA levels normalized to Krt5 in mammary glands from mice shown in g. Data represent mean ± SD, Student t-test, two-tailed. i Dot plot showing Adamts18 mRNA normalized to Hprt in 6 contralateral mammary glands transplanted with WT.EGFP+ or PR−/.EGFP+ epithelium. j Bar graph showing relative transcript expression of different Wnt signaling components normalized to Hprt in contralateral glands of 8 mice transplanted with WT.EGFP+ and PR−/.EGFP+ epithelia. Each data point represents one gland, mean ± SD, paired Student t-test, two-tailed. k Dot plots showing relative transcript levels of Wnt1, Axin2 and Adamts18 normalized to Hprt in mammary glands from 5 WT and 3 MMTV-Wnt1 virgin mice. Data represent mean ± SD, Student t-test, two-tailed. l Representative micrographs of Adamts18 mRNA localization, (red) dots, in mammary glands from 3 WT and 3 MMTV-Wnt1 females, α-Sma (green) and DAPI (blue); arrows show myoepithelial cells. Scale bar, 50 μm. m Dot plots showing mRNA levels of Wnt4 and Adamts18 normalized to Hprt in contralateral glands of 3 mice transplanted with WT.EGFP+ and Wnt4−/.EGFP+ epithelia harvested at 8.5-day of pregnancy. *p < 0.05; **p < 0.01; ***p < 0.001; ****p < 0.0001.
Fig. 2
Fig. 2. Mammary gland development in Adamts18−/ mice.
a Representative fluorescent stereo-micrographs of inguinal glands from 14-day-old prepubertal WT.EGFP+ and Adamts18−/.EGFP females; n = 5 and n = 3. Scale bar, 500 μm. b, c Dot plots indicating the percentage of fat pad filling and fold change of branching points on day 14 mammary glands from 5 WT.EGFP+ and 3 Adamts18−/.EGFP vs mice. Data represent mean ± SD unpaired Student t-test, two-tailed. d Representative fluorescent stereo-micrographs of inguinal glands from 4-week-old pubertal WT.EGFP+ and Adamts18−/.EGFP mice; n = 13 for each genotype. LN: subiliac lymph node. Arrows indicate TEBs; scale bar, 500 μm. eg Dot plots indicating percentage of fat pad filling, relative number of branching points and TEBs quantified at 4–6 weeks of age. Data represent mean ± SD from 13 WT.EGFP+ and 13 Adamts18−/.EGFP mice. Unpaired Student t-test, two-tailed. h Representative stereo micrographs of whole mounted inguinal glands from 7 WT and 7 Adamts18−/ 14-week-old virgin mice. Arrows point to side branches; scale bars, 500 μm. i Dot plot showing relative number of branching points. Data represent mean ± SD from 7 WT and 7 Adamts18−/ 14-week-old virgin mice. Unpaired Student t-test, two-tailed. j Representative micrographs of H&E-stained histological sections of mammary glands from 5-week-old WT and Adamts18−/ littermates, n = 4; scale bar, 50 μm. k Dot plot showing percentage of cleaved caspase 3+ cells in TEBs of WT and Adamts18−/ females. Data represent mean ± SD from 3 WT and 3 Adamts18−/ mice. Unpaired Student t-test, two-tailed. l Representative pHH3 (brown) IHC on mammary glands from 6-week-old WT and Adamts18−/ females; hematoxylin counterstain; scale bar, 50 μm. m Dot plot showing the percentage of pHH3+ positive cells in TEBs of 3 WT and 3 Adamts18−/ females. Data represent mean ± SD, unpaired Student t-test, two-tailed. *p < 0.05; **p < 0.01; ***p < 0.001; ****p < 0.0001, n.s. not significant.
Fig. 3
Fig. 3. Mammary epithelial-intrinsic role of Adamts18.
a Fluorescence stereo-micrographs of contralateral glands 6 weeks after engraftment with WT.EGFP+ or Adamts18−/.EGFP+ epithelia; scale bar, 500 μm. b Dot plot showing relative number of branching points in 14 contralateral WT.EGFP+ and Adamts18−/.EGFP+ epithelial outgrowths; 4 different donors were used. c Representative fluorescence stereo micrographs of contralateral glands engrafted with WT.EGFP+ or Adamts18−/.EGFP+ epithelium 12 weeks earlier. Scale bars, 500 μm (left), 150 μm (right). d Dot plot showing percentage of GFP+ cells obtained from WT.EGFP+ and Adamts18−/.EGFP+ contralateral grafts by flow cytometry. Tissue from 3 different donors was grafted to 6 pairs of contralateral fat pads. e Representative fluorescence stereo micrographs and micrographs of H&E-stained contralateral glands engrafted with WT.EGFP+ (top) and Adamts18−/.EGFP+ (bottom) epithelia from host at day 14.5 of pregnancy. Three different donors were used, (n = 4). Arrows show interductal spaces; Scale bars, 5 mm and 50 μm. f Representative fluorescence stereo micrographs of 4 pairs of contralateral glands engrafted with WT.EGFP+ and Adamts18−/.EGFP+ epithelia from host at lactation, 3 different donors were used in 3 independent experiments. H&E-stained micrographs thereof; scale bar, 50 μm. g Dot plots showing quantification of areas between branches from 4 pairs of contralateral glands at day 14.5 of pregnancy and 3 pairs of contralateral glands at post-partum. h Dot plots showing relative transcript levels of Lactalbumin, Whey Acidic Protein (WAP), Casein A normalized to Krt18, in contralateral glands transplanted with WT.EGFP+ and Adamts18−/.EGFP+ epithelia. Host is 14.5-day pregnant. Each pair of points represents an individual mouse; n = 4. i Representative micrographs showing IHC for ER on contralaterally engrafted WT.EGFP+ and Adamts18−/.EGFP+ epithelia. Scale bar, 100 μm. Dot plot showing percentage of ER+ luminal cells in 9 contralateral grafts. j PR staining on contralateral glands engrafted with WT.EGFP+ and Adamts18−/.EGFP+ epithelia. Scale bar, 50 μm. Dot plot showing percentage of PR+ luminal cells in 10 contralateral grafts. Statistical analysis by paired Student t-test, two-tailed. *p < 0.05; **p < 0.01; ***p < 0.001; ****p < 0.0001, n.s. not significant.
Fig. 4
Fig. 4. Role of Adamts18 in the regenerative capacity of the mammary epithelium.
a Representative FACS dot plot showing CD49f and CD24 expression in the Lin mammary cells from 14-week-old WT and Adamts18−/ littermates. b Relative number of cells isolated from 15 14-week-old WT and Adamts18−/ littermates. c, d Dot plots showing lineage negative mammary cell populations from the mammary glands of 14-week-old WT and Adamts18−/ littermates. Data represent mean ± SD from 18 WT and 15 Adamts18−/ mice. Unpaired Student t-test, two-tailed. Total number of cells (b), percentage of luminal, myoepithelial, stromal cells (c), CFC and MRUs (d). Data represent mean ± SD from 18 WT and 15 Adamts18−/ mice. Unpaired Student t-test, two-tailed. e Table showing mammary outgrowths derived from WT.EGFP+ and Adamts18−/.EGFP+ mammary cells injected at limiting dilutions into cleared contralateral fat pads. Positive outgrowths are defined as >5% fat pad area filled and related to total number of transplants. Repopulating cell frequency is shown, data are pooled from 3 independent experiments. f Fluorescence stereo-micrographs of contralateral mammary fat pads of recipient mice at the 5th generation of serial transplant after 8–12 weeks; scale bar, 500 μm. g Micrographs of H&E- stained histological sections of 4th generation transplants; scale bar, 50 μm. h Table summarizing 3 independent serial transplant experiments with WT.EGFP+ and Adamts18−/.EGFP+ epithelia. Each engrafted gland is represented by a micrograph; black sectors represent area of fat pad filled by grafted epithelium. i Box plot showing extent of fat pad filling of contralateral grafts in each transplant generation. Boxes span the 25th to 75th percentile, whiskers 1.5 times the interquartile range. p-Values were determined by Wilcoxon test. *p < 0.05; **p < 0.01; ***p < 0.001; ****p < 0.0001, n.s. not significant.
Fig. 5
Fig. 5. BM proteins and glycoproteins are involved in stem cell function.
a Venn diagram showing candidate ADAMTS18 binding proteins in the supernatant of MCF10A cells identified by affinity purification mass spectrometry. Gene names are shown in boxes for ease of recognition. Three independent experiments were done at different times. b Bar graph showing the top 20 METACORE processes of candidate ADAMTS18 binding partners based on p-values. c Bar graph showing top 20 METACORE localizations of candidate ADAMTS18 binding partners based on p-values. d Fluorescent stereo micrographs of representative 4th gland from WT.EGFP+, Col18a1−/.EGFP+, Adamts18−/.EGFP+ and double-deficient (DKO).EGFP+ 6-week-old pubertal mice; n = 5, 4, 7 and 4. Arrows indicate TEBs, scale bar, 500 μm. e Dot plots indicating the relative TEB numbers, percentage of fat pad filling, and relative branching points at 6 weeks of age. Data represent mean ± SD from 5 WT, 4 Col18a1−/, 7 Adamts18−/, and 4 DKO mice. One-way analysis of variance (ANOVA). f Fluorescence stereo-micrographs of contralateral mammary fat pads of Rag1−/ recipient mice with 4th-generation mammary outgrowths derived from WT.EGFP+ and DKO.EGFP+ donor mice after 8–12 weeks; scale bar, 500 μm and H&E-stained sections thereof, scale bar 100 μm. g Table summarizing 3 independent serial transplant experiments with WT.EGFP+ and DKO.EGFP+ epithelia. Each engrafted gland is represented by a micrograph; black sectors represent the area of the fat pad filled by engrafted epithelium. h Box plot showing extent of fat pad filling of WT.EGFP+ and DKO.EGFP+ contralateral grafts in each transplant generation. Boxes span the 25th to 75th percentile, whiskers 1.5 times the interquartile range. p-Values were determined by Wilcoxon test. *p < 0.05; **p < 0.01; ***p < 0.001; ****p < 0.0001, n.s. not significant.
Fig. 6
Fig. 6. Biochemical changes and Fibronectin cleavage elicited by Adamts18.
a Representative picrosirius red staining for fibrillar collagen (red) on 4th mammary gland sections from 5-week-old, pubertal WT and Adamts18−/ littermates; n = 5. Scale bar, 100 μm. b Representative western blot analysis on 3rd mammary glands of 5-week-old, pubertal WT and Adamts18−/ littermates; n = 4. β-actin loading control, MW marker in red. c Dot plots showing relative protein levels of laminin, collagen I, collagen IV, and fibronectin normalized to actin in 4 pubertal WT and Adamts18−/ littermates. Paired Student t-test, two-tailed; **p < 0.01. d, Fluorescent micrographs showing IF on 4th mammary gland sections from 5-week-old, pubertal WT and Adamts18−/ littermates for laminin, collagens I and IV as well as fibronectin (green) and DAPI nuclear stain (blue), n = 3. Arrows point to ECM density around TEBs or ducts; scale bar, 100 μm. e Representative western blot analysis on 3rd mammary glands of 14-week-old WT and Adamts18−/ littermates; n = 3. β-actin loading control, MW marker in red. f Dot plots showing relative protein levels of laminin, collagen I, collagen IV, and fibronectin normalized to actin in 3 adult WT and Adamts18−/ littermates. Paired Student t-test, two-tailed; n.s. not significant. g Dot plot showing relative transcript levels of Fn1 normalized to Hprt in 3rd mammary glands from 6 pairs of 5-week-old WT and Adamts18−/ littermates. Paired Student t-test, two-tailed, n.s. not significant. h Representative Western blot analysis of 3 independent experiments in which fibronectin (FN)−70K was incubated with purified active Adamts18 in the presence or absence of EDTA and/or protease inhibitor (PI). Anti-FN antibody specific to the N-terminal heparin-binding domain. i Western blot analysis of FN1-70K incubated with ADAMTS18 overexpressing HEK-293T cells in the presence or absence of EDTA. j Bar graph showing levels of cleaved FN in supernatants from control transfected and Adamts18 overexpressing HEK-293T cells in 2 independent experiments.
Fig. 7
Fig. 7. Adamts18 impinges on transcription and regulates cell signaling.
a Volcano plot showing genes, which are differentially expressed between contralateral glands transplanted with Adamts18−/ and WT epithelia; n = 3, Kolmogorov–Smirnov test, all highlighted genes have p-values < 0.05. Genes with log2(FC) >0.5 in red and log2FC <0.5 in blue. Names of selected genes are indicated. b Enrichment map plot of Reactome pathway analysis (ReactomePA) on genes downregulated in 3 pairs of contralateral glands engrafted with WT and Adamts18−/ epithelia in 3 independent experiments with 3 different donors. c CNE plot of ReactomePA of genes down regulated in contralateral glands transplanted with WT and Adamts18−/ epithelia. d Bar graphs showing relative transcript levels of Adamts18, Itga3, Itgb4, and Itgbt, normalized to Hprt in 5 pubertal host mice bearing contralateral transplants of WT and Adamts18−/ epithelia. Data represent mean ± SD. Unpaired Student t-test, two-tailed. e Bar graphs showing relative transcript levels of Fgfr2, Ctgf, and Gata3 normalized to Hprt in contralateral glands transplanted with WT and Adamts18−/ epithelia, n = 6. f Representative IF for Sma (green) and YAP (red) counterstained with DAPI (blue) of 4th mammary gland sections from 5-week-old WT and Adamts18−/ littermates; n = 3. Arrows indicate YAP positive nuclei of myoepithelial cells. g Dot plot showing quantification of relative mean intensity of nuclear YAP detected in myoepithelial cells of 5-week-old WT and Adamts18−/ littermates; n = 3. Each point represents an individual TEB. h Bar graphs showing relative transcript levels of Adamts18, Col18a1, Cited-1, Ctgf, Fgfr2, Gata-3, Itga3, and Itgb4, normalized to Hprt in pubertal WT, Col18a1−/, Adamts18−/, and DKO; n = 9, 8, 4, and 4, respectively. Data represent mean ± SD, one-way ANOVA. *p < 0.05; **p < 0.01; ***p < 0.001; ****p < 0.0001, n.s. not significant.
Fig. 8
Fig. 8. ADAMTS18 expression and distribution in the human breast epithelium.
a Representative micrographs of normal human breast tissue from 5 different women stained with luminal cell marker CK7, myoepithelial cell marker P63 and anti-ADAMTS18, counterstained with hematoxylin. Scale bar, 100 μm. b Experimental scheme: dissociated human breast epithelial cells from reduction mammoplasties were injected via the teat into the milk duct system of NSG female mice and establish themselves there. c LC/MS measured serum progesterone levels in mice 60 days after implantation with pellets containing vehicle, 20 or 50 mg progesterone. Data represent mean ± SD from n = 10 (vehicle), n = 7 (20 mg), and n = 4 (50 mg); one-way ANOVA. d Dot plot showing Adamts18 transcript levels as measured by semi qRT-PCR normalized to the geometric mean of Hprt and Gapdh in mammary glands from mice that were subcutaneously engrafted with pellets containing either vehicle (0) or 20 or 50 mg progesterone for 60 days. Data represent mean ± SD from n = 10 (vehicle), n = 7 (20 mg), and n = 4 (50 mg); one-way ANOVA. e Dot plot showing relative ADAMTS18 transcript levels normalized to GAPDH in glands xenografted with human breast epithelial cells from 4 mammoplasty specimens. Recipient mice were either implanted with vehicle- or 20 mg progesterone-containing pellets. Paired t-test, two-tailed. *p < 0.05; **p < 0.01; ***p < 0.001; ****p < 0.0001.
Fig. 9
Fig. 9. Working model of Adamts18 as a modulator of mammary gland development.
A schematic representation of the mammary acinar wall shows the spatial relationship between luminal cells, myoepithelial cells, BM and the surrounding interstitial ECM. Estrogen and progesterone induce Adamts18 production in myoepithelial cells via Wnt4-stimulated canonical Wnt signaling. Adamts18 remodels the BM and/or interstitial ECM, as part of the stem cell niche to ensure optimal stem cell regenerative capacity. Loss of Adamts18 alters the stem cell niche and decreases mammary epithelial regenerative potential as its essential ECM modulatory function is abrogated.

References

    1. Clarke RB, Howell A, Potten CS, Anderson E. Dissociation between steroid receptor expression and cell proliferation in the human breast. Cancer Res. 1997;57:4987–4991. - PubMed
    1. Brisken C, Duss S. Stem cells and the stem cell niche in the breast: an integrated hormonal and developmental perspective. Stem Cell Rev. 2007;3:147–156. doi: 10.1007/s12015-007-0019-1. - DOI - PubMed
    1. Beleut M, et al. Two distinct mechanisms underlie progesterone-induced proliferation in the mammary gland. Proc. Natl. Acad. Sci. USA. 2010;107:2989–2994. doi: 10.1073/pnas.0915148107. - DOI - PMC - PubMed
    1. Ciarloni L, Mallepell S, Brisken C. Amphiregulin is an essential mediator of estrogen receptor function in mammary gland development. Proc. Natl. Acad. Sci. USA. 2007;104:5455–5460. doi: 10.1073/pnas.0611647104. - DOI - PMC - PubMed
    1. Shiah Y-J, et al. A progesterone-CXCR4 axis controls mammary progenitor cell fate in the adult gland. Stem Cell Rep. 2015;4:313–322. doi: 10.1016/j.stemcr.2015.01.011. - DOI - PMC - PubMed

Publication types

MeSH terms