. 2020 Mar 26;10(1):5507.
doi: 10.1038/s41598-020-62319-x.

Evaluating the potential of hyperpolarised [1-13C] L-lactate as a neuroprotectant metabolic biosensor for stroke

Affiliations

Evaluating the potential of hyperpolarised [1-13C] L-lactate as a neuroprotectant metabolic biosensor for stroke

Jean-Noël Hyacinthe et al. Sci Rep. .

Abstract

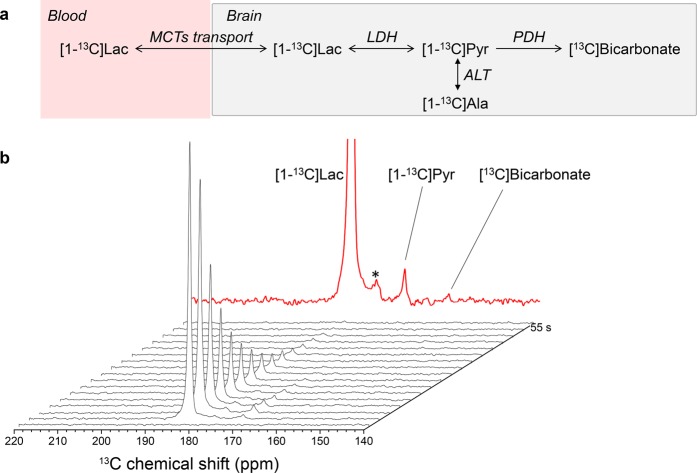
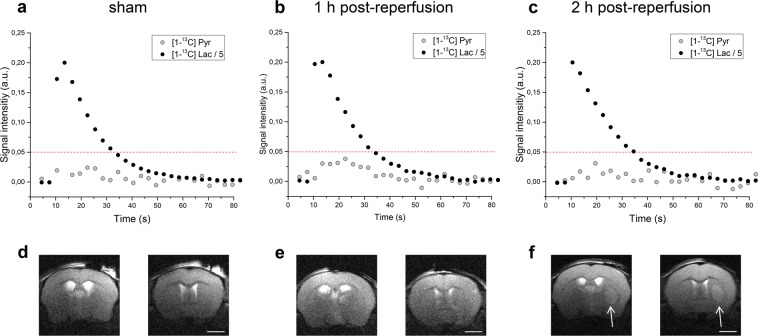
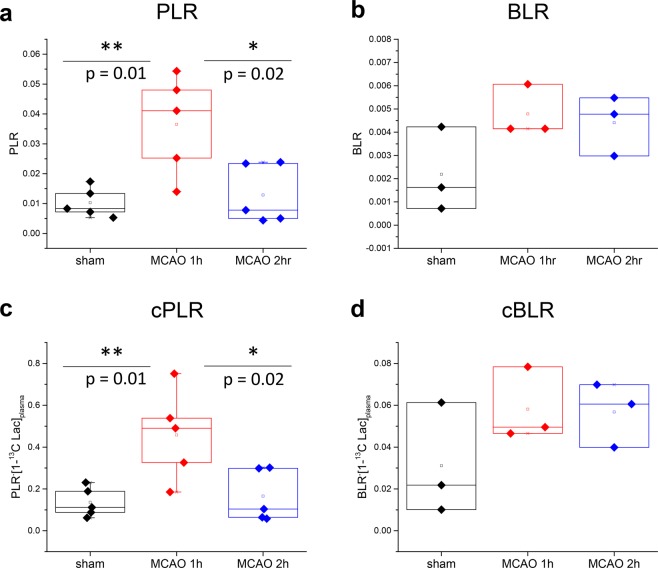
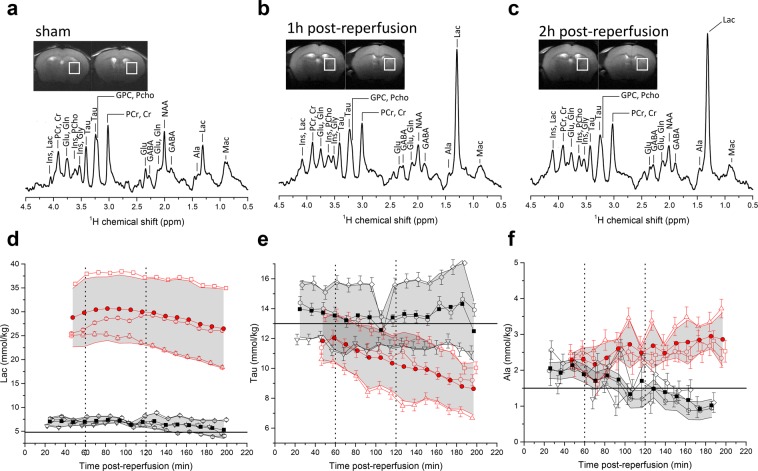
Cerebral metabolism, which can be monitored by magnetic resonance spectroscopy (MRS), changes rapidly after brain ischaemic injury. Hyperpolarisation techniques boost 13C MRS sensitivity by several orders of magnitude, thereby enabling in vivo monitoring of biochemical transformations of hyperpolarised (HP) 13C-labelled precursors with a time resolution of seconds. The exogenous administration of the metabolite L-lactate was shown to decrease lesion size and ameliorate neurological outcome in preclinical studies in rodent stroke models, as well as influencing brain metabolism in clinical pilot studies of acute brain injury patients. The aim of this study was to demonstrate the feasibility of measuring HP [1-13C] L-lactate metabolism in real-time in the mouse brain after ischaemic stroke when administered after reperfusion at a therapeutic dose. We showed a rapid, time-after-reperfusion-dependent conversion of [1-13C] L-lactate to [1-13C] pyruvate and [13C] bicarbonate that brings new insights into the neuroprotection mechanism of L-lactate. Moreover, this study paves the way for the use of HP [1-13C] L-lactate as a sensitive molecular-imaging biosensor in ischaemic stroke patients after endovascular clot removal.


Conflict of interest statement

The authors declare no competing interests.

Figures

Figure 1
Figure 1
(a) Simplified scheme of the cerebral metabolism of HP [1-13C] lactate. (b) Dynamic 13C MRS spectra measured in the head of an MCAO mouse following the injection of HP [1-13C] lactate (183.5 ppm). The transfer of the label to [1-13C] pyruvate at 171.5 ppm can be readily detected. In the sum of the spectra shown in the top panel (red), the peak of 13C bicarbonate becomes visible at 161.5 ppm. The peak designated by (*) at 176 ppm results from chemical impurities that overlap with the expected [1-13C] alanine peak.
Figure 2
Figure 2
Representative in vivo time courses of [1-13C] lactate (black) and its metabolic product [1-13C] pyruvate (grey) in the brain of sham operated mice (a) and of mice at different times after ischaemia onset (b,c). Each time course was normalised to the respective maximal lactate signal. The red dotted line was added to highlight the differences in [1-13C] pyruvate labelling. The corresponding T2W axial images of the brains of sham operated mice (d) and mice at different time points after ischaemia onset (e,f) are presented at the bottom of each time course. While a clear lesion can be detected 2 h post-reperfusion (f, white arrow), the morphological modifications are still obscured at 1 h post-reperfusion (e). Images acquired ca. 5 min before the infusion of HP [1-13C] lactate, showing two axial slices out of 14 one mm thickness slices. Other experimental parameters: effective echo time and repetition time: TEeff/TR = 52/4000 ms, 2 scans, 18 mm × 18 mm FOV with matrix size 256 × 256. Scalebar: 2 mm.
Figure 3
Figure 3
(a,c) Pyruvate-to-lactate ratios (PLR) and ratios corrected for [1-13C] lactate concentration in blood at the time of injection (cPLR), overlaid with individual data points. One-way ANOVA test indicates significant statistical difference (p < 0.05) between both PLR and cPLR 1 h post-reperfusion (red) and sham (black) and 2 h post-reperfusion (blue). The average values for cPLR were 0.46 ± 0.21, 0.17 ± 0.12 and 0.14 ± 0.07 in MCAO mice 1 h and 2 h post-reperfusion and sham respectively. (b,d) Bicarbonate-to-lactate ratios (BLR) and ratios corrected for [1-13C] lactate concentration in blood at the time of injection (cBLR) overlaid with individual data points showing a trend for increased BLR and cBLR in MCAO mice 1 h (red) and 2 h post-reperfusion (blue) compared to sham (black). The average values for cBLR were 0.058 ± 0.018, 0.057 ± 0.015 and 0.031 ± 0.027 in MCAO mice 1 h and 2 h post-reperfusion and sham respectively.
Figure 4
Figure 4
(a–c) Representative 1H spectra and voxel position in the striatum of sham mice and MCAO mice 1 h and 2 h post-reperfusion. (d–f) Time course of selected metabolites after 30 min MCAO surgery (red) and sham operated mice (black); time zero indicates the beginning of reperfusion. Open symbols are individual animals, with Cramer-Rao lower bounds (CRLB) of the LC-model quantification as error bars. Full red circles are the average of all three MCAO animals and full black squares are the average of all three shams -with the grey area representing the corresponding standard deviation. Horizontal lines that designate the metabolite concentration in healthy 8-week C57BL6/J mice as reported by Tkac et al. were added to guide the eye on the dynamic evolution of the metabolite concentrations. Vertical lines indicate the times at which HP lactate was injected in the HP 13C MRS measurements.
Figure 5
Figure 5
Changes in MCT expression patterns after ischaemia-reperfusion. The images in red in the upper panels show the expression of lactate transporters MCT1 (a), MCT2 (b) and MCT4 (c) in the striatum of sham animals and in the striatum ipsilateral and contralateral to the lesion of MCAO mice at 1 h or 2 h post-reperfusion. The lower panels show the merged images of the triple immunolabelling of the MCTs (red) with the neuronal marker MAP-2 (green) to identify the lesion area (i.e. loss of MAP-2 staining), the endothelial cell marker CD31 to identify blood vessels (grey) and the nuclear counterstaining (DAPI, blue). Arrowheads indicate blood vessels. Arrows in (c) indicate patches of high MCT4 expression. Scalebar: 100 μm.

References

    1. Johnson W, Onuma O, Owolabi M, Sachdev S. Stroke: a global response is needed. Bulletin of the World Health Organization. 2016;94:634–634A. doi: 10.2471/BLT.16.181636. - DOI - PMC - PubMed
    1. Campbell BC, et al. Endovascular therapy for ischemic stroke with perfusion-imaging selection. The New England journal of medicine. 2015;372:1009–1018. doi: 10.1056/NEJMoa1414792. - DOI - PubMed
    1. Sandercock P, et al. The benefits and harms of intravenous thrombolysis with recombinant tissue plasminogen activator within 6 h of acute ischaemic stroke (the third international stroke trial [IST-3]): a randomised controlled trial. Lancet. 2012;379:2352–2363. doi: 10.1016/S0140-6736(12)60768-5. - DOI - PMC - PubMed
    1. Saver JL, et al. Time to Treatment With Endovascular Thrombectomy and Outcomes From Ischemic Stroke: A Meta-analysis. Jama. 2016;316:1279–1288. doi: 10.1001/jama.2016.13647. - DOI - PubMed
    1. Thomalla G, Gerloff C. Acute imaging for evidence-based treatment of ischemic stroke. Current opinion in neurology. 2019 doi: 10.1097/WCO.0000000000000716. - DOI - PubMed

Publication types

MeSH terms