. 2020 Jul 9;136(2):210-223.
doi: 10.1182/blood.2019001417.

Integrin α6 mediates the drug resistance of acute lymphoblastic B-cell leukemia

Affiliations

Integrin α6 mediates the drug resistance of acute lymphoblastic B-cell leukemia

Eun Ji Gang et al. Blood. .

Abstract

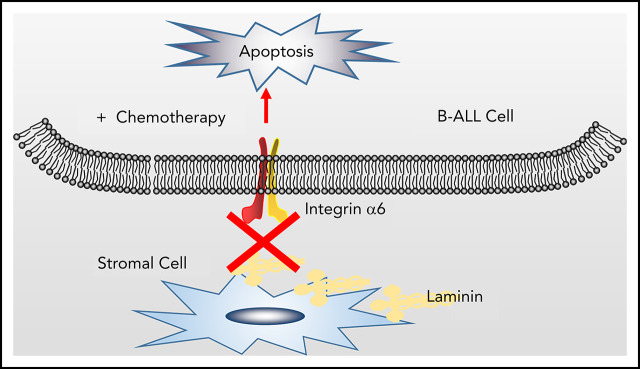
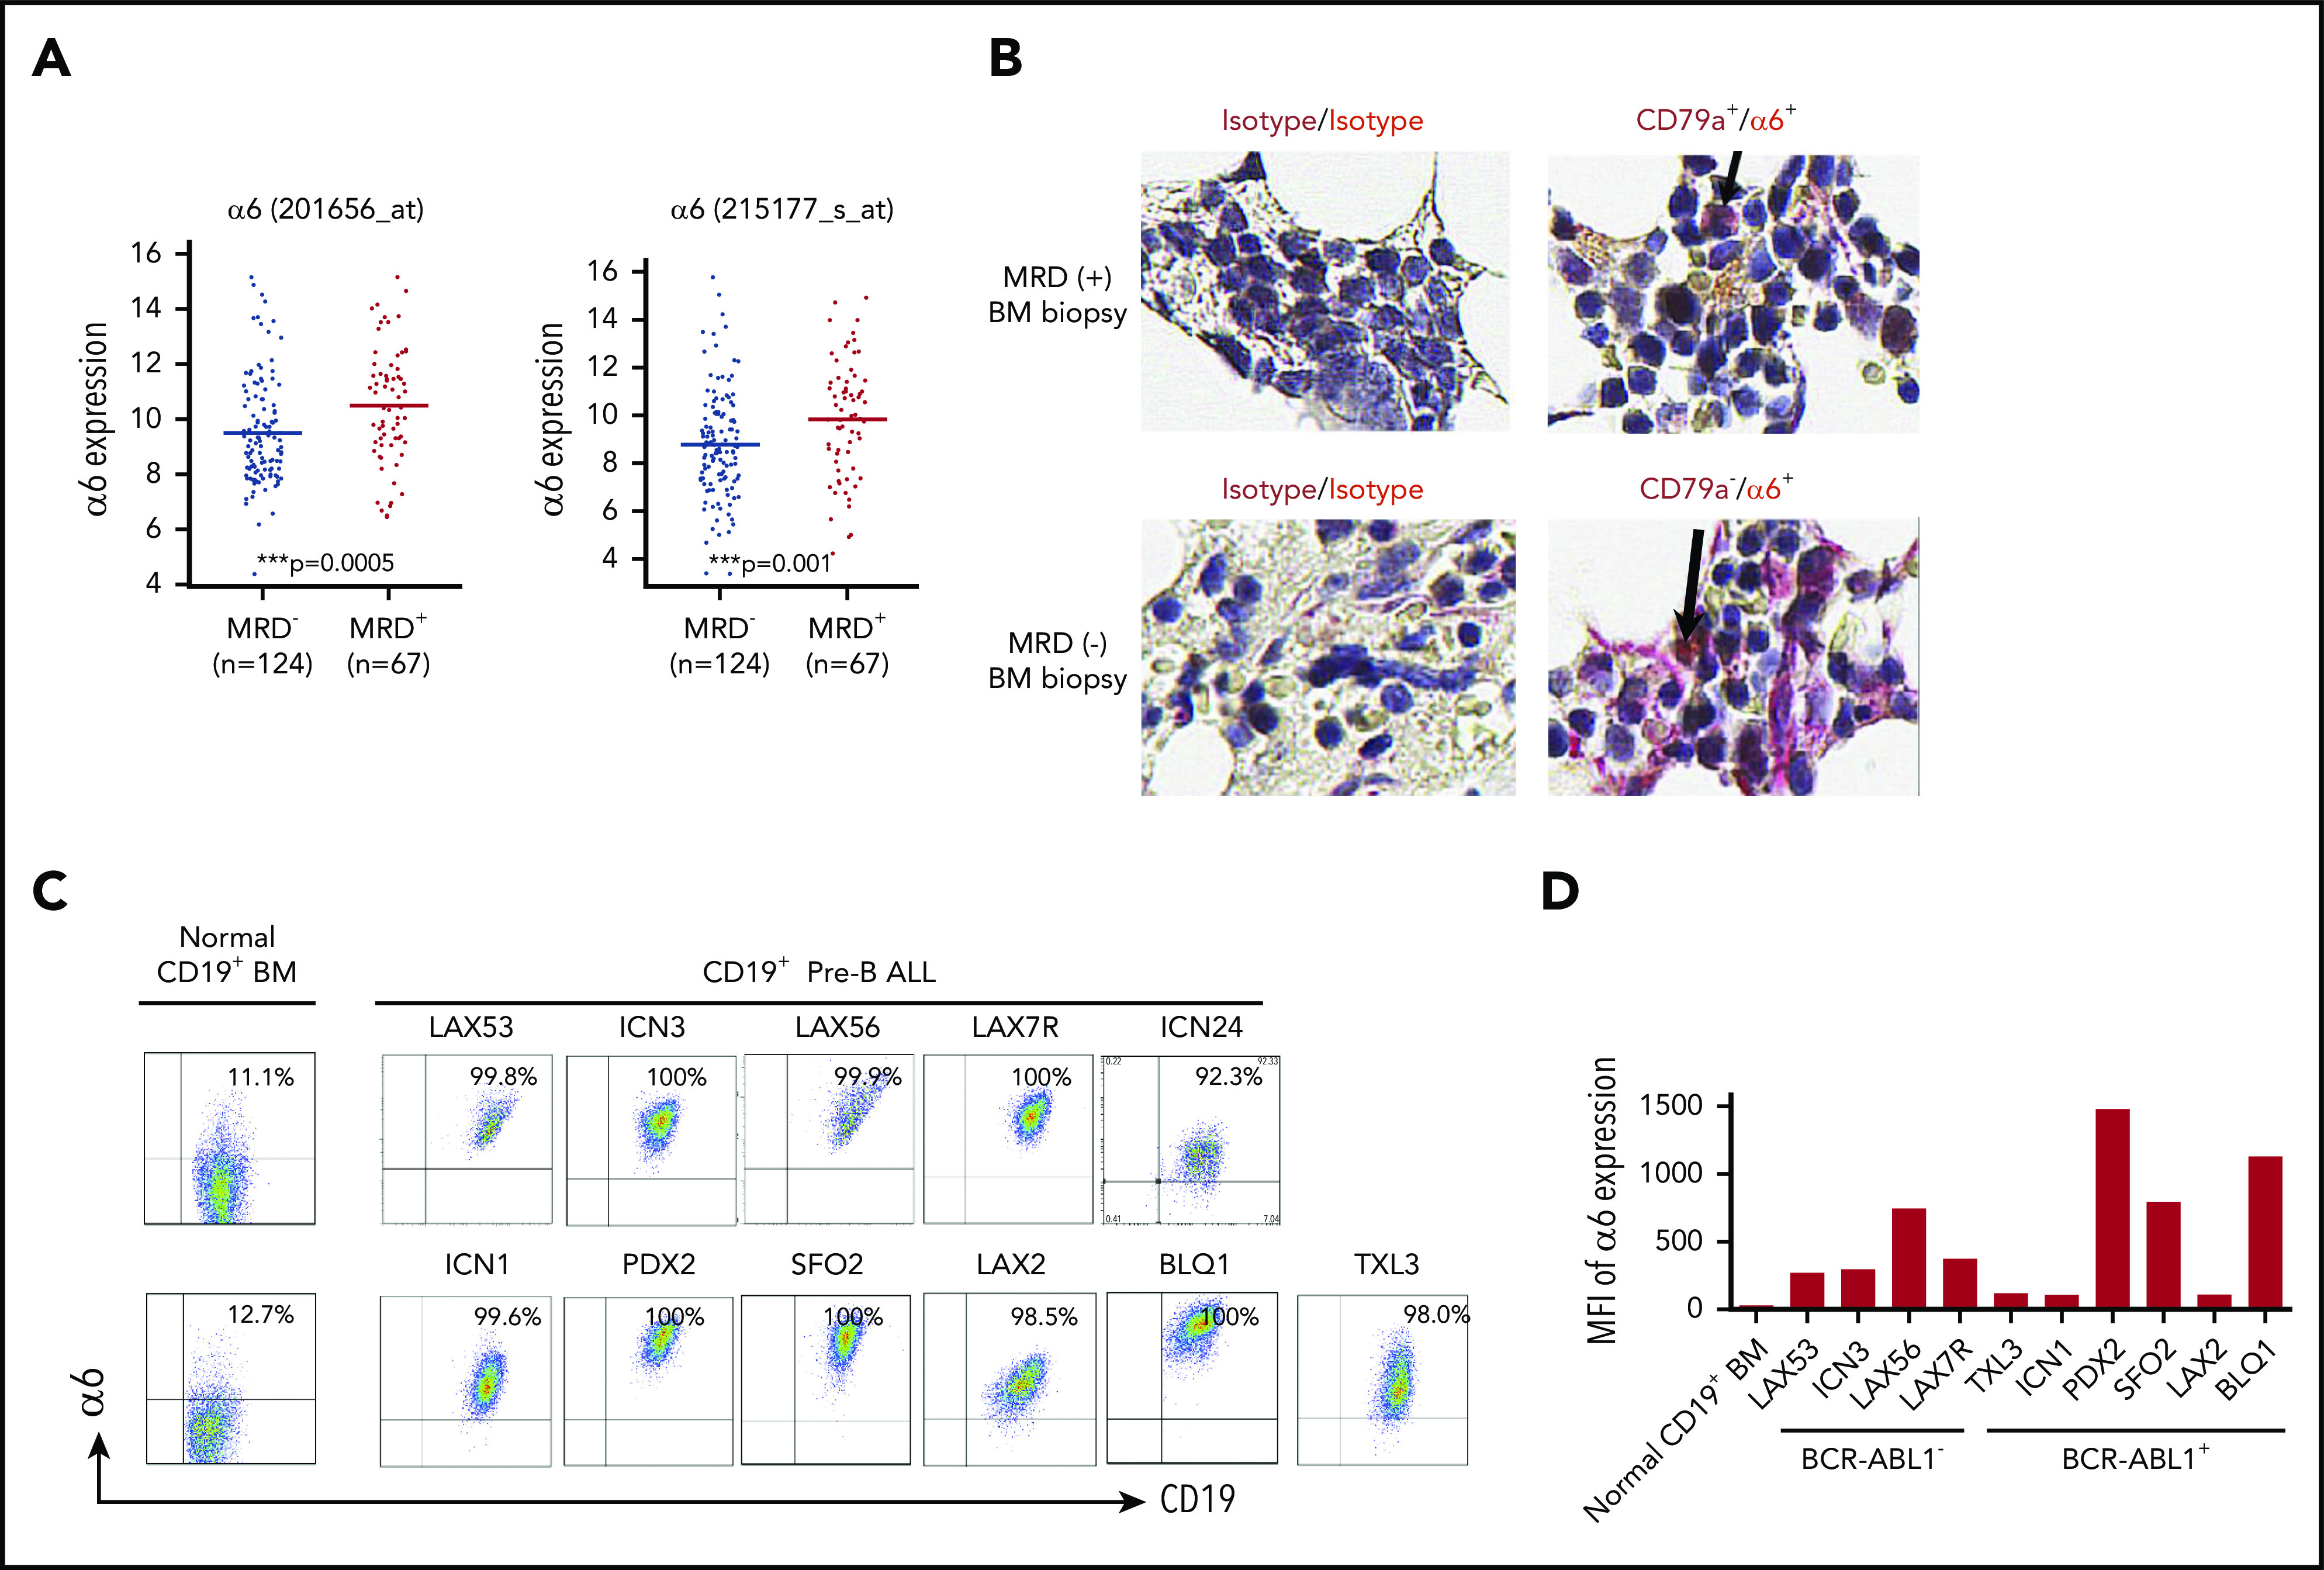
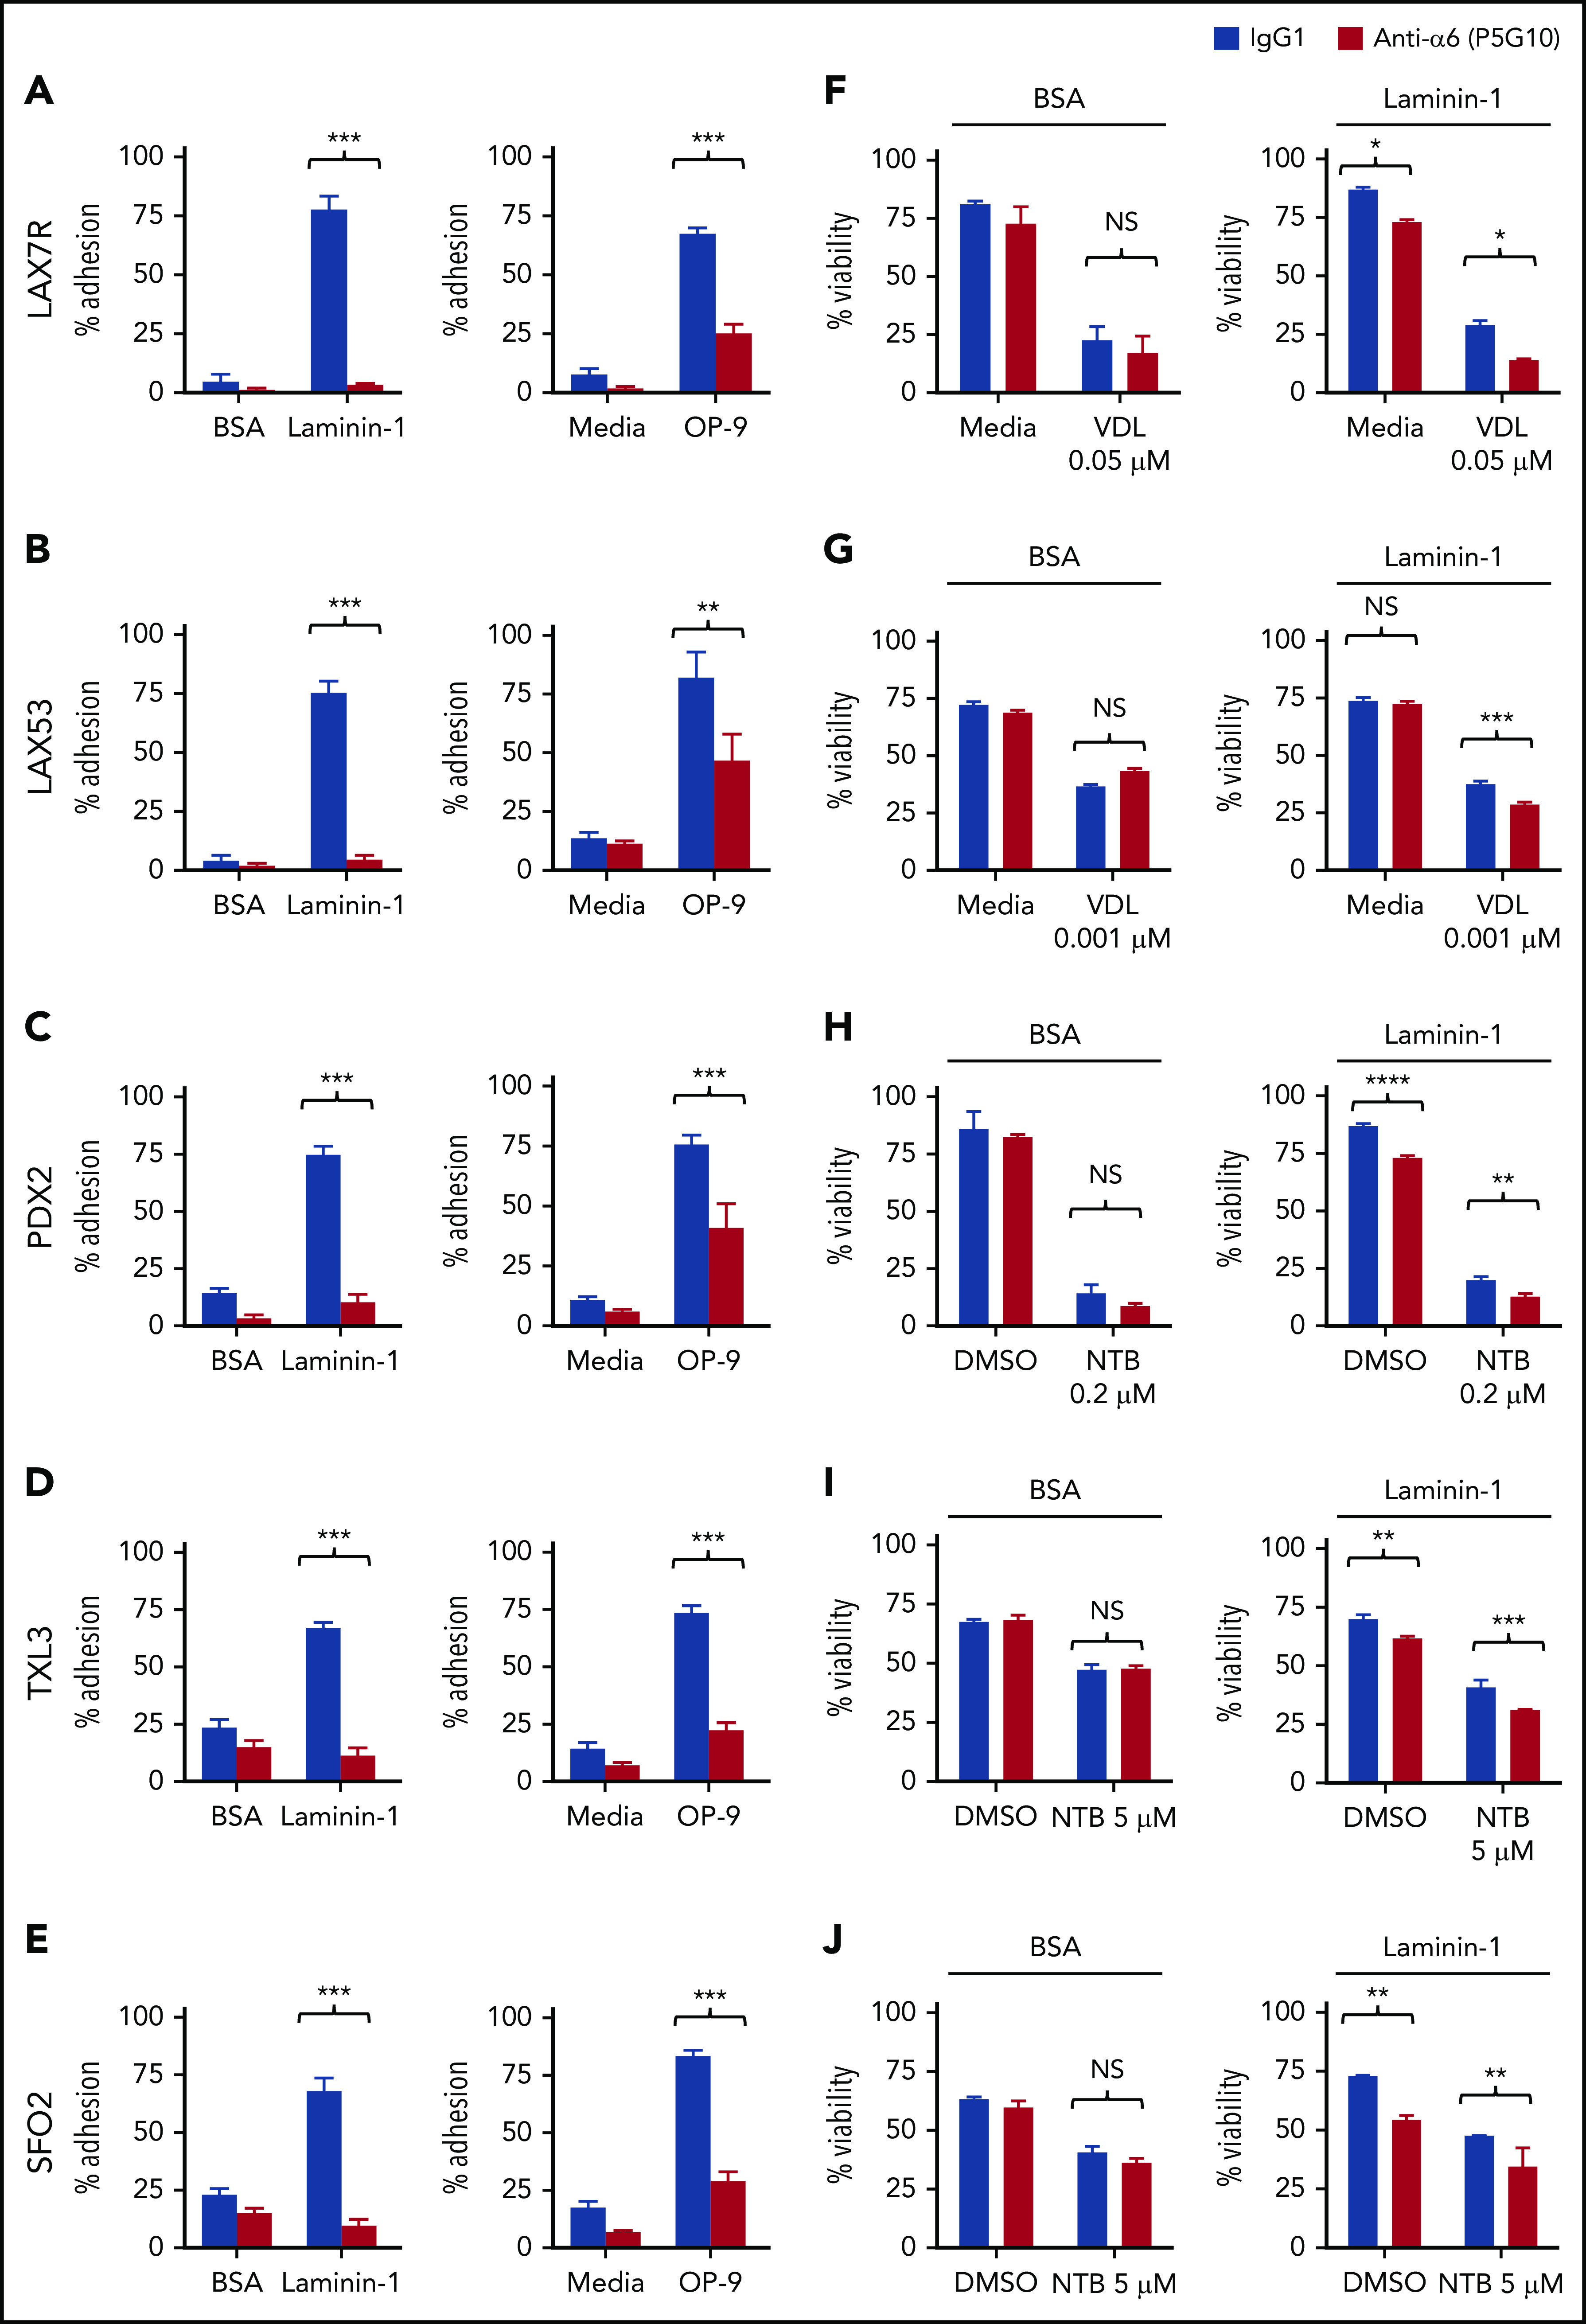
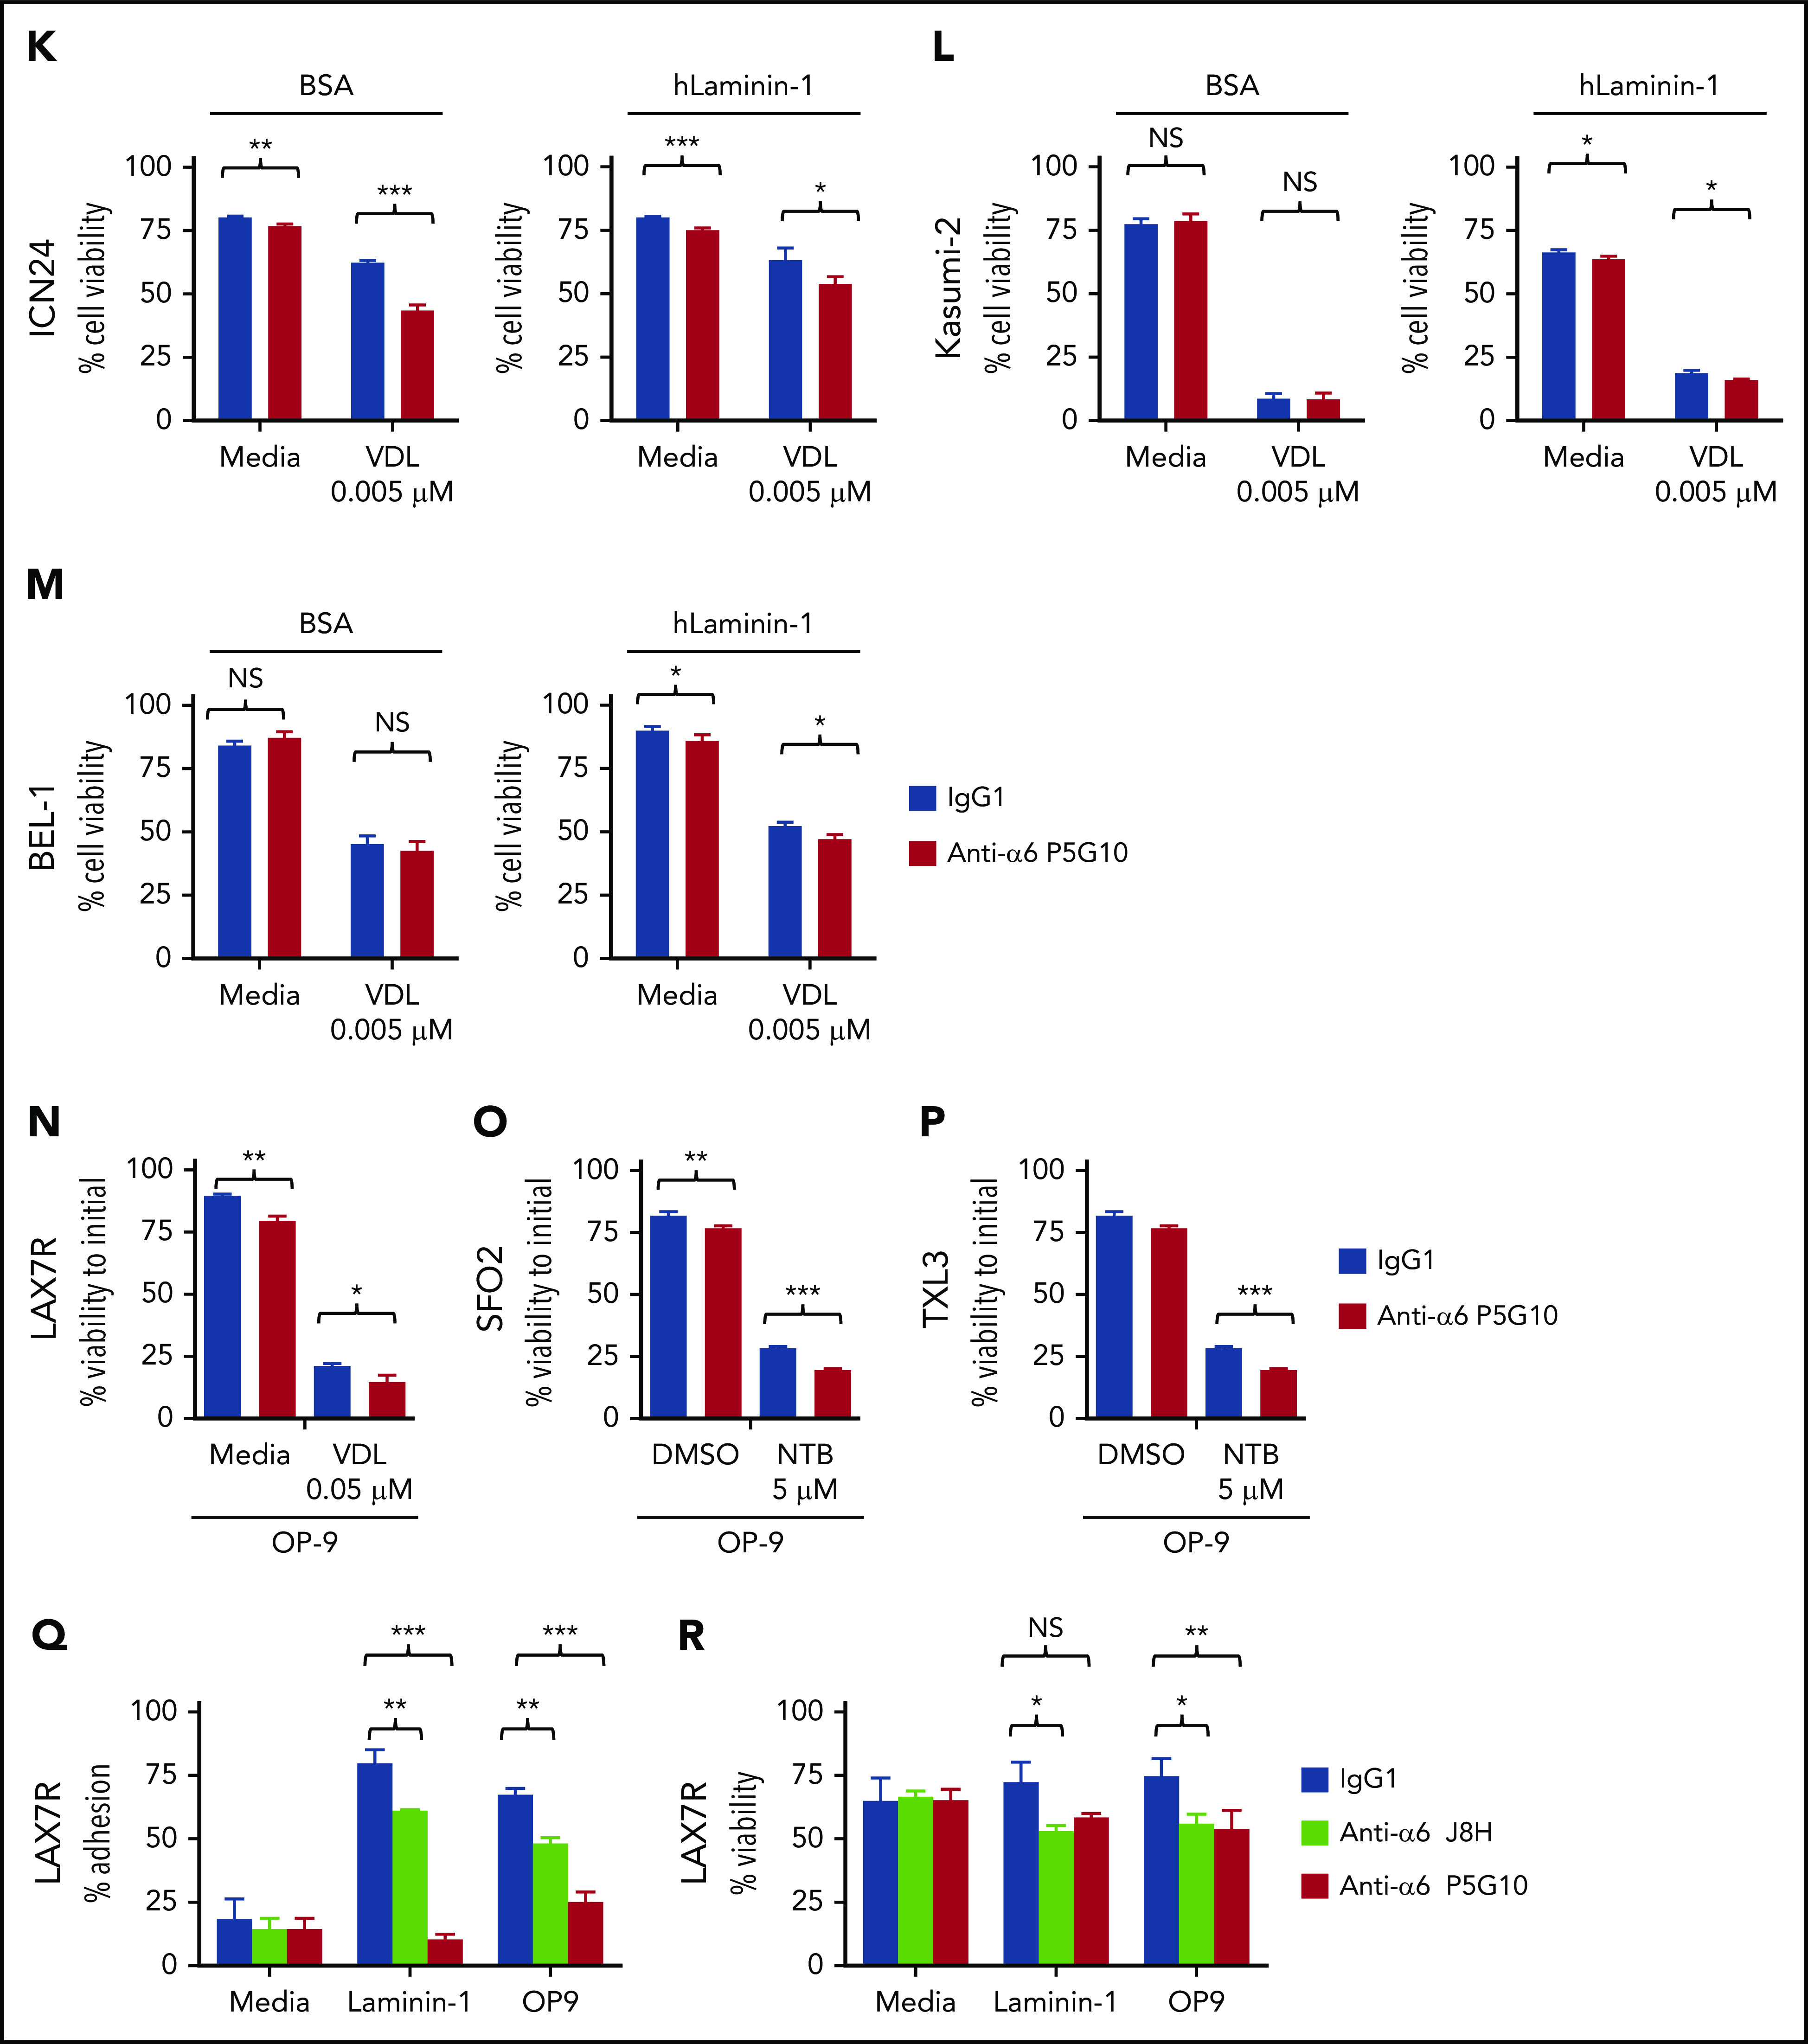
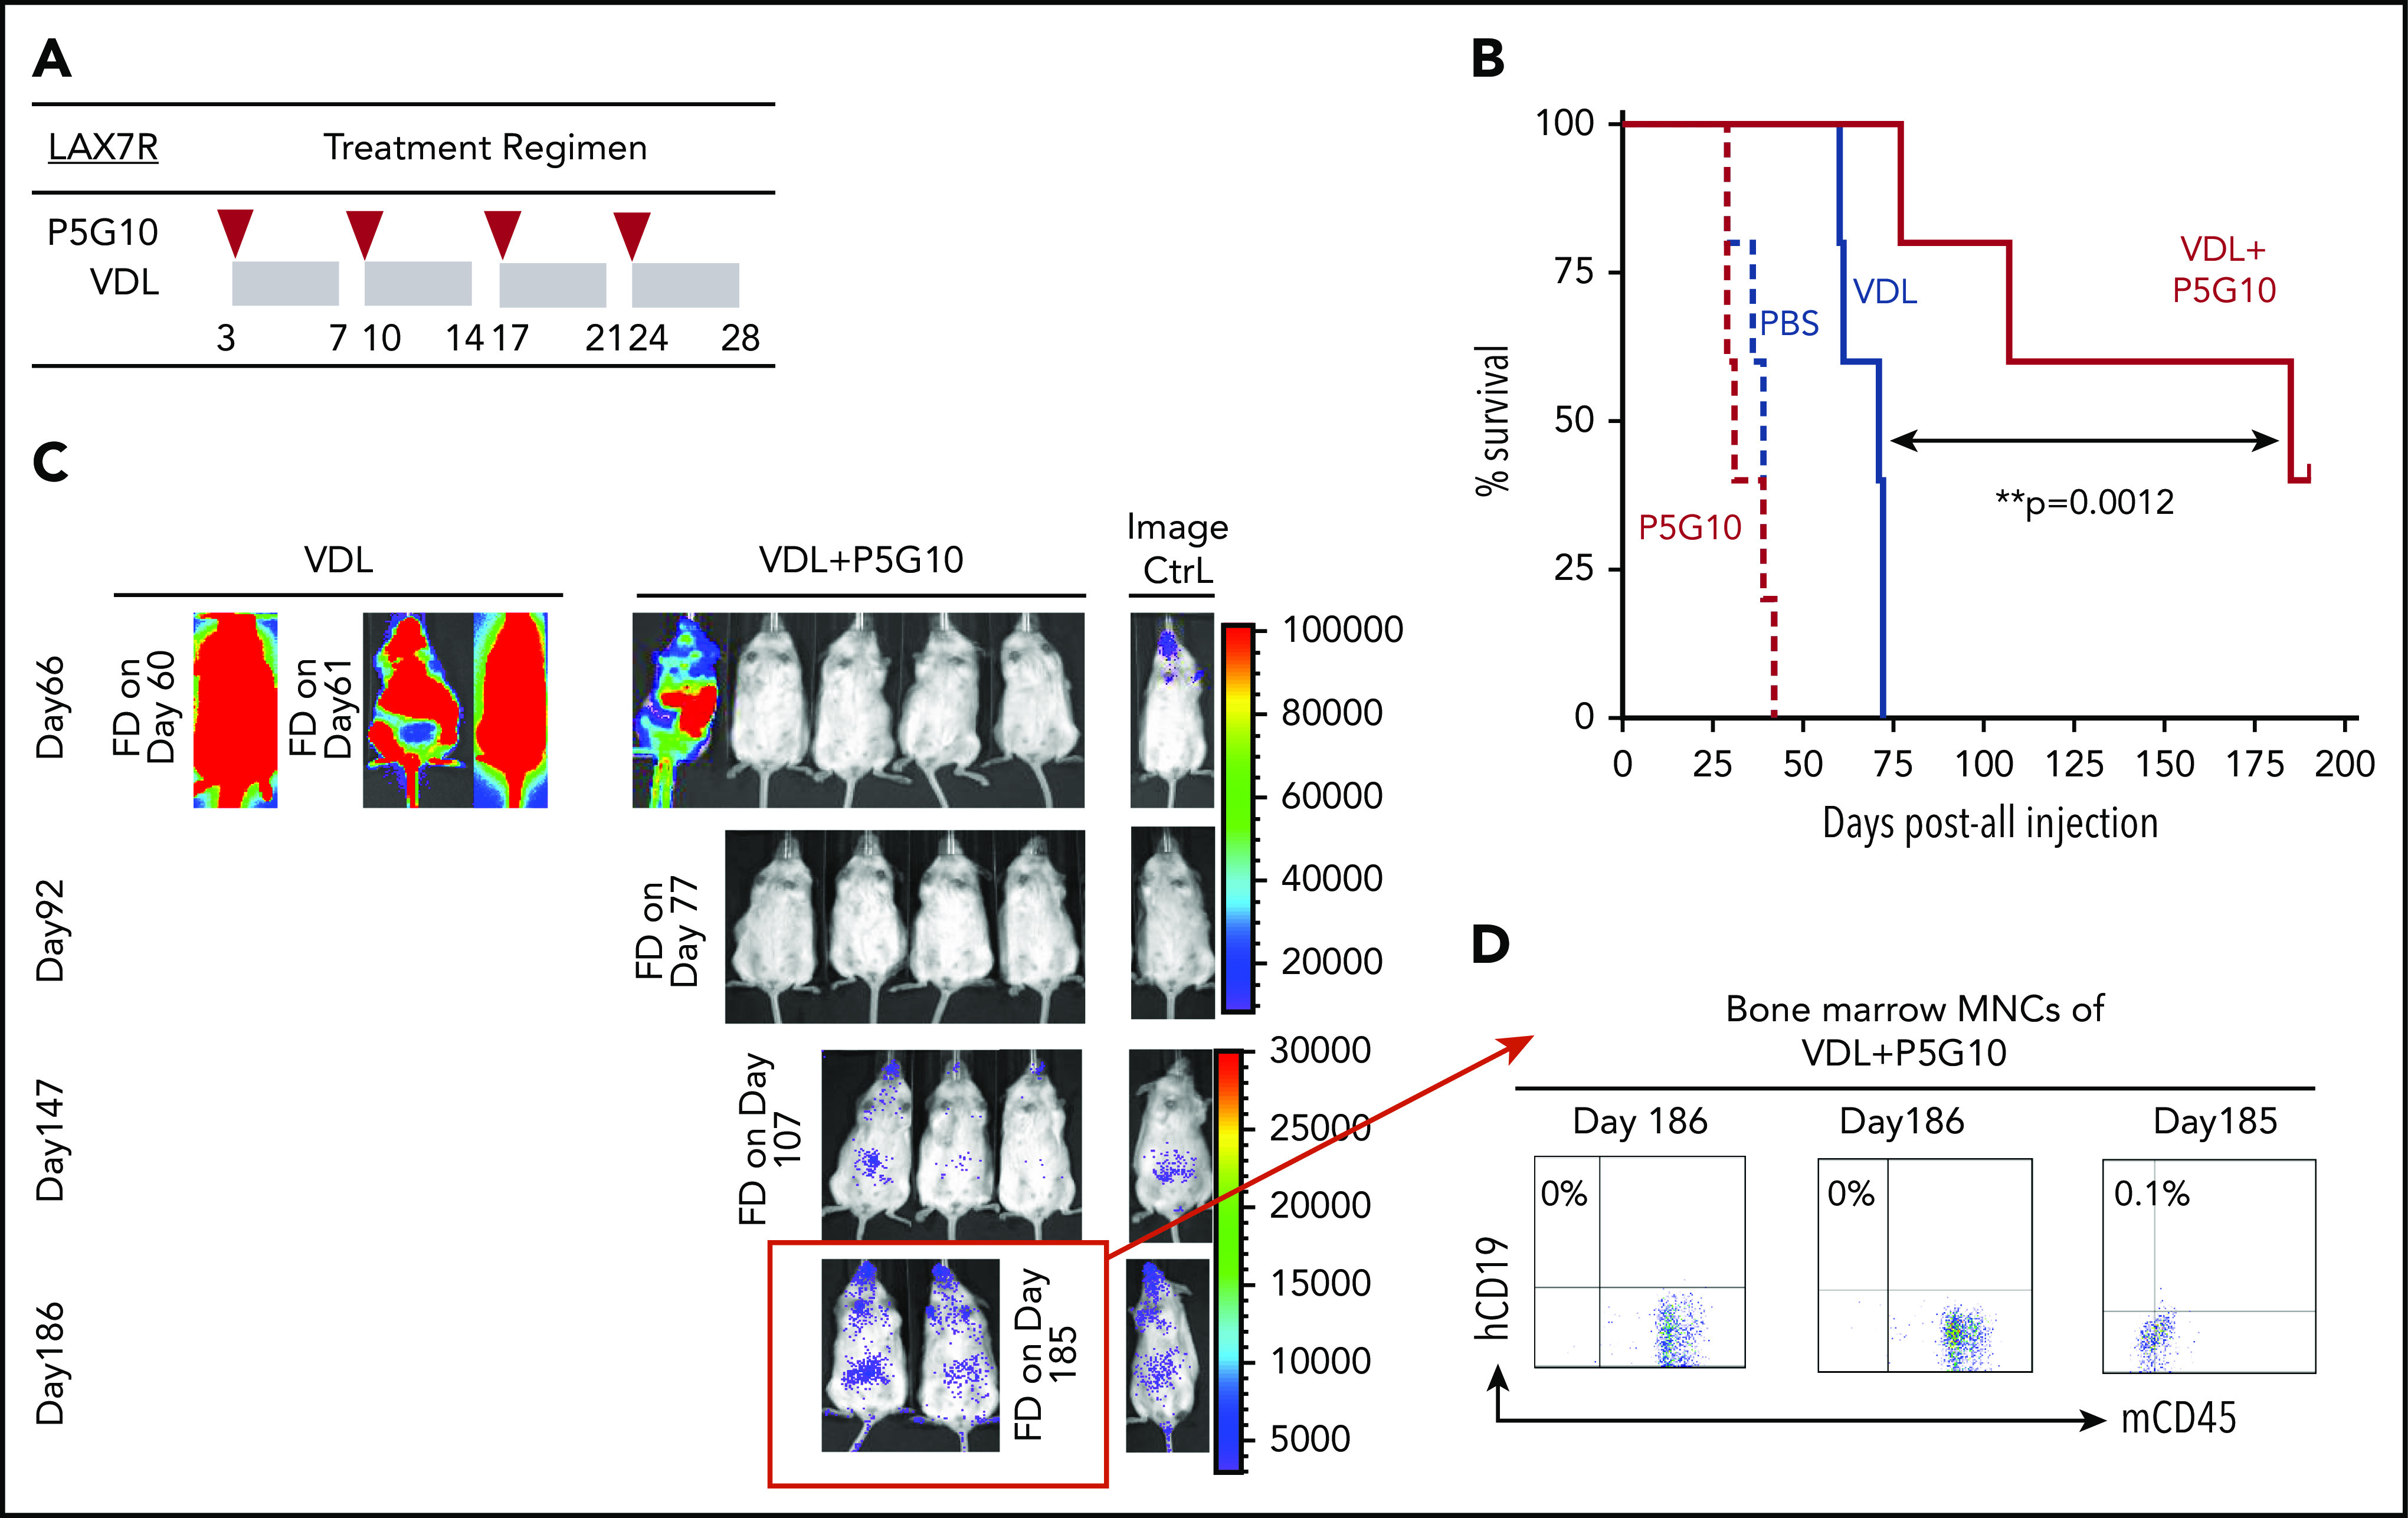
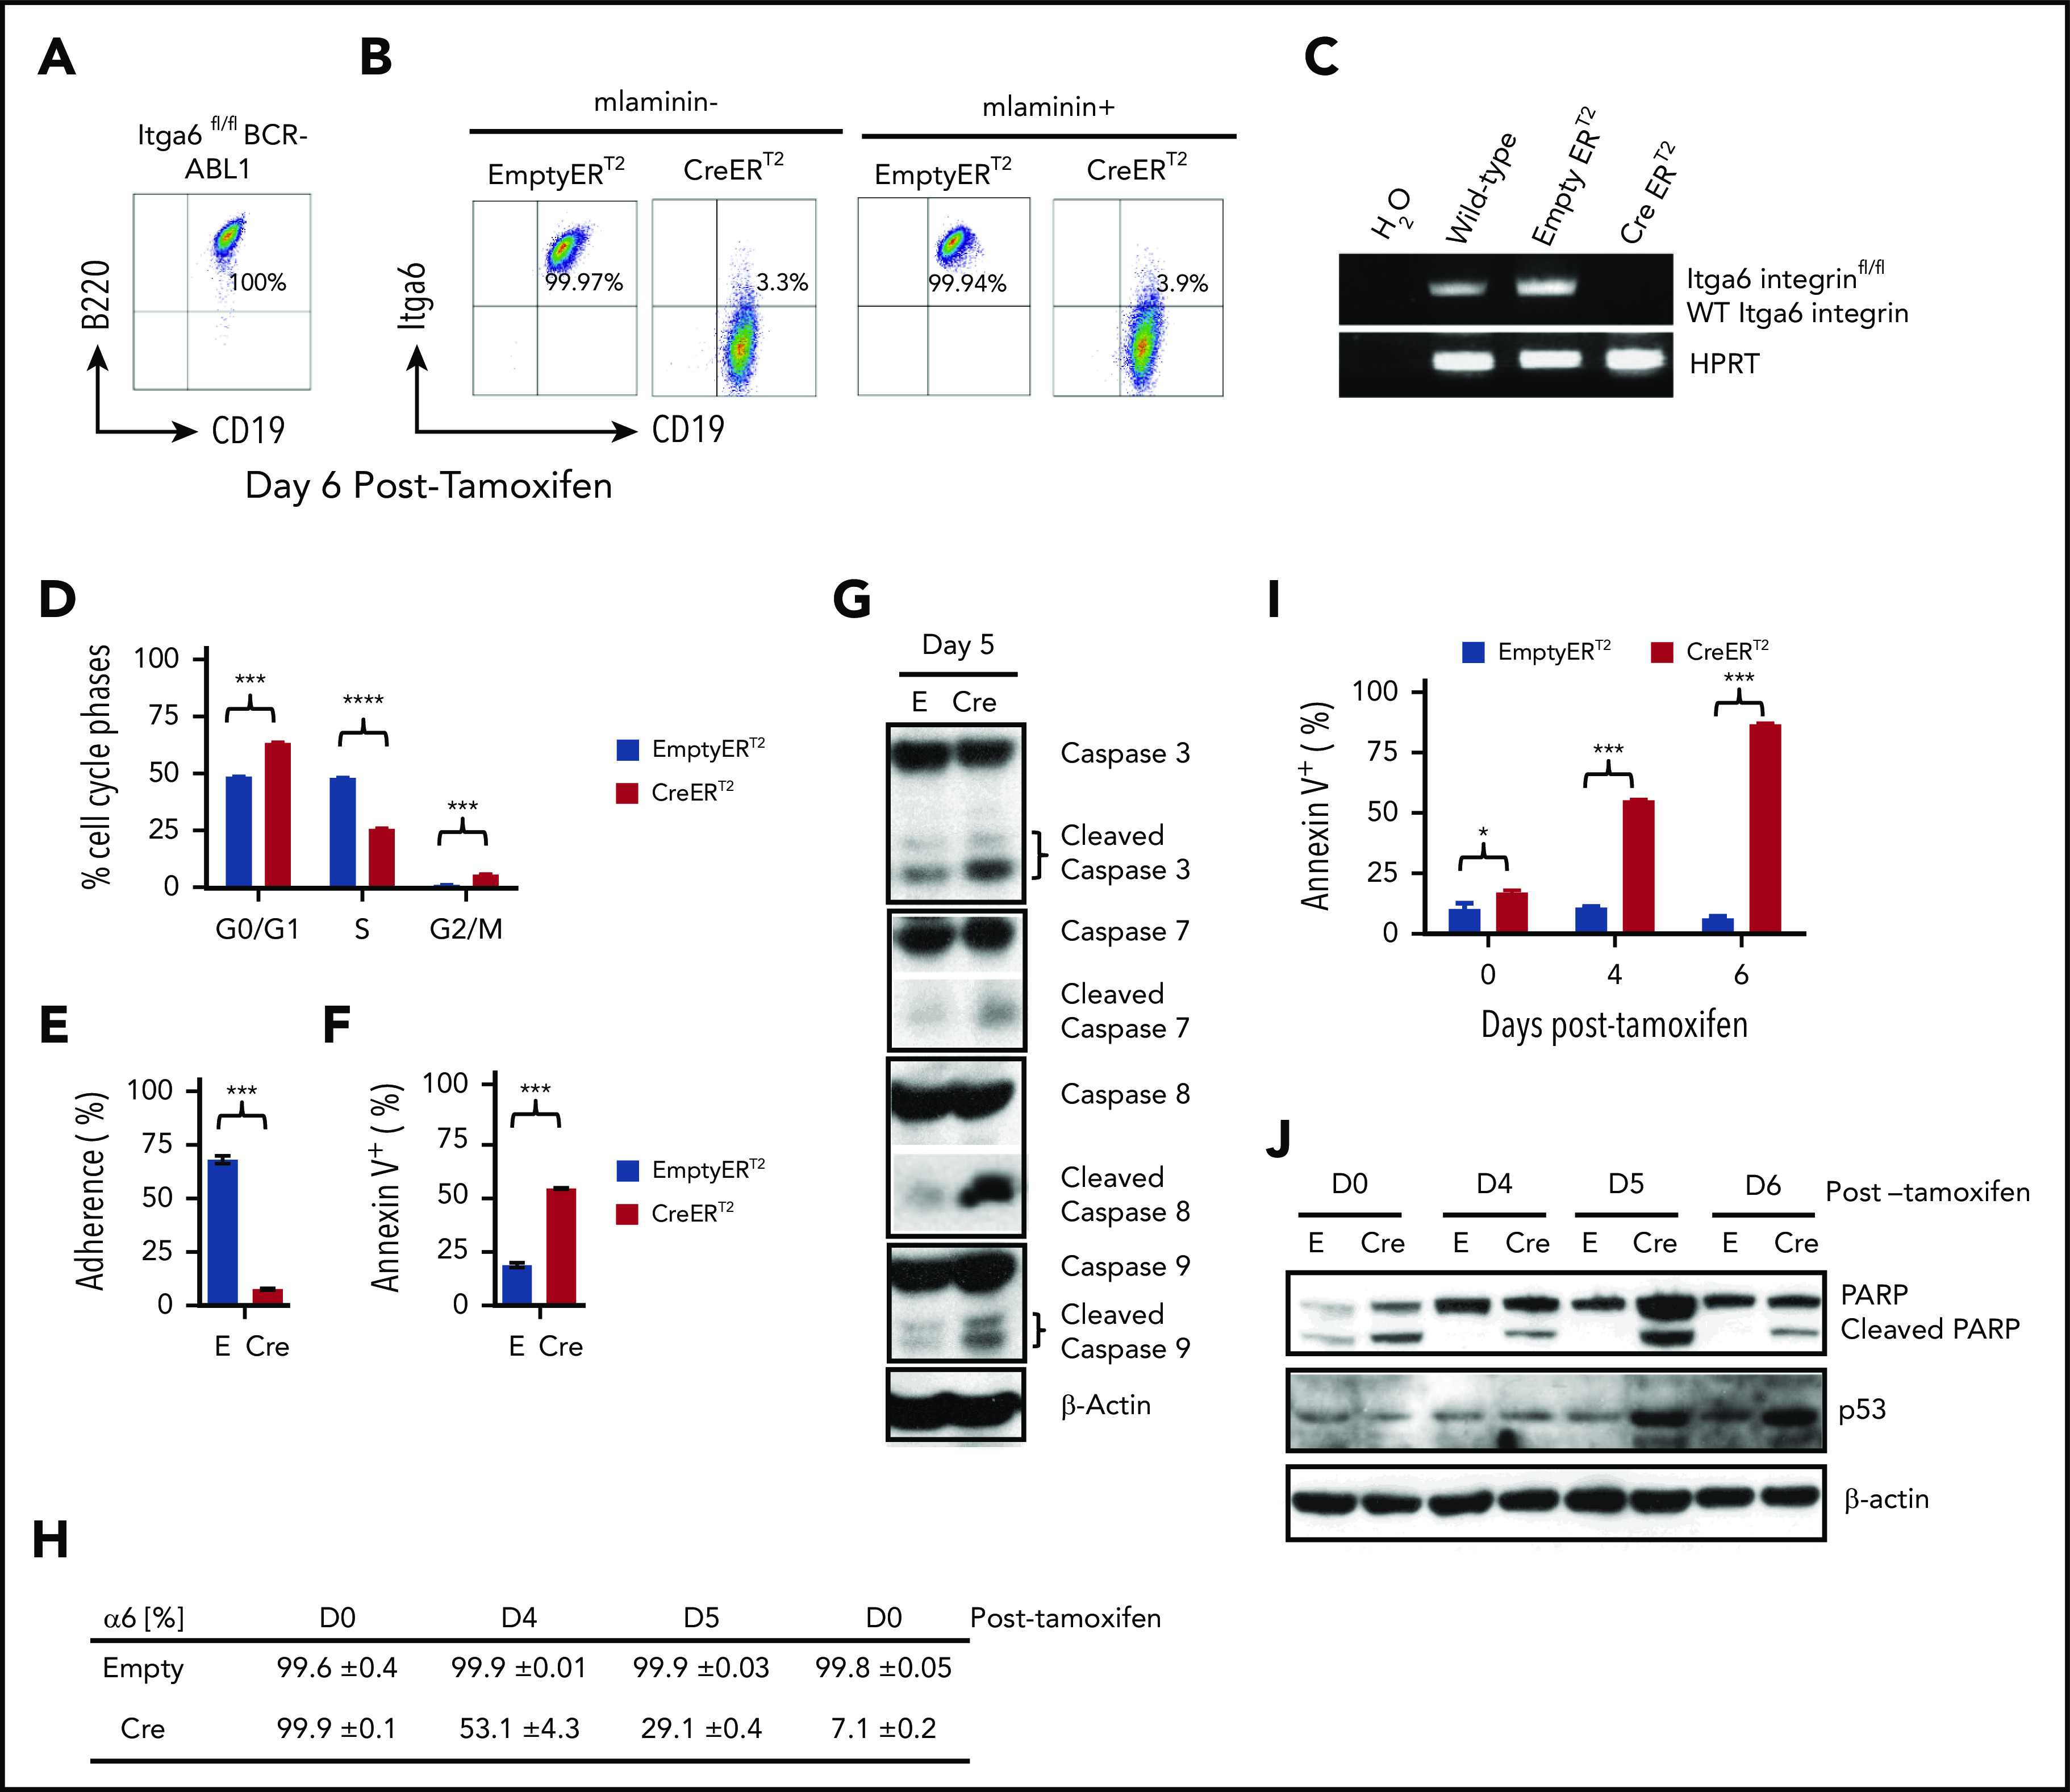
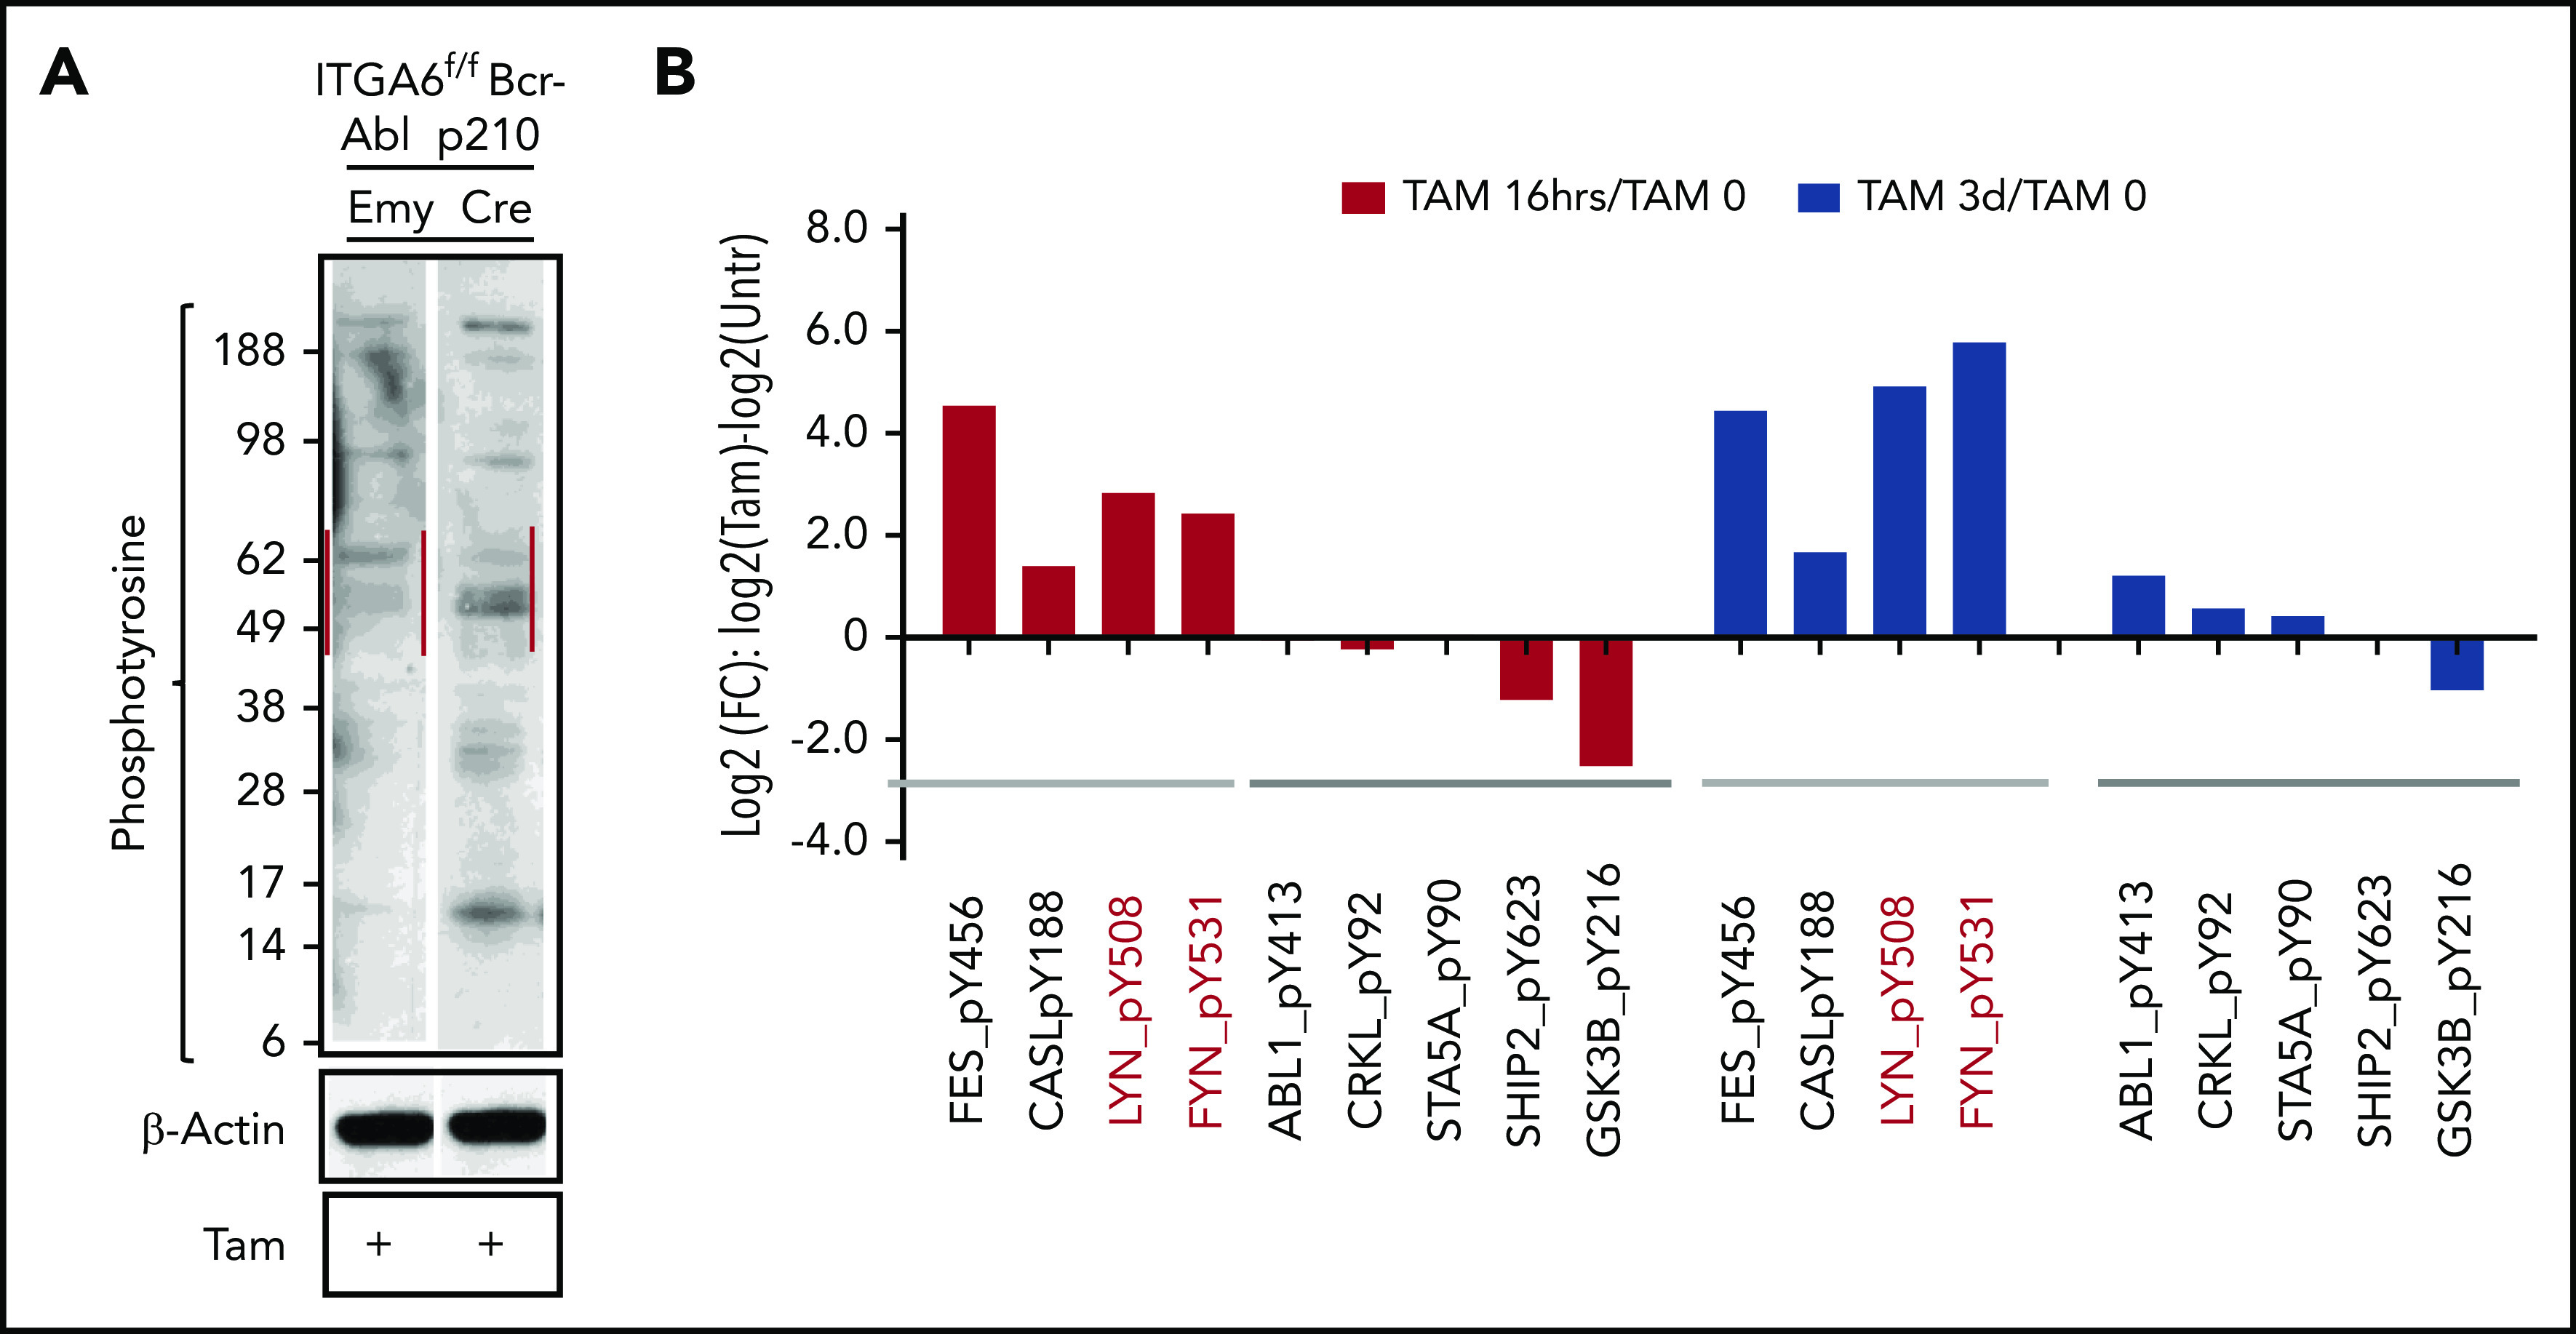
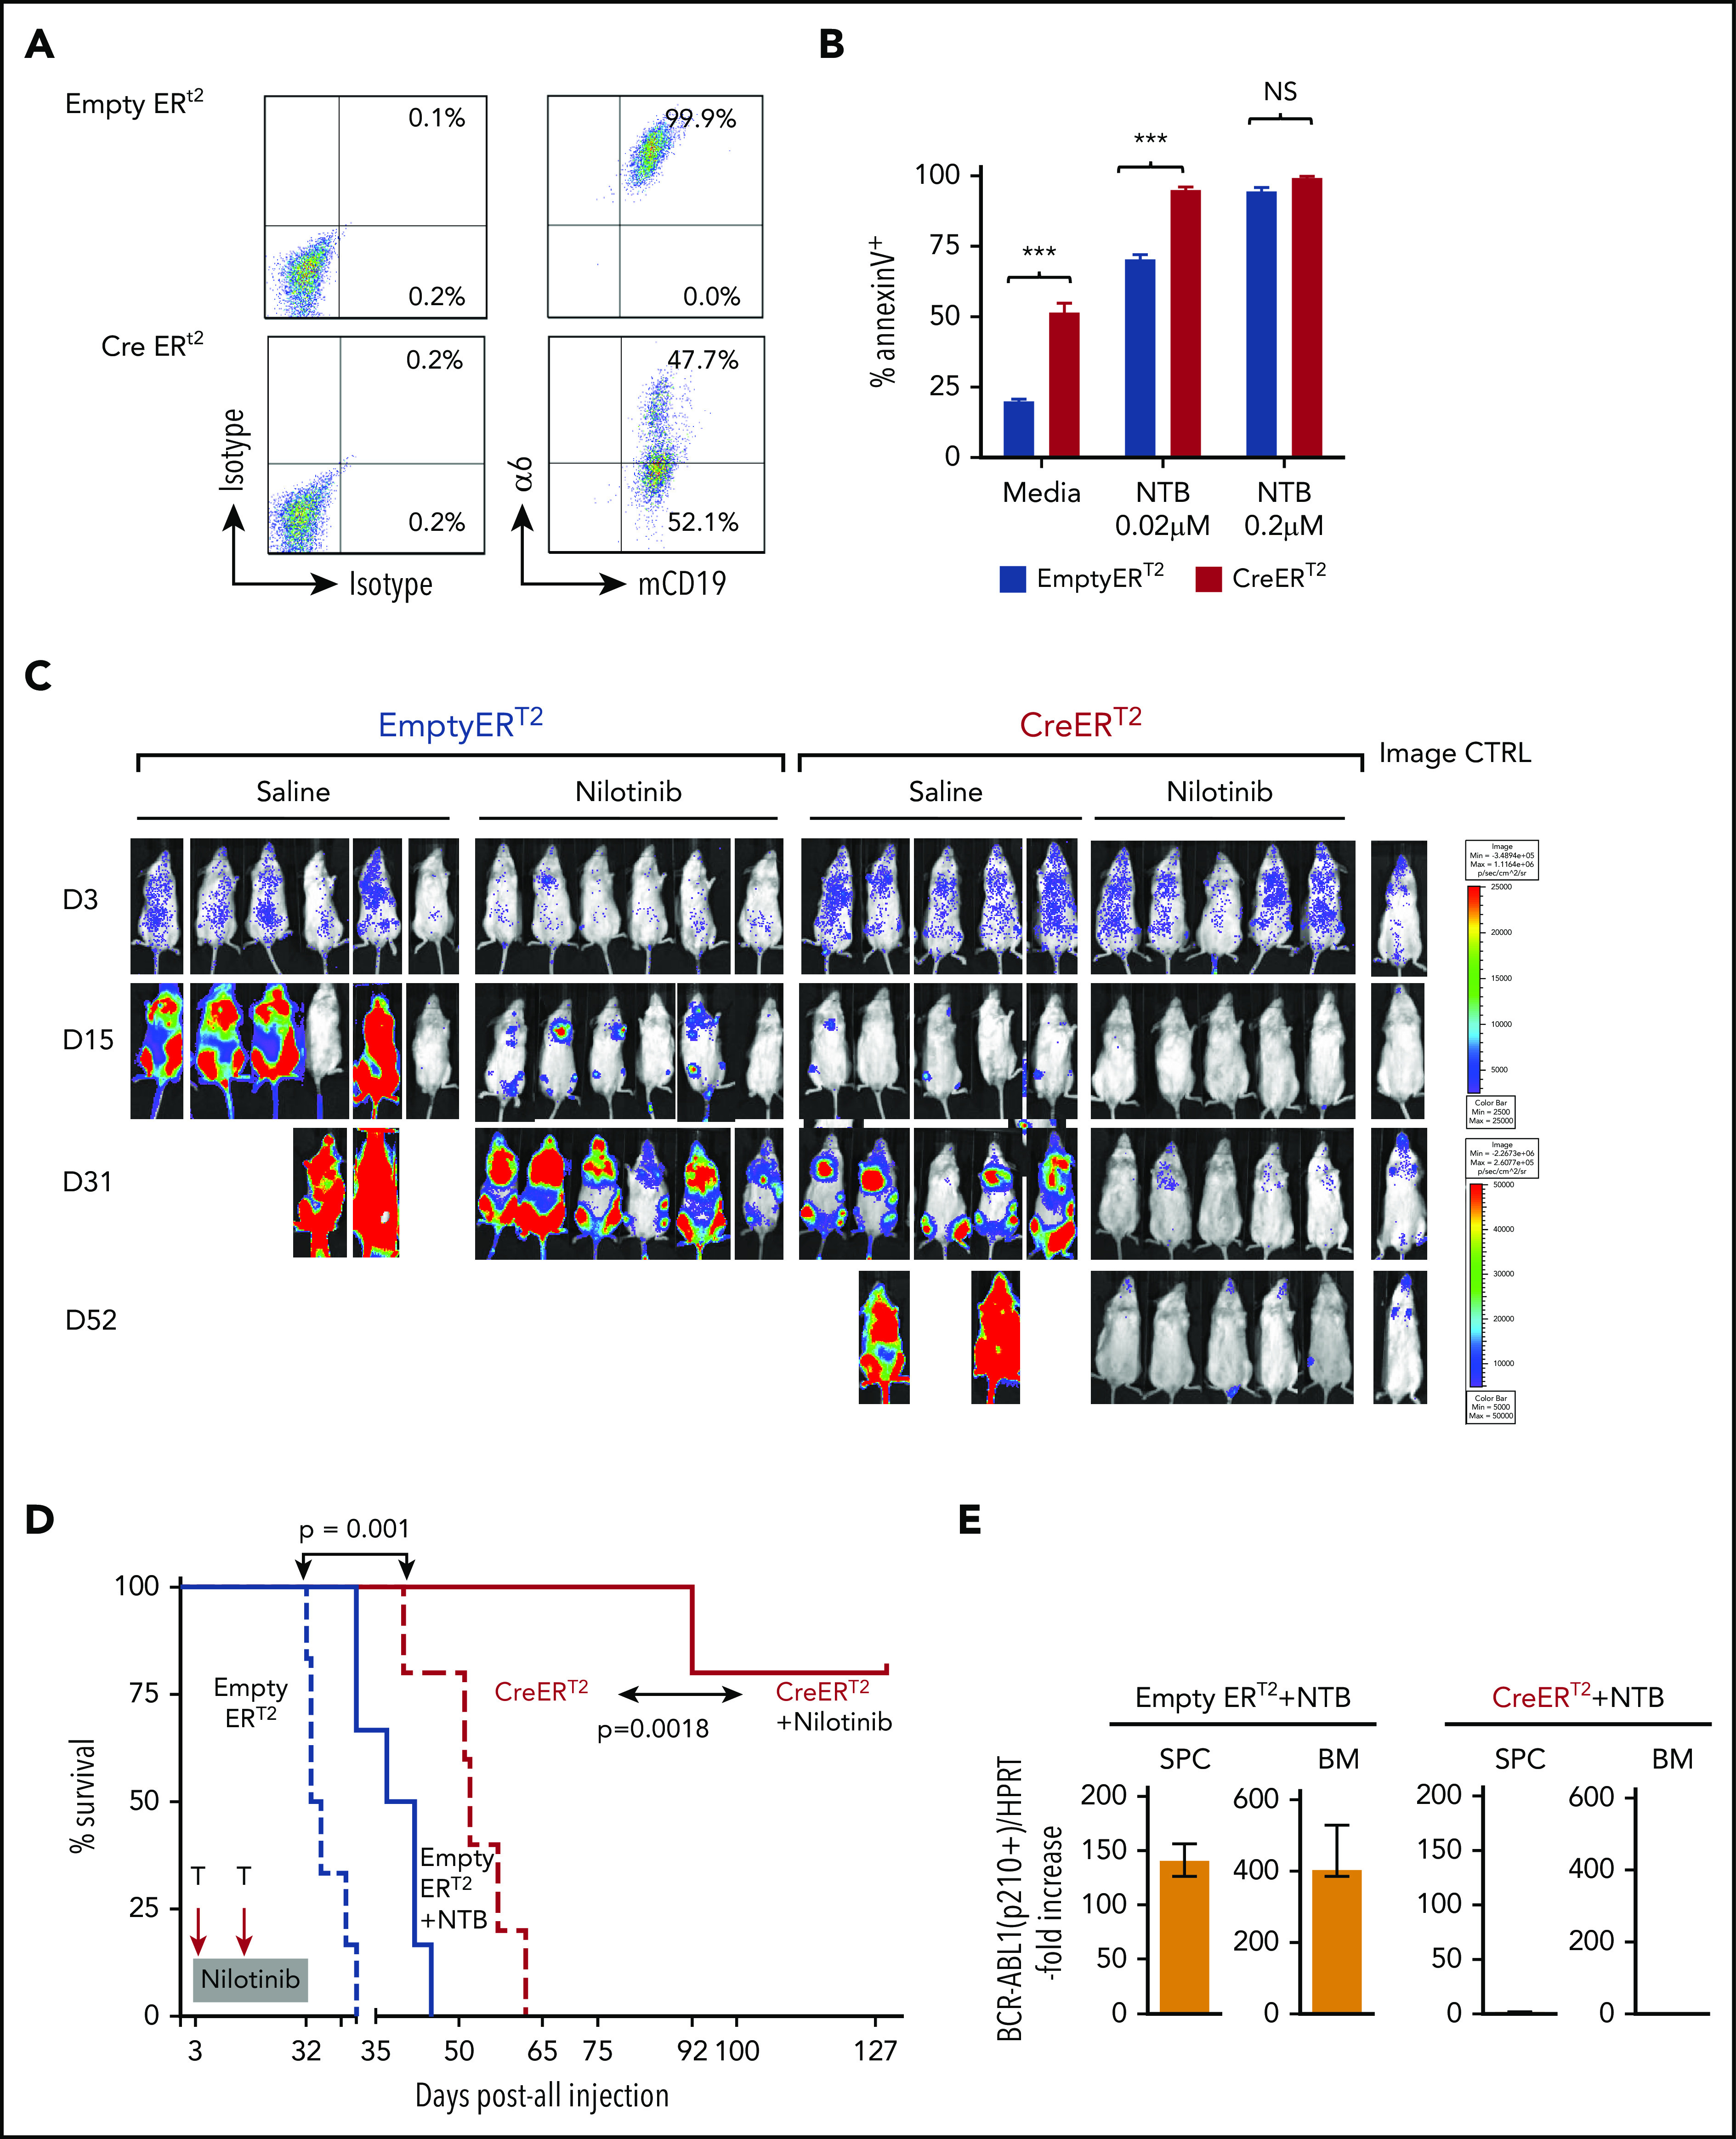
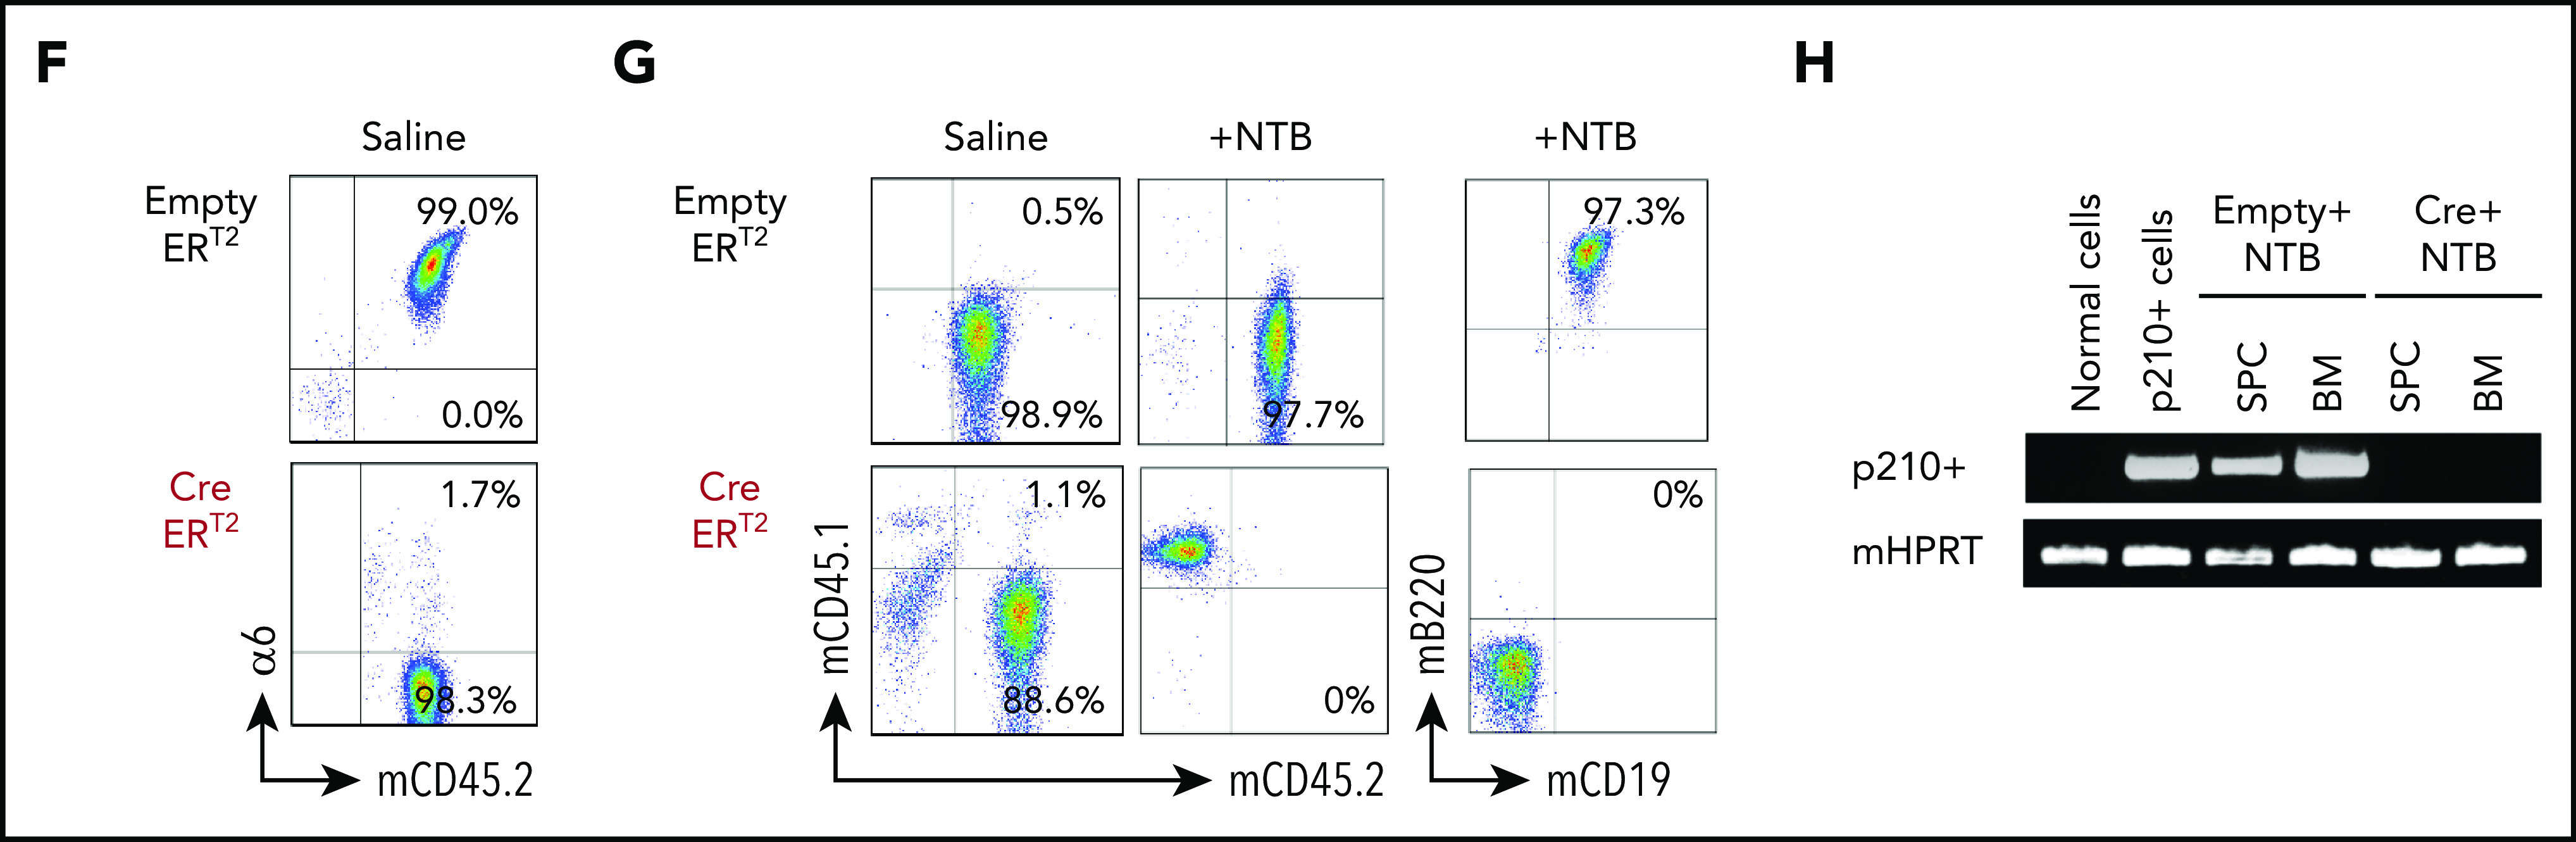
Resistance to multimodal chemotherapy continues to limit the prognosis of acute lymphoblastic leukemia (ALL). This occurs in part through a process called adhesion-mediated drug resistance, which depends on ALL cell adhesion to the stroma through adhesion molecules, including integrins. Integrin α6 has been implicated in minimal residual disease in ALL and in the migration of ALL cells to the central nervous system. However, it has not been evaluated in the context of chemotherapeutic resistance. Here, we show that the anti-human α6-blocking Ab P5G10 induces apoptosis in primary ALL cells in vitro and sensitizes primary ALL cells to chemotherapy or tyrosine kinase inhibition in vitro and in vivo. We further analyzed the underlying mechanism of α6-associated apoptosis using a conditional knockout model of α6 in murine BCR-ABL1+ B-cell ALL cells and showed that α6-deficient ALL cells underwent apoptosis. In vivo deletion of α6 in combination with tyrosine kinase inhibitor (TKI) treatment was more effective in eradicating ALL than treatment with a TKI (nilotinib) alone. Proteomic analysis revealed that α6 deletion in murine ALL was associated with changes in Src signaling, including the upregulation of phosphorylated Lyn (pTyr507) and Fyn (pTyr530). Thus, our data support α6 as a novel therapeutic target for ALL.


Conflict of interest statement

Conflict-of-interest disclosure: The authors declare no competing financial interests.

Figures

None
Graphical abstract
Figure 1.
Figure 1.
Integrin α6 is highly expressed in primary B-ALL. (A) Two probe sets for integrin α6 (ITGA6) in patients with MRD+ and MRD ALL from COG study P9906 were analyzed. MRD was measured by flow cytometry at the end of induction therapy (day 29) using patients’ BM or PB samples. RNA was purified from 191 pretreatment diagnostic samples with more than 80% blasts (131 BM; 76 PB). The horizontal bars indicate the average levels of integrin α6 expression. P values were obtained by using the Wilcoxon test for each probe set. ***P = .0005 for probe 201656_at; ***P = .001 for probe 215177_s_at. (B) Immunohistochemical staining of isotype controls (left panel) or CD79a (brown) and α6 (red) expression (right panel) in MRD+ and MRD biopsy specimens. Original magnification, ×630. (C) Representative dot plots of cell-surface α6 expression in B-ALL and normal BM CD19+ B-cell samples. One of 3 experiments is shown. (D) Representative mean fluorescence intensity (MFI) of α6 expression in CD19+ B-ALL and normal BM CD19+ B cells. One of 3 experiments is shown.
Figure 2.
Figure 2.
Integrin α6 blockade using the anti-α6 mAb P5G10 deadheres primary ALL cells and sensitizes the cells to chemotherapy. Six primary B-ALL cell lines (LAX7R, LAX53, PDX2, TXL3, SFO2, ICN24) and 2 B-ALL cell lines (Kasumi-2 and BEL-1) were preincubated with purified anti-human α6 Ab P5G10 (red bars) or its isotype control IgG1 (white bars) on plates coated with hlaminin-1. Adhesion of ALL cells to the bovine serum albumin (BSA) control, laminin-1 (A-E, left panels), cell culture media (media) or OP9 stroma cells (A-E, right panels) was assessed after overnight incubation. The viability of the ALL cells LAX7R (F), LAX53 (G), PDX2 (H), TXL3 (I), SFO2 (J), and ICN24 (K), plated on BSA (left panel) or laminin-1 (right panel) and treated with or without α6 blockade (P5G10) combined with nilotinib (NTB) or VDL for 2 days is shown. Viability of B-ALL cell lines Kasumi-2 (L) and BEL-1 cells (M) plated on BSA (left panel) or laminin-1 (right panel) treated with VDL combined with P5G10 for 3 days is shown. Three primary ALL cell lines, LAX7R (KRASG12V) (N), SFO2 (BCR-ABL1+) (O), and TXL3 (BCR-ABL1+) (P), were cocultured with OP9 cells and incubated with P5G10 (red bars) or its isotype control IgG1 (white bar) combined with NTB or VDL for 5 days. VDL was used at indicated concentrations (0.005 μM: 5 nM vincristine, 50 pM dexamethasone, and 0.0025 IU L-asparaginase; 0.001 μM: 1 nM vincristine, 10 pM dexamethasone, and 0.005 IU L-asparaginase; 0.05 μM: 50 nM vincristine, 500 pM dexamethasone, and 0.025 IU L-asparaginase). Viability was measured via the exclusion of dead cells based on trypan blue staining. LAX7R cells (Q-R) were plated on laminin-1 or OP9 cells and treated with the following antibodies: α6 function-blocking J8H (gray bars; 20 µg/mL), α6 adhesion- and function-blocking P5G10 (red bars; 20 µg/mL), or IgG1 (white bar; 20 µg/mL). Adhesion (overnight incubation) (Q) and viability (2 days incubation) (R) were determined by trypan blue exclusion staining. Means ± standard deviations are shown. One experiment of 3 is shown. Each experiment was performed in triplicate. *P < .05; **P < .01; ***P < .001 by 1-way analysis of variance (ANOVA) with post hoc analysis (Tukey test). DMSO, dimethyl sulfoxide; NS, not significant.
Figure 2.
Figure 2.
Integrin α6 blockade using the anti-α6 mAb P5G10 deadheres primary ALL cells and sensitizes the cells to chemotherapy. Six primary B-ALL cell lines (LAX7R, LAX53, PDX2, TXL3, SFO2, ICN24) and 2 B-ALL cell lines (Kasumi-2 and BEL-1) were preincubated with purified anti-human α6 Ab P5G10 (red bars) or its isotype control IgG1 (white bars) on plates coated with hlaminin-1. Adhesion of ALL cells to the bovine serum albumin (BSA) control, laminin-1 (A-E, left panels), cell culture media (media) or OP9 stroma cells (A-E, right panels) was assessed after overnight incubation. The viability of the ALL cells LAX7R (F), LAX53 (G), PDX2 (H), TXL3 (I), SFO2 (J), and ICN24 (K), plated on BSA (left panel) or laminin-1 (right panel) and treated with or without α6 blockade (P5G10) combined with nilotinib (NTB) or VDL for 2 days is shown. Viability of B-ALL cell lines Kasumi-2 (L) and BEL-1 cells (M) plated on BSA (left panel) or laminin-1 (right panel) treated with VDL combined with P5G10 for 3 days is shown. Three primary ALL cell lines, LAX7R (KRASG12V) (N), SFO2 (BCR-ABL1+) (O), and TXL3 (BCR-ABL1+) (P), were cocultured with OP9 cells and incubated with P5G10 (red bars) or its isotype control IgG1 (white bar) combined with NTB or VDL for 5 days. VDL was used at indicated concentrations (0.005 μM: 5 nM vincristine, 50 pM dexamethasone, and 0.0025 IU L-asparaginase; 0.001 μM: 1 nM vincristine, 10 pM dexamethasone, and 0.005 IU L-asparaginase; 0.05 μM: 50 nM vincristine, 500 pM dexamethasone, and 0.025 IU L-asparaginase). Viability was measured via the exclusion of dead cells based on trypan blue staining. LAX7R cells (Q-R) were plated on laminin-1 or OP9 cells and treated with the following antibodies: α6 function-blocking J8H (gray bars; 20 µg/mL), α6 adhesion- and function-blocking P5G10 (red bars; 20 µg/mL), or IgG1 (white bar; 20 µg/mL). Adhesion (overnight incubation) (Q) and viability (2 days incubation) (R) were determined by trypan blue exclusion staining. Means ± standard deviations are shown. One experiment of 3 is shown. Each experiment was performed in triplicate. *P < .05; **P < .01; ***P < .001 by 1-way analysis of variance (ANOVA) with post hoc analysis (Tukey test). DMSO, dimethyl sulfoxide; NS, not significant.
Figure 3.
Figure 3.
α6 blockade sensitizes leukemia cells to chemotherapy in vivo. (A) The treatment regimen used in NSG mice injected with primary B-ALL cells (LAX7R) consisted of the intraperitoneal administration of PBS (n = 5); an α6-blocking Ab (P5G10) (n = 5) (administered intraperitoneally on days 3, 10, 17, and 24 after leukemia injection as indicated by the red triangles); vincristine (10.5 mg/kg), dexamethasone (8 mg/kg), and L-asparaginase (800 IU/kg) (VDL) (n = 5) (as indicated by the gray rectangles); or VDL + P5G10 (n = 5). (B) The Kaplan-Meier survival curve was analyzed, and the MST was calculated for each group: PBS (MST = 39 days), P5G10 (MST = 31 days), VDL (MST = 71 days), VDL + P5G10 (MST = 185 days). (C) Bioluminescence imaging of mice on days 66, 92, 147, and 186 after leukemia cell transfer. A mouse with no leukemia cell injection treated only with luciferin at the time of imaging was included as a background control (Image Ctrl) (right panel). One experiment is shown. (D) Flow cytometric analysis of human (h) CD19 and murine (m) CD45 in BM mononuclear cells (MNCs) from 3 animals euthanized on day 186 after injection or found dead (FD) on day 185 after injection.
Figure 4.
Figure 4.
Integrin α6 deletion induces the deadhesion and apoptosis of murine BCR-ABL1+ (p210) ALL cells. (A) Immunophenotype of murine BCR-ABL1 (p210)+ ALL cells. (B) Deletion of α6 induced by tamoxifen (1.5 μM) was confirmed by flow cytometry 6 days after tamoxifen treatment. Left panel: cells not plated on mlaminin-1; right panel: cells plated on mlaminin+. (C) Deletion of α6 was confirmed by genomic PCR. Hypoxanthine-guanine phosphoribosyltransferase (HPRT) was used as a PCR DNA and loading control. (D) Cell cycle analysis of CreERT2 and EmptyERT2 cells on day 5 after deletion by bromodeoxyuridine flow cytometry. ***P < .001 and ****P < .0001 by 1-way ANOVA with post hoc analysis (Tukey test). (E) Percentage of adherent CreERT2 and EmptyERT2 cells on mlaminin-coated plates on day 5. ***P < .001 by Student t test. (F) Apoptosis analysis by annexin V and 7-AAD staining of CreERT2 and EmptyERT2 cells at day 5 after deletion. ***P < .001 by Student t test. (G) Western blot of cleaved caspases 3, 7, 8, and 9 in CreERT2 and EmptyERT2 cell lysates on day 5 after deletion. β-actin, loading control. (H) Percentage of α6 and (I) annexin V expression in CreERT2 and EmptyERT2 cells at various time points after α6 deletion, as determined by flow cytometry. Mean ± standard deviation is shown. *P < .05 and ***P < .001 by 1-way ANOVA with post hoc analysis (Tukey test). (J) Western blot of cleaved poly (ADP-ribose) polymerase (PARP) and p53 in CreERT2 and EmptyERT2 cells on various days (days 0, 4, 5, and 6) after tamoxifen-induced α6 deletion. β-actin, loading control. One of 3 experiments is shown.
Figure 5.
Figure 5.
Integrin α6 deletion in murine BCR-ABL1+ (p210) B-ALL cells affects Src signaling. (A) α6fl/fl BCR-ABL1+ (p210) x CreERT2 (Cre) and x EmptyERT2 (Emy) cells treated with tamoxifen (TAM) for 24 hours followed by western blot analysis using an anti-phosphotyrosine Ab (clone 4G10). One of 3 experiments is shown. (B) Phosphotyrosine proteomics analysis was performed on murine cells treated for 16 hours or 3 days with tamoxifen. The fold changes (FCs) in the selected phosphotyrosine proteins were plotted. One experiment is shown.
Figure 6.
Figure 6.
α6 deletion sensitizes murine leukemia cells to tyrosine kinase inhibition in vitro, and the combination of the in vivo deletion of α6 with tyrosine kinase inhibition eradicates leukemia cells. α6fl/fl BCR-ABL1+ (p210) CreERT2 and EmptyERT2 cells were plated onto tissue culture plates (without further coating) and treated with tamoxifen (1.5 μM) and nilotinib (0.02 μM or 0.2 μM) for 5 days. (A) Deletion of α6 was determined by flow cytometry. (B) Cell viability was determined by annexin V detection using flow cytometry. The y-axis indicates the percentage of annexin V–positive cells. Mean ± standard deviation is shown. ***P < .001. (C) Bioluminescence imaging of mice injected with luciferase-labeled murine α6fl/fl BCR-ABL1+ CreERT2 and EmptyERT2 ALL cells followed by treatment with tamoxifen to delete α6 with or without nilotinib on the indicated days after ALL cell injection. One in vivo experiment is shown. (D) Kaplan-Meier survival analysis for the MST determination in each group: EmptyERT2 (n = 6), MST = 27 days; CreERT2 (n = 5), MST = 54.5 days; EmptyERT2 + nilotinib (n = 6), MST = 39.5 days; CreERT2 + nilotinib (n = 5), MST = undefined because 4 of 5 mice remained alive until the end of follow-up. *P = .0001, log-rank test. (E) Detection of murine BCR-ABL1 (p210+) cells in spleen cells (SPCs) or BM by qRT-PCR. Error bars are from the 2 comparison groups (Empty ERT2 + NTB vs CRE ERT2 + NTB). (F) α6 deletion was confirmed by flow cytometry in BM cells from leukemic mice injected with α6fl/fl BCR-ABL1+ CreERT2 or EmptyERT2 cells. Donor white blood cells (WBCs) were labeled with CD45.2+. (G) Flow cytometric analysis of WBCs from recipients of α6fl/fl BCR-ABL1+ CreERT2 or EmptyERT2 cells treated with nilotinib. Donor WBCs were CD45.2+, and recipient WBCs were CD45.1+. (H) Genomic PCR of BCR-ABL1 was performed on cells isolated from the spleen and BM of mice treated with EmptyERT2 + nilotinib (NTB) and CreERT2 + NTB. Murine HPRT (mHPRT) was used as an internal PCR DNA control.
Figure 6.
Figure 6.
α6 deletion sensitizes murine leukemia cells to tyrosine kinase inhibition in vitro, and the combination of the in vivo deletion of α6 with tyrosine kinase inhibition eradicates leukemia cells. α6fl/fl BCR-ABL1+ (p210) CreERT2 and EmptyERT2 cells were plated onto tissue culture plates (without further coating) and treated with tamoxifen (1.5 μM) and nilotinib (0.02 μM or 0.2 μM) for 5 days. (A) Deletion of α6 was determined by flow cytometry. (B) Cell viability was determined by annexin V detection using flow cytometry. The y-axis indicates the percentage of annexin V–positive cells. Mean ± standard deviation is shown. ***P < .001. (C) Bioluminescence imaging of mice injected with luciferase-labeled murine α6fl/fl BCR-ABL1+ CreERT2 and EmptyERT2 ALL cells followed by treatment with tamoxifen to delete α6 with or without nilotinib on the indicated days after ALL cell injection. One in vivo experiment is shown. (D) Kaplan-Meier survival analysis for the MST determination in each group: EmptyERT2 (n = 6), MST = 27 days; CreERT2 (n = 5), MST = 54.5 days; EmptyERT2 + nilotinib (n = 6), MST = 39.5 days; CreERT2 + nilotinib (n = 5), MST = undefined because 4 of 5 mice remained alive until the end of follow-up. *P = .0001, log-rank test. (E) Detection of murine BCR-ABL1 (p210+) cells in spleen cells (SPCs) or BM by qRT-PCR. Error bars are from the 2 comparison groups (Empty ERT2 + NTB vs CRE ERT2 + NTB). (F) α6 deletion was confirmed by flow cytometry in BM cells from leukemic mice injected with α6fl/fl BCR-ABL1+ CreERT2 or EmptyERT2 cells. Donor white blood cells (WBCs) were labeled with CD45.2+. (G) Flow cytometric analysis of WBCs from recipients of α6fl/fl BCR-ABL1+ CreERT2 or EmptyERT2 cells treated with nilotinib. Donor WBCs were CD45.2+, and recipient WBCs were CD45.1+. (H) Genomic PCR of BCR-ABL1 was performed on cells isolated from the spleen and BM of mice treated with EmptyERT2 + nilotinib (NTB) and CreERT2 + NTB. Murine HPRT (mHPRT) was used as an internal PCR DNA control.

References

    1. Hunger SP, Mullighan CG. Acute lymphoblastic leukemia in children. N Engl J Med. 2015;373(16):1541-1552. - PubMed
    1. Gökbuget N. Treatment of older patients with acute lymphoblastic leukemia. Hematology Am Soc Hematol Educ Program. 2016;2016(1):573-579. - PMC - PubMed
    1. Gaynon PS, Qu RP, Chappell RJ, et al. . Survival after relapse in childhood acute lymphoblastic leukemia: impact of site and time to first relapse–the Children’s Cancer Group Experience. Cancer. 1998;82(7):1387-1395. - PubMed
    1. Gaynon PS. Childhood acute lymphoblastic leukaemia and relapse. Br J Haematol. 2005;131(5):579-587. - PubMed
    1. Locatelli F, Schrappe M, Bernardo ME, Rutella S. How I treat relapsed childhood acute lymphoblastic leukemia. Blood. 2012;120(14):2807-2816. - PubMed

Publication types

MeSH terms