. 2020 Jul 2;136(1):106-118.
doi: 10.1182/blood.2019003358.

Calreticulin haploinsufficiency augments stem cell activity and is required for onset of myeloproliferative neoplasms in mice

Affiliations

Calreticulin haploinsufficiency augments stem cell activity and is required for onset of myeloproliferative neoplasms in mice

Kotaro Shide et al. Blood. .

Abstract

Mutations in JAK2, myeloproliferative leukemia virus (MPL), or calreticulin (CALR) occur in hematopoietic stem cells (HSCs) and are detected in more than 80% of patients with myeloproliferative neoplasms (MPNs). They are thought to play a driver role in MPN pathogenesis via autosomal activation of the JAK-STAT signaling cascade. Mutant CALR binds to MPL, activates downstream MPL signaling cascades, and induces essential thrombocythemia in mice. However, embryonic lethality of Calr-deficient mice precludes determination of a role for CALR in hematopoiesis. To clarify the role of CALR in normal hematopoiesis and MPN pathogenesis, we generated hematopoietic cell-specific Calr-deficient mice. CALR deficiency had little effect on the leukocyte count, hemoglobin levels, or platelet count in peripheral blood. However, Calr-deficient mice showed some hematopoietic properties of MPN, including decreased erythropoiesis and increased myeloid progenitor cells in the bone marrow and extramedullary hematopoiesis in the spleen. Transplantation experiments revealed that Calr haploinsufficiency promoted the self-renewal capacity of HSCs. We generated CALRdel52 mutant transgenic mice with Calr haploinsufficiency as a model that mimics human MPN patients and found that Calr haploinsufficiency restored the self-renewal capacity of HSCs damaged by CALR mutations. Only recipient mice transplanted with Lineage-Sca1+c-kit+ cells harboring both CALR mutation and Calr haploinsufficiency developed MPN in competitive conditions, showing that CALR haploinsufficiency was necessary for the onset of CALR-mutated MPNs.


Conflict of interest statement

Conflict-of-interest disclosure: The authors declare no competing interests.

Figures

None
Graphical abstract
Figure 1.
Figure 1.
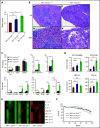
Hematopoietic phenotype of Calr-deficient mice. (A) Average complete blood cell counts (n = 30 in each group). (B) Hematopoietic compartment of PB assessed with flow cytometry. At 16 weeks of age, the proportion of myeloid cells (Mac1+ or Gr1+), B cells (B220+), and T cells (CD3+) was comparable among the 3 groups. (C) Histology of BM. Mouse BM was stained with hematoxylin and eosin at 6 months of age. (D) Macroscopic findings of a femur and a BM cell pellet taken from a mouse of each genotype. (E) Proportions of myeloid cells (Mac1 or Gr1), T cells (CD3+), B cells (B220+), erythroid cells (CD71+ and Ter119+), and megakaryocytes (CD41+) in BM. In BM cells from Mx1-cre;Calrf/− mice (n = 13), erythroid cells decreased significantly to less than half compared with BM cells from Mx1-cre;Calr+/+ mice (n = 8) or Mx1-cre;Calr+/− mice (n = 9) (top). No significant difference was found in the other fractions. Proportions of HSCs and progenitors in BM (bottom). Compared with Mx1-cre;Calr+/+ mice, Mx1-cre;Calrf/− mice showed increased frequencies of MPPs and GMPs. No differences were found in the frequencies of any progenitors (LT-HSCs, short-term-HSCs, LSK cells, common myeloid progenitors, erythromegakaryocyte progenitors ([MEPs]MEP), and megakaryocyte progenitors [MKPs]), between Mx1-cre;Calr+/− mice and Mx1-cre;Calr+/+ mice. (F) Number of hematopoietic colonies from BM cells. BM cells (2 × 10⁴) were used for burst-forming unit-erythroids (BFU-Es), CFU-GM, and CFU-granulocyte, erythrocyte, monocyte, and megakaryocyte (CFU-GEMM) colonies. BM (1 × 10⁵) cells were used for CFU-E colonies. The number of CFU-GM was significantly higher in Mx1-cre;Calrf/− mice (n = 12) than in Mx1-cre;Calr+/+ mice (n = 9). The number of CFU-E was significantly lower in Mx1-cre;Calrf/− mice than in Mx1-cre;Calr+/+ mice and Mx1-cre;Calr+/− mice (n = 10). All data are presented as the means ± SEM. To assess statistical significance among groups, 1-way ANOVA followed by the Tukey-Kramer test was used. (G) MPO mRNA and protein expression. (left) Real-time PCR analysis of Mpo (left; n = 3 in each group). Mac1+/Gr1+ bone marrow (BM) cells were analyzed for levels of MPO expression with flow cytometry (right). One representative experiment of 3 is shown. *P < .05; **P < .01; n.s., not significant.
Figure 2.
Figure 2.
Extramedullary hematopoiesis in the spleen of Calr-deficient mice. (A) Spleen weight of 4- to 6-month-old mice. Mx1-cre;Calrf/− mice (n = 13) exhibited splenomegaly compared with Mx1-cre;Calr+/+ mice (n = 9). On the other hand, no difference was found between Mx1-cre;Calr+/− mice (n = 10) and Mx1-cre;Calr+/+ mice. (B) Histology of the spleen. The spleen was stained with hematoxylin and eosin at 6 months of age. (Ba,c) The margin of white pulp is obscured in Mx1-cre;Calrf/− mice compared with Mx1-cre;Calr+/+ mice (original magnification ×20). (Bb,d) Infiltration of myeloid cells such as megakaryocytes, erythroblasts, and granulocytes is clearly observed in the spleen of Mx1-cre;Calrf/− mice (original magnification ×200). These findings were not apparent in the spleen of Mx1-cre;Calr+/− mice (not shown). (C) Proportions of myeloid cells (Mac1+ or Gr1+), T cells (CD3+), B cells (B220+), erythroid cells (CD71+ and Ter119+), and megakaryocytes (CD41+) in the spleen (top). In spleens of Mx1-cre;Calrf/− mice (n = 13), B cells were decreased, whereas erythroblasts, megakaryocytes, and granulocytes were increased compared with Mx1-cre;Calr+/+ mice (n = 8). No difference was found between Mx1-cre;Calr+/− mice (n = 9) and Mx1-cre;Calr+/+ mice. Proportions of HSCs and progenitors in the spleen (bottom). Compared with Mx1-cre;Calr+/+ mice, Mx1-cre;Calrf/− mice showed increased frequencies of LT-HSC, MPPs, LSK cells, common myeloid progenitors, GMPs, erythromegakaryocyte progenitors, and megakaryocyte progenitors (MKPs). No differences were found in the frequencies of any progenitors between Mx1-cre;Calr+/+ mice and Mx1-cre;Calr+/− mice. (D) Number of hematopoietic colonies per 105 spleen cells. The proportions of CFU-GEMMs, CFU-GMs, and CFU-Es were higher in Mx1-cre;Calrf/− mice (n = 12) than in Mx1-cre;Calr+/+ mice (n = 9). In the spleen of Mx1-cre;Calr+/− mice (n = 10), only CFU-GMs were mildly increased. (E) Heat maps comparing cytokines levels in plasma from Mx1-cre;Calr+/+ (n = 7), Mx1-cre;Calr+/− (n = 6), and Mx1-cre;Calrf/− (n = 7) mice. The levels are shown by the color gradient from green (low levels) to red (high levels). *P < .05; **P < .01 vs Mx1-cre Calr+/+; †P < .05 vs Mx1-cre Calr+/−. (F) Kaplan-Meier plot of Mx1-cre;Calr+/+, Mx1-cre;Calr+/−, and Mx1-cre;Calrf/− mice (n = 30 in each group). All data are presented as the means ± SEM. To assess statistical significance among groups, 1-way ANOVA followed by the Tukey–Kramer test was used. *P < .05; **P < .01 (A,C,D); n.s., not significant.
Figure 3.
Figure 3.
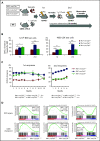
Calr haploinsufficiency confers hematopoietic stem cells with a clonal advantage over WT cells. (A) Schematic depiction of the competitive and serial repopulation assay. Test cells (1 × 10⁶ unpurified BM cells or 1 × 10³ sorted LSK cells) (B6-CD45.2) and 1 × 10⁶ unpurified wild-type (WT) BM competitor cells (B6-CD45.1/45.2) were transplanted into lethally irradiated recipients (B6-CD45.1; n = 14 in each group), and then 1 × 10⁶ BM cells (harvested from 2 of those recipients) were transplanted into a second set of lethally irradiated WT recipients (B6-CD45.1; n = 14 in each group). Observation was continued for 12 months of mice not used for cell transplantation. Donor chimerism was calculated as CD45.2/(CD45.2 + CD45.1/45.2). (B) The percent chimerism of donor-derived CD45.2 cells in PB at 16 weeks after the first and second transplantations is shown. (C) The percent chimerism of donor cells was recorded for 12 months in primary recipients (n = 12 in each group) and for 6 months in secondary recipients (n = 14 in each group). (D) Results of GSEA analysis for Mx1-cre;Calr+/+, Mx1-cre;Calr+/, and Mx1-cre;Calrf/ LSK cells isolated from recipient mice at 12 weeks after BM transplantation. In hallmark gene sets, E2F target genes and G2M checkpoint genes were significantly enriched in Mx1-cre;Calr+/ LSK cells compared with Mx1-cre;Calr+/+ and Mx1-cre;Calrf/ LSK cells. All data are presented as the means ± SEM. To assess statistical significance among groups, 1-way ANOVA followed by the Tukey–Kramer test was used (B). For comparison of chimerism over time, ANOVA with repeated measures was used (C). *P < .05; **P < .01; n.s., not significant.
Figure 4.
Figure 4.
Calr haploinsufficiency does not affect disease severity in CALRdel52;Calr+/+ mice. (A) Average complete blood cell counts (n = 21 in each group). Both CALRdel52;Calr+/+ mice and CALRdel52;Calr+/− mice developed thrombocytosis, and the degree of the increase was equivalent. (B) Proportions of HSCs and progenitors in BM. Compared with WT mice, increases in HSCs and hematopoietic progenitor cells were observed in both groups of mice, and the degree of the increase was equivalent. (C) Spleen weight of 4- to 6-month-old mice (n = 11-12 in each group). No difference was found in the spleen weight among the 3 groups of mice. (D) Kaplan-Meier plot of WT, CALRdel52;Calr+/+, and CALRdel52;Calr+/− mice (n = 21 in each group). All data are presented as means ± SEM. Statistical analyses of survival were performed with the log-rank test. To assess statistical significance among groups, 1-way ANOVA followed by the Tukey–Kramer test was used. *P < .05; **P < .01; n.s., not significant.
Figure 5.
Figure 5.
Calr haploinsufficiency restores the functions of hematopoietic stem cells impaired by the CALRdel52 mutation. (A) Competitive repopulation assay. LSK cells (1 × 10³ cells) sorted from WT mice, CALRdel52;Calr+/+ mice, and CALRdel52;Calr+/− mice (B6-CD45.2) together with 1 × 10⁶ WT unpurified BM competitor cells (B6-CD45.1) were transplanted into lethally irradiated recipients (B6-CD45.1). Donor chimerism was calculated as CD45.2/(CD45.1 + CD45.2). (B) The percentage of chimerism of donor cells was recorded for 10 months (n = 14 in each group). (C) BM histopathology and megakaryocyte number. Megakaryocytes in BM were significantly increased in CALRdel52;Calr+/− mice (n = 5) compared with WT (n = 4) and CALRdel52;Calr+/+ (n = 5) mice (bars represent 20 μm). (D) Average complete blood cell counts (n = 14 in each group). (A-B) For comparison of hematologic values over time, ANOVA with repeated measures was used. (C) One-way ANOVA followed by the Tukey-Kramer test was used to assess the number of megakaryocytes among groups. *P < .05; **P < .01; n.s., not significant.
Figure 6.
Figure 6.
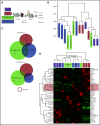
Gene expression changes due to Calr haploinsufficiency and the CALRdel52 mutant. (A) Cell collection conditions in RNAseq experiments. Unpurified BM cells (1 × 10⁶; B6-CD45.2) were transplanted into lethally irradiated recipients (B6-CD45.1; n = 9-12 in each group). At 8 to 12 weeks after transplantation, 2 × 10⁴ CD45.2+ LSK cells were sorted from BM cells pooled from 3 recipient mice and used as a sample for RNAseq analysis. We prepared a total of 14 samples: 3 WT, 3 Calr+/−, 4 CALRdel52;Calr+/+, and 4 CALRdel52;Calr+/−. (B) Unsupervised hierarchical clustering of the global gene expression signatures. (C) Venn diagram depicting differentially expressed genes in LSK cells from Calr+/−, CALRdel52;Calr+/+, and CALRdel52;Calr+/− mice relative to WT controls (false discovery rate <0.1). Forty-seven genes were differentially expressed (23 upregulated and 24 downregulated) in Calr+/− mice. (D) Hierarchical clustering of expression profiles of these 14 samples according to the 47 genes differentially expressed in Calr+/− mice. Genes (rows) and genotypes (columns) with dendrograms are shown. Dendrograms were constructed using Pearson correlation. This analysis distinguished the 4 genotypes relatively clearly. The second cluster of genes was upregulated in Calr+/− mice and CALRdel52;Calr+/− mice and was clearly downregulated in WT and CALRdel52;Calr+/+ mice (colored with red). (E) Result of GSEA analysis showing enrichment of the stem cell signature in CALRdel52;Calr+/− LSK cells compared with CALRdel52;Calr+/+ LSK cells. (F) GSEA results using hallmark gene sets for CALRdel52;Calr+/− and CALRdel52;Calr+/+ LSK cells. Heatmap shows the normalized enrichment score (NES) of significantly altered gene sets in CALRdel52;Calr+/− cells compared with CALRdel52;Calr+/+ cells (false discovery rate q value <0.25 or normalized P value <.05). Positive ES (red) indicates that the gene set was enriched in CALRdel52;Calr+/− LSK cells, and negative ES (blue) indicates that the gene set was de-enriched in CALRdel52;Calr+/− LSK cells. Result of GSEA analysis gene sets highlighted in blue or red are shown
Figure 6.
Figure 6.
Gene expression changes due to Calr haploinsufficiency and the CALRdel52 mutant. (A) Cell collection conditions in RNAseq experiments. Unpurified BM cells (1 × 10⁶; B6-CD45.2) were transplanted into lethally irradiated recipients (B6-CD45.1; n = 9-12 in each group). At 8 to 12 weeks after transplantation, 2 × 10⁴ CD45.2+ LSK cells were sorted from BM cells pooled from 3 recipient mice and used as a sample for RNAseq analysis. We prepared a total of 14 samples: 3 WT, 3 Calr+/−, 4 CALRdel52;Calr+/+, and 4 CALRdel52;Calr+/−. (B) Unsupervised hierarchical clustering of the global gene expression signatures. (C) Venn diagram depicting differentially expressed genes in LSK cells from Calr+/−, CALRdel52;Calr+/+, and CALRdel52;Calr+/− mice relative to WT controls (false discovery rate <0.1). Forty-seven genes were differentially expressed (23 upregulated and 24 downregulated) in Calr+/− mice. (D) Hierarchical clustering of expression profiles of these 14 samples according to the 47 genes differentially expressed in Calr+/− mice. Genes (rows) and genotypes (columns) with dendrograms are shown. Dendrograms were constructed using Pearson correlation. This analysis distinguished the 4 genotypes relatively clearly. The second cluster of genes was upregulated in Calr+/− mice and CALRdel52;Calr+/− mice and was clearly downregulated in WT and CALRdel52;Calr+/+ mice (colored with red). (E) Result of GSEA analysis showing enrichment of the stem cell signature in CALRdel52;Calr+/− LSK cells compared with CALRdel52;Calr+/+ LSK cells. (F) GSEA results using hallmark gene sets for CALRdel52;Calr+/− and CALRdel52;Calr+/+ LSK cells. Heatmap shows the normalized enrichment score (NES) of significantly altered gene sets in CALRdel52;Calr+/− cells compared with CALRdel52;Calr+/+ cells (false discovery rate q value <0.25 or normalized P value <.05). Positive ES (red) indicates that the gene set was enriched in CALRdel52;Calr+/− LSK cells, and negative ES (blue) indicates that the gene set was de-enriched in CALRdel52;Calr+/− LSK cells. Result of GSEA analysis gene sets highlighted in blue or red are shown

Comment in

References

    1. Swerdlow SHCE, Harris NL, Jaffe ES, et al. . WHO Classification of Tumours of Haematopoietic and Lymphoid Tissues. Revised Fourth Edition Geneva, Switzerland: IARC press; 2017.
    1. Kralovics R, Passamonti F, Buser AS, et al. . A gain-of-function mutation of JAK2 in myeloproliferative disorders. N Engl J Med. 2005;352(17):1779-1790. - PubMed
    1. James C, Ugo V, Le Couédic JP, et al. . A unique clonal JAK2 mutation leading to constitutive signalling causes polycythaemia vera. Nature. 2005;434(7037):1144-1148. - PubMed
    1. Baxter EJ, Scott LM, Campbell PJ, et al. ; Cancer Genome Project . Acquired mutation of the tyrosine kinase JAK2 in human myeloproliferative disorders. Lancet. 2005;365(9464):1054-1061. - PubMed
    1. Levine RL, Wadleigh M, Cools J, et al. . Activating mutation in the tyrosine kinase JAK2 in polycythemia vera, essential thrombocythemia, and myeloid metaplasia with myelofibrosis. Cancer Cell. 2005;7(4):387-397. - PubMed

Publication types