

In vitro inhibition of human cytochrome P450 enzymes by the novel atypical antipsychotic drug asenapine: a prediction of possible drug-drug interactions
- PMID: 32219694
- PMCID: PMC7329795
- DOI: 10.1007/s43440-020-00089-z
In vitro inhibition of human cytochrome P450 enzymes by the novel atypical antipsychotic drug asenapine: a prediction of possible drug-drug interactions
Abstract
Background: Inhibition of cytochrome P450 (CYP) enzymes is the most common cause of harmful drug-drug interactions. The present study aimed at examining the inhibitory effect of the novel antipsychotic drug asenapine on the main CYP enzymes in human liver.
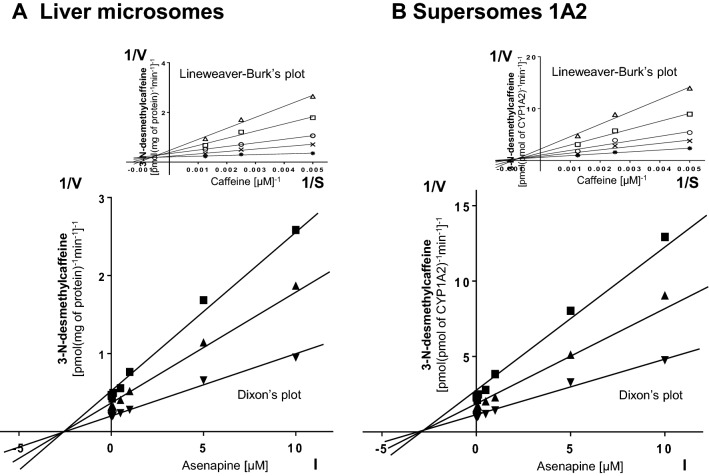
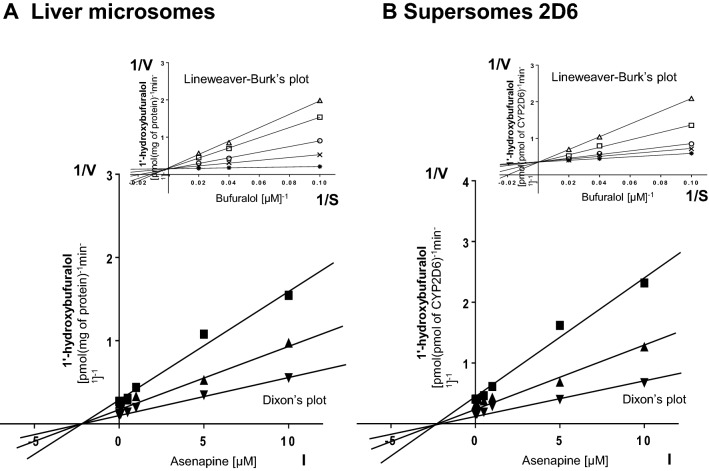
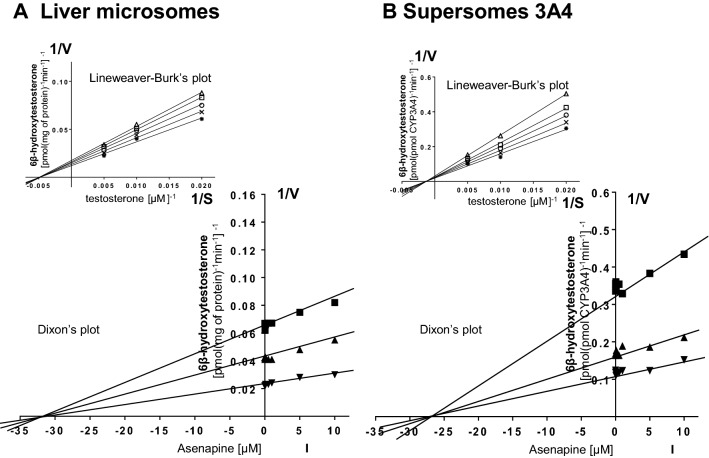
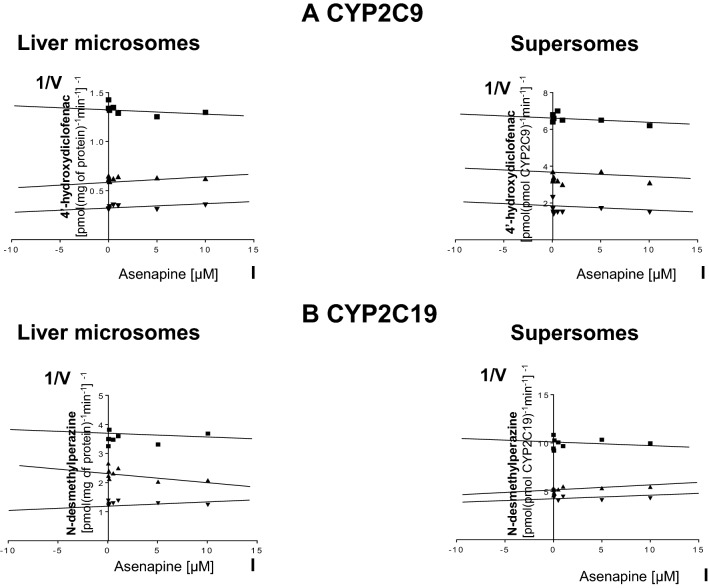
Methods: The experiments were performed in vitro using pooled human liver microsomes and the human cDNA-expressed CYP enzymes: CYP1A2, CYP2C9, CYP2C19, CYP2D6, and CYP3A4 (Supersomes). Activities of CYP enzymes were determined using the CYP-specific reactions: caffeine 3-N-demethylation (CYP1A2), diclofenac 4'-hydroxylation (CYP2C9), perazine N-demethylation (CYP2C19), bufuralol 1'-hydroxylation (CYP2D6), and testosterone 6β-hydroxylation (CYP3A4). The rates of the CYP-specific reactions were assessed in the absence and presence of asenapine using HPLC.
Results: The obtained results showed that both in human liver microsomes and Supersomes asenapine potently and to a similar degree inhibited the activity of CYP1A2 via a mixed mechanism (Ki = 3.2 μM in liver microsomes and Supersomes) and CYP2D6 via a competitive mechanism (Ki = 1.75 and 1.89 μM in microsomes and Supersomes, respectively). Moreover, asenapine attenuated the CYP3A4 activity via a non-competitive mechanism (Ki = 31.3 and 27.3 μM in microsomes and Supersomes, respectively). In contrast, asenapine did not affect the activity of CYP2C9 or CYP2C19.
Conclusion: The potent inhibition of CYP1A2 and CYP2D6 by asenapine, demonstrated in vitro, will most probably be observed also in vivo, since the calculated Ki values are close to the presumed concentration range for asenapine in the liver in vivo. Therefore, pharmacokinetic interactions involving asenapine and CYP2D6 or CYP1A2 substrates are likely to occur during their co-administration to patients.
Keywords: Asenapine; Cytochrome P450; Human liver microsomes; Inhibition; cDNA-expressed CYP enzymes.
Conflict of interest statement
The authors declare that there is no conflict of interest.
Figures
References
-
- Shimada T, Yamazaki H, Mimura M, Inui Y, Guengerich FP. Interindividual variations in human liver cytochrome P-450 enzymes involved in the oxidation of drugs, carcinogens and toxic chemicals: studies with liver microsomes of 30 Japanese and 30 Caucasians. J Pharmacol Exp Ther. 1994;270:414–423. - PubMed
-
- Lin JH. CYP induction-mediated drug interactions: in vitro assessment and clinical implications. Pharm Res. 2006;23:1089–1116. - PubMed
-
- Rostami-Hodjegan A, Tucker GT. Simulation and prediction of in vivo drug metabolism in human populations from in vitro data. Nat Rev Drug Discov. 2007;6:140–148. - PubMed
-
- Pelkonen O, Turpeinen M, Hakkola J, Honkakoski P, Hukkanen J, Raunio H. Inhibition and induction of human cytochrome P450 enzymes: current status. Arch Toxicol. 2008;82:667–715. - PubMed
-
- Zanger UM, Schwab M. Cytochrome P450 enzymes in drug metabolism: regulation of gene expression, enzyme activities, and impact of genetic variation. Pharmacol Ther. 2013;138:103–141. - PubMed
MeSH terms
Substances
LinkOut - more resources
Full Text Sources
Other Literature Sources