. 2020 Jul;88(1):18-32.
doi: 10.1002/ana.25723. Epub 2020 Apr 21.

ATPase Domain AFG3L2 Mutations Alter OPA1 Processing and Cause Optic Neuropathy

Affiliations

ATPase Domain AFG3L2 Mutations Alter OPA1 Processing and Cause Optic Neuropathy

Leonardo Caporali et al. Ann Neurol. 2020 Jul.

Abstract

Objective: Dominant optic atrophy (DOA) is the most common inherited optic neuropathy, with a prevalence of 1:12,000 to 1:25,000. OPA1 mutations are found in 70% of DOA patients, with a significant number remaining undiagnosed.

Methods: We screened 286 index cases presenting optic atrophy, negative for OPA1 mutations, by targeted next generation sequencing or whole exome sequencing. Pathogenicity and molecular mechanisms of the identified variants were studied in yeast and patient-derived fibroblasts.

Results: Twelve cases (4%) were found to carry novel variants in AFG3L2, a gene that has been associated with autosomal dominant spinocerebellar ataxia 28 (SCA28). Half of cases were familial with a dominant inheritance, whereas the others were sporadic, including de novo mutations. Biallelic mutations were found in 3 probands with severe syndromic optic neuropathy, acting as recessive or phenotype-modifier variants. All the DOA-associated AFG3L2 mutations were clustered in the ATPase domain, whereas SCA28-associated mutations mostly affect the proteolytic domain. The pathogenic role of DOA-associated AFG3L2 mutations was confirmed in yeast, unraveling a mechanism distinct from that of SCA28-associated AFG3L2 mutations. Patients' fibroblasts showed abnormal OPA1 processing, with accumulation of the fission-inducing short forms leading to mitochondrial network fragmentation, not observed in SCA28 patients' cells.

Interpretation: This study demonstrates that mutations in AFG3L2 are a relevant cause of optic neuropathy, broadening the spectrum of clinical manifestations and genetic mechanisms associated with AFG3L2 mutations, and underscores the pivotal role of OPA1 and its processing in the pathogenesis of DOA. ANN NEUROL 2020 ANN NEUROL 2020;88:18-32.


Conflict of interest statement

Nothing to report.

Figures

Figure 1
Figure 1
Pedigree of the 12 optic atrophy families with segregation of the identified AFG3L2 variants. Black symbols indicate patients with optic neuropathy; gray symbols indicate subjects with subclinical phenotype. Arrows indicate family index cases. Asterisks indicate individuals manifesting optic atrophy along with adjunctive neurological findings (see details in the Table).
Figure 2
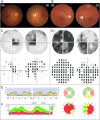
Figure 2
Ophthalmologic findings. Ophthalmologic features in 2 patients: a mild case (F2 IV‐1; A, C, and E) and a severe case (F3 II‐3; B, D, and F). For each case, fundus oculi (A, B), Humphrey visual fields 30–2 (C, D), and retinal nerve fiber layer (RNFL) thickness measurements on optical coherence tomography (E, F) are reported. The mild case displays only a temporal pallor at fundus oculi, which congruently corresponds to central scotoma, and a selective temporal loss of RNFL thickness. The severe case presents with generalized pallor of the optic disk, widespread loss of sensitivity at visual field, and global loss of RNFL thickness. I,INF = inferior; L = left; N,NAS = nasal; OD = "Oculus Dexter" or right eye; OS = "Oculus Sinister" or left eye; R = right; S,SUP = superior; T,TMP = temporal.
Figure 3
Figure 3
Mutation distribution on AFG3L2 protein. AFG3L2 (NM_006796.3) pathogenic variants associated with optic atrophy (red), spinocerebellar ataxia 28 (SCA28; black), and spastic ataxia syndrome 5 (SPAX5; blue) phenotypes. Details and references are reported in Supplementary Table 2. Variants reported in this study are in bold. Biallelic variants are underlined. The distribution of pathogenic variants associated with isolated optic atrophy, which are predominantly located in the ATPase domain, is distinct from those associated with SCA28 and SPAX5, which are mainly located in the proteolytic domain.
Figure 4
Figure 4
Studies in yeast cells expressing mutant human AFG3L2. Respiratory phenotype of yta10Δyta12Δ yeast cells expressing normal and mutant human AFG3L2 is shown. Serial dilutions of normalized yeast cultures were spotted on YEP plates containing 2% glucose (YPD) or 2% glycerol (YPG) and incubated at 28°C for 3 days. Respiratory competence was deduced by the ability to grow on 2% glycerol (YPG). (A) Respiratory phenotype of K699 (wild‐type [WT] yeast strain) and yta10Δyta12Δ cells expressing either normal (WT) AFG3L2 or AFG3L2 carrying the mutations indicated. (B) Respiratory phenotype of K699 and yta10Δyta12Δ cells coexpressing either normal or mutant human AFG3L2 with human paraplegin. Dislocase (ATPase) and proteolytic activity of normal and mutant human AFG3L2 in yeast is shown. (C, D) Fluorescence immunoblot analysis of Ccp1 and MrpL32 precursor (p) and mature (m) forms in yeast cells expressing either normal (WT) or mutant human AFG3L2 alone (C) and coexpressed with paraplegin (D). Dislocase (ATPase) and proteolytic competence is assessed by precursor accumulation of Ccp1 and MrpL32, respectively. The slightly larger size of AFG3L2 observed in lanes 3–6 of C and D indicates defective autocatalytic processing25, 48 due to the proteolytic defect of mutants p.D407G, p.A462V, p.R465K, and p.P514L. β‐Actin was used as loading control in C and D. YEP plates = yeast growth medium composed of Yeast Extract and bacto‐Peptone.
Figure 5
Figure 5
AFG3L2 and OPA1 analysis in patients' fibroblasts. Protein expression in fibroblasts derived from 6 probands from 3 families (F2 IV‐1; F5 II‐5, III‐5; F6 I‐2, II‐1, II‐2) and controls are displayed; for each sample, family and subject identifier as well as the AFG3L2 mutation are indicated. (A) Western blot of AFG3L2 expression levels. (B) Actin was used as a loading control. (C) Western blot of OPA1 expression levels, with indication of long (L1, L2) and short (S1, S2, S3) bands; MTPα was used as a loading control. (D) HPS60 was used as mitochondrial mass indicator. (E‐F) Densitometric analysis of C shows a reduction of OPA1long/OPA1short ratio in all fibroblasts carrying AFG3L2 mutations (E) with no change in the total amount of OPA1 (F). Data, normalized to the control cells, are mean ± standard deviation of 3 independent experiments. Statistical analysis was performed by 1‐way analysis of variance with Dunnett multiple comparisons test. Asterisks indicate statistical significance (*adjusted p < 0.05, **adjusted p < 0.001).
Figure 6
Figure 6
Morphology of mitochondrial network in patients' fibroblasts. (A–H, J, K) Analysis of mitochondrial morphology in live cells with the mitochondrial dye MitoTracker Red‐CMXRos (A–H) and in fixed cells labeled with the anti‐Tom‐20 (J‐K), by fluorescence microscopy in control (n = 4) and patient (n = 6) fibroblasts, incubated in Dulbecco modified Eagle medium–galactose for 48 hours. Representatives images are shown for each cell line: controls (A, B, C); Family 5 II‐5 (D) and III‐5 (E); Family 6 I‐2 (F), II‐1 (G), and II‐2 (H); control (J); and Family 2 IV‐1 (K). Scale bars = 25μm. Analysis of the mitochondrial shape factors (circularity) are reported in the graphs. (I) Data (mean ± standard deviation) are presented as percentage compared to controls. (L) Quantitative analysis of mitochondrial morphology classified as fragmented (dark gray), intermediate (light gray), and filamentous (black). Patients' fibroblasts display a fragmented mitochondrial network. (M, N) Mitochondrial bioenergetics analysis. Oxygen consumption rate was measured by Seahorse in basal condition and after injection of 1μM oligomycin, 1μM carbonyl cyanide‐4‐(trifluoromethoxy)phenylhydrazone, 1μM rotenone, and/or 1μM antimycin A. The oxygen consumption rate values (pmol·O2 −1·min−1) were normalized either for protein content, as determined by the sulforhodamine B assay,31 or for cells number, as determined by CyQuant (Invitrogen). The analysis was carried out on fibroblasts from 2 controls and 6 patients (Family 2: IV‐1; Family 5: II‐5, F5 III‐5; Family 6: I‐2, II‐1, II‐2) expressed as maximum respiration rate (MRR; M) and respiratory control ratio (RCR; N). (O) Activities of mitochondrial respiratory chain complexes in muscle biopsies from Patients F5 II‐5 and F11 II‐1. Dashed lines indicate range of controls activity. Statistical analysis was performed by unpaired 2‐tailed t test. Asterisks indicate statistical significance (*p < 0.01).

References

    1. Carelli V, Ross‐Cisneros FN, Sadun AA. Mitochondrial dysfunction as a cause of optic neuropathies. Prog Retin Eye Res 2004;23:53–89. - PubMed
    1. Yu‐Wai‐Man P, Griffiths PG, Chinnery PF. Mitochondrial optic neuropathies—disease mechanisms and therapeutic strategies. Prog Retin Eye Res 2011;30:81–114. - PMC - PubMed
    1. Alexander C, Votruba M, Pesch UE, et al. OPA1, encoding a dynamin‐related GTPase, is mutated in autosomal dominant optic atrophy linked to chromosome 3q28. Nat Genet 2000;26:211–215. - PubMed
    1. Delettre C, Lenaers G, Griffoin JM, et al. Nuclear gene OPA1, encoding a mitochondrial dynamin‐related protein, is mutated in dominant optic atrophy. Nat Genet 2000;26:207–210. - PubMed
    1. Lenaers G, Hamel C, Delettre C, et al. Dominant optic atrophy. Orphanet J Rare Dis 2012;7:46. - PMC - PubMed

Publication types

Substances