. 2020 Apr 13;37(4):584-598.e11.
doi: 10.1016/j.ccell.2020.03.001. Epub 2020 Mar 26.

Loss of CHD1 Promotes Heterogeneous Mechanisms of Resistance to AR-Targeted Therapy via Chromatin Dysregulation

Affiliations

Loss of CHD1 Promotes Heterogeneous Mechanisms of Resistance to AR-Targeted Therapy via Chromatin Dysregulation

Zeda Zhang et al. Cancer Cell. .

Abstract

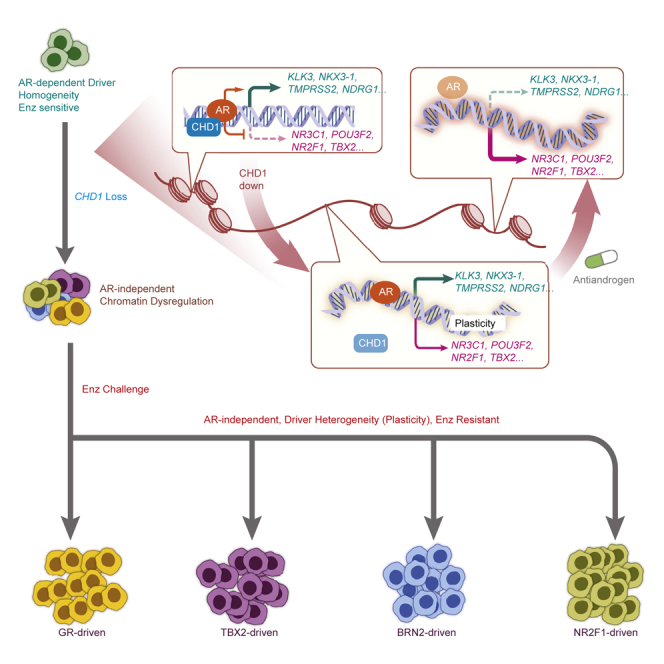
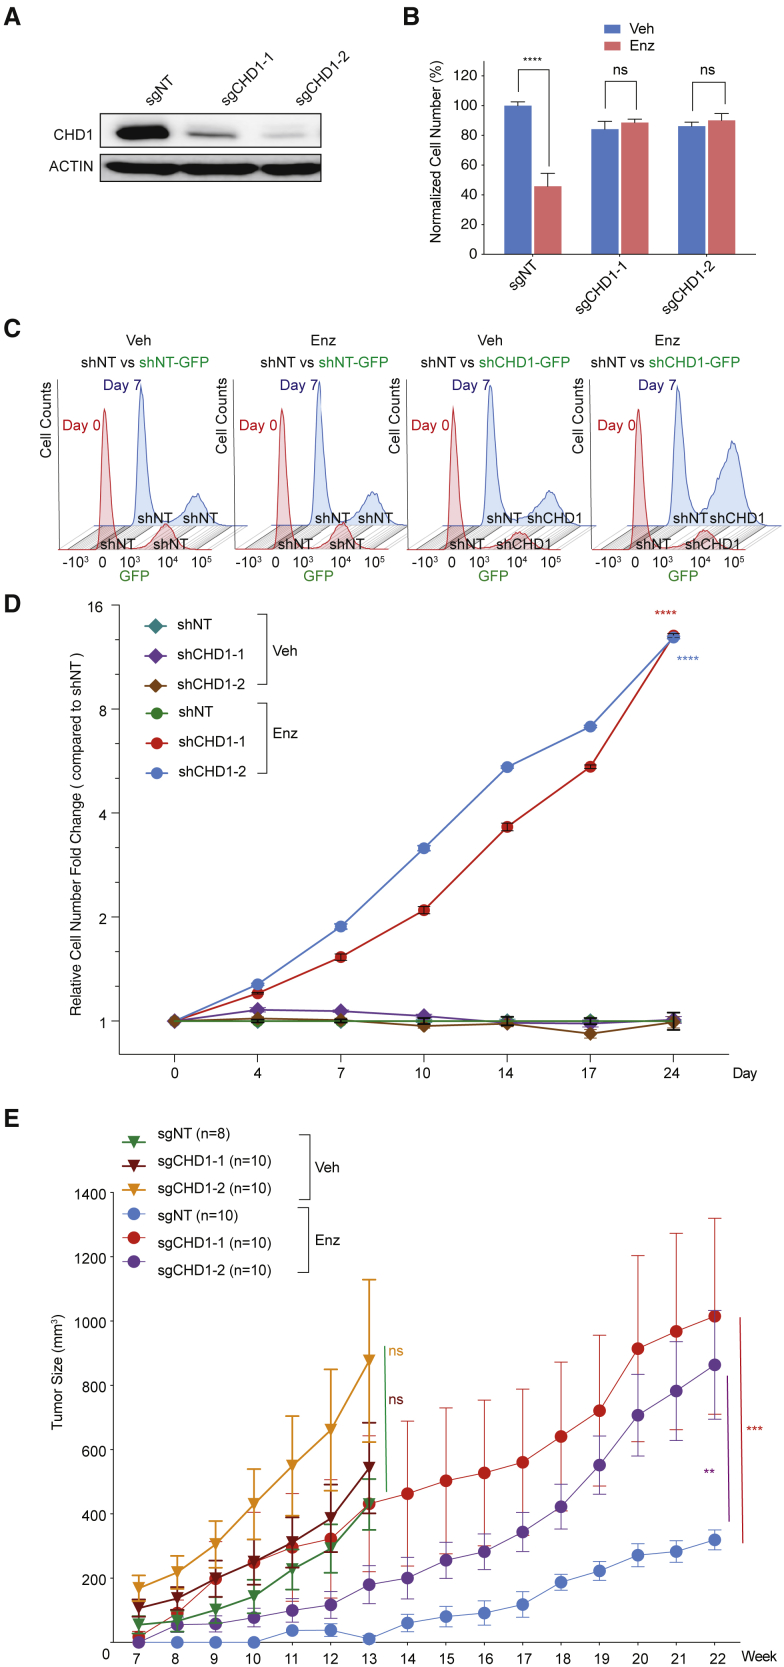
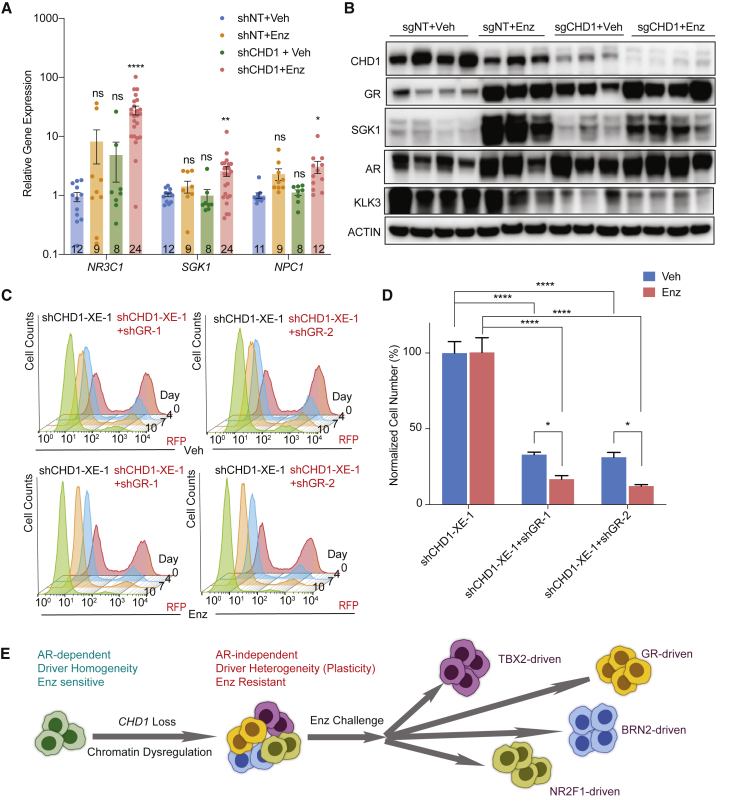
Metastatic prostate cancer is characterized by recurrent genomic copy number alterations that are presumed to contribute to resistance to hormone therapy. We identified CHD1 loss as a cause of antiandrogen resistance in an in vivo small hairpin RNA (shRNA) screen of 730 genes deleted in prostate cancer. ATAC-seq and RNA-seq analyses showed that CHD1 loss resulted in global changes in open and closed chromatin with associated transcriptomic changes. Integrative analysis of this data, together with CRISPR-based functional screening, identified four transcription factors (NR3C1, POU3F2, NR2F1, and TBX2) that contribute to antiandrogen resistance, with associated activation of non-luminal lineage programs. Thus, CHD1 loss results in chromatin dysregulation, thereby establishing a state of transcriptional plasticity that enables the emergence of antiandrogen resistance through heterogeneous mechanisms.

Keywords: CHD1; NR2F1; NR3C1 (GR); POU3F2 (BRN2); TBX2; antiandrogen resistantce; castration-resistant prostate cancer; chromatin remodeling; lineage plasticity; tumor heterogeneity.


Conflict of interest statement

Declaration of Interests C.L.S. and J.W. are co-inventors of enzalutamide and apalutamide and may be entitled to royalties. C.L.S. serves on the Board of Directors of Novartis and is a co-founder of ORIC Pharm. He is a science advisor to Agios, Beigene, Blueprint, Column Group, Foghorn, Housey Pharma, Nextech, KSQ, Petra, and PMV. He was a co-founder of Seragon, purchased by Genentech/Roche in 2014. S.W.L. is a founder and member of the scientific advisory board of ORIC Pharmaceuticals, Blueprint Medicines, and Mirimus, Inc.; he is also on the scientific advisory board of PMV Pharmaceuticals, Constellation Pharmaceuticals, and Petra Pharmaceuticals. W.A. reports consulting for Clovis Oncology, Janssen, MORE Health, and ORIC Pharmaceuticals. He received honoraria from CARET and travel accommodations from GlaxoSmith Kline, Clovis Oncology, and ORIC Pharmaceuticals. C.E.M is a co-founder and board member for Biotia and Onegevity Health, as well as an advisor for Genpro and Karius.

Figures

None
Graphical abstract
Figure 1
Figure 1
An In Vivo shRNA Library Screen of the Human Prostate Cancer Deletome (A) Schematic representation of a miR-E shRNA library targeting the human prostate cancer deletome. (B) Schematic representation of enzalutamide resistance screen using the miR-E shRNA library. (C) Violin plot of the shRNA normalized read counts in the combined plasmid pools (n = 43), pregrafts (n = 21), and enzalutamide-resistant tumors (n = 344). (D) Cumulative distribution of library shRNAs in the combined plasmid pools (n = 43), pregrafts (n = 21), and enzalutamide-resistant tumors (n = 344). See also Figure S1 and Tables S1 and S2.
Figure 2
Figure 2
In Vivo Screen Identifies CHD1 as Top Candidate Responsible for Resistance to Antiandrogen (A) Graphical representation of analyzed results of the library screen, using RIGER-E method. –Log10 of p value is presented and the area of p < 0.0001 is highlighted. The top eight candidate genes are presented as large red dots with gene symbol. Negative control gene TBC1D4 is presented as a large green dot. (B) Graphical representation of the percentage of tumors which have shRNAs targeting a specific gene and are enriched in resistant tumors. (C) Graphical representation of the number of genes which have multiple independent shRNAs enriched in resistant tumors. (D) Bee swarm plot of the normalized shRNA read counts of a representative pool in the plasmid, pregraft, and resistant tumors, median is presented as a red line (medians below 1 are not presented on log2 scale). shCHD1s are presented as large red dots. See also Table S3.
Figure 3
Figure 3
CHD1 Loss Confers Significant Resistance to Antiandrogen In Vitro and In Vivo (A) Western blot of CHD1 in LNCaP/AR cells transduced with annotated guide RNAs. (B) Relative cell number of LNCaP/AR cells transduced with annotated guide RNAs, normalized to sgNT + Veh group. Cells were treated with 10 μM enzalutamide (Enz) or DMSO (Veh) for 7 days and cell numbers were counted. p values were calculated using multiple t tests, three biological replicates in each group. (C) Histograms of representative fluorescence-activated cell sorting-based competition assay showing the distribution of shNT LNCaP/AR cells (GFP-negative) compared with cells transduced with cis-linked shCHD1-GFP or shNT-GFP shRNAs (GFP positive). The distribution on day 0 is shown in red and day 7 is shown in blue. (D) Relative cell number fold change compared with shNT group, based on the results of (C). Enz denotes enzalutamide of 10 μM and Veh denotes DMSO. p values were calculated using two-way ANOVA, three biological replicates in each group. (E) Tumor growth curve of xenografted LNCaP/AR cells transduced with annotated guide RNAs. Enz denotes enzalutamide treatment at 10 mg/kg from day 1 of grafting. Veh denotes 0.5% CMC + 0.1% Tween 80. p values were calculated using two-way ANOVA. For all panels, mean ± SEM is presented. ∗∗∗∗p < 0.0001, ∗∗∗p < 0.001, ∗∗p < 0.01, p < 0.05. See also Figures S2 and S3.
Figure 4
Figure 4
CHD1 mRNA Level Is Correlated with Clinical Outcome of Antiandrogen Treatment (A) Pearson correlation analysis of CHD1 mRNA and time of treatment on abiraterone (Abi)/enzalutamide (Enz)/apalutamide (Apa) of a 52 mCRPC patient cohort. (B) CHD1 expression distribution in all patients of the cohort in (A). (C) Probability of treatment duration of the top quartile compared with bottom quartile of all patients treated with abiraterone (Abi)/enzalutamide (Enz)/apalutamide (Apa); p value was calculated using Mantel-Cox test. (D) Cox hazard ratio analysis of the top and bottom quartile of all patients, p value was calculated using log rank test. (E) Probability of treatment duration of the above median compared with below median of patients who received enzalutamide (Enz)/apalutamide (Apa), p value was calculated using Mantel-Cox test. (F) Probability of treatment duration of the above median compared with below median of patients who received abiraterone (Abi), p value was calculated using Mantel-Cox test. (G) Pearson correlation analysis of CHD1 mRNA and time of treatment on patients who received enzalutamide (Enz)/apalutamide (Apa), n = 21 (2 patients received both apalutamide and abiraterone). (H) Pearson correlation analysis of CHD1 mRNA and time of treatment on patients who received abiraterone (Abi), n = 33.
Figure 5
Figure 5
Integrated Analysis of RNA-seq and ATAC-Seq Reveals Candidate Transcription Factor Drivers of Enzalutamide Resistance (A) Relative gene expression of AR and AR target genes in tumors collected from LNCaP/AR xenografts, all normalized and compared with shNT + Veh group. Mean ± SEM is presented. p values were calculated using two-way ANOVA and numbers of biological replicates are presented. ∗∗∗∗p < 0.0001, ∗∗∗p < 0.001, ∗∗p < 0.01, p < 0.05. (B) Western blot showing AR and AR targets in tumors collected from LNCaP/AR xenografts. For both (A) and (B), Enz denotes enzalutamide treatment at 10 mg/kg from day 1 of grafting. Veh denotes 0.5% CMC + 0.1% Tween 80. (C) Graphical representation of the ATAC-seq peaks changes (gain or loss) in cell lines compared with shNT. (D) The distribution of ATAC-seq peak locations in different genetic regions. For both (C) and (D), reads from three biological replicates were pooled to calculate the consensus peaks. (E) Venn diagram represents the overlap of the most differentially expressed genes in four groups compared with shNT. Cutoff values of fold change greater than 2 and false discovery rate ≤ 0. 1 were used. Reads from three biological replicates in each group were used for analysis. (F) Heatmap represents the expression fold changes (comparing to shNT) of the top 30 genes ranked by RNA-Score, three biological replicates in each group. (G) Heatmap represents the motif differential changes (compared with shNT) of the top 30 genes ranked by ATAC-Score, three biological replicates in each group. (H) Rank of candidate transcription factors (TFs) are shown based on the adjusted Combined-Score. Top candidate TFs selected for functional CRISPR library screen are presented in red. See also Figures S4 and S5 and Table S4.
Figure 6
Figure 6
Functional CRISPR Screen Identifies Four Alternative TFs as Drivers of Antiandrogen Resistance (A) Schematic representation of the functional CRISPR library screen in shCHD1 LNCaP/AR cells. shCHD1 cells were transduced with Cas9 and pooled single guide RNAs targeting individual TFs and achieved cell mixtures of 50%–90% RFP-positive cells (shCHD1 + sgTF) versus RFP-negative cells (shCHD1 only). (B) Scatterplot summarizing the results of the screen. Each dot represents pooled guide RNAs targeting a specific gene. The x axis is the percentage of RFP cells at day 0 and the y axis is the percentage at day 7. The green dot identifies the sgNT control. Genes that scored positive in the screen are highlighted in red. (C) Relative cell number of LNCaP/AR cells transduced with annotated guide RNAs, normalized to shNT + sgNT + Veh group. Cells were treated with 10 μM enzalutamide (Enz) or DMSO (Veh) for 7 days and cell numbers were counted. Mean ± SEM is presented, and p values were calculated by multiple t tests, with three biological replicates in each group. (D) Relative gene expression level of the four TF genes in LNCaP/AR cells transduced with annotated inducible shRNAs at various time points. Mean ± SEM is presented, p values were calculated by two-way ANOVA, all compared with 0 h, with three technical replicates in each group. ∗∗∗∗p < 0.0001, ∗∗∗p < 0.001, ∗∗p < 0.01, p < 0.05. See also Figure S6 and Table S5.
Figure 7
Figure 7
CHD1 Loss Enhanced Prostate Cancer Cell Heterogeneity and Lineage Plasticity (A) Heatmap represents the expression fold changes (qPCR) of the top four resistance driver genes and CHD1 in different xenografts derived cell lines, three technical replicates for each line. (B) Heatmap represents the expression fold changes of the top four resistant driver genes (qPCR) in shCHD1 cell line treated with 10 μM enzalutamide (Enz) in charcoal-stripped serum medium, three biological replicates for each line. (C) Unsupervised clustering of 212 patients based on the gene expression level (Z score) of CHD1 and the 4 TFs. (D) Relative gene expression level (qPCR) of lineage-specific markers and EMT genes in selective shCHD1-XE and sgCHD1-XE cell lines, three technical replicates for each line. See also Figure S7.
Figure 8
Figure 8
GR Inhibition Has Significant Antitumor Effect on Antiandrogen-Resistant Tumors with CHD1 Loss (A) Relative gene expression of NR3C1 and GR target genes in tumors collected from LNCaP/AR xenografts, all normalized and compared with shNT + Veh group. Mean ± SEM is presented. p values were calculated using two-way ANOVA, and numbers of biological replicates are presented. (B) Western blot showing AR, GR, and their downstream target genes in xenografted LNCaP/AR tumors. For (A) and (B), Enz denotes enzalutamide at 10 mg/kg from day 1 of grafting. Veh denotes 0.5% CMC + 0.1% Tween 80. (C) Histograms of representative FACS-based competition assay showing the distribution of shCHD1-XE-1 cells (RFP-negative) versus shCHD1-XE-1 cells transduced with shGR (RFP-positive). The distributions on different days are presented in different colors. (D) Relative cell number of shCHD1-XE-1 cells transduced with annotated inducible shRNAs, normalized to shCHD1-XE-1 + Veh. Cells were treated with 250 ng/mL doxycycline for 48 h, and then 7 days of 10 μM enzalutamide (Enz) or DMSO (Veh) before cell numbers were counted. Mean ± SEM is presented, and p values were calculated by two-way ANOVA, with three biological replicates in each group. (E) Model depicting the chromatin dysregulation (plasticity) and antiandrogen resistance in mCRPC due to CHD1 loss. For all panels, ∗∗∗∗p < 0.0001, ∗∗∗p < 0.001, ∗∗p < 0.01, p < 0.05. See also Figure S8.

References

    1. Abida W., Armenia J., Gopalan A., Brennan R., Walsh M., Barron D., Danila D., Rathkopf D., Morris M., Slovin S. Prospective genomic profiling of prostate cancer across disease states reveals germline and somatic alterations that may affect clinical decision making. JCO Precis Oncol. 2017;2017 doi: 10.1200/PO.17.00029. - DOI - PMC - PubMed
    1. Abida W., Cyrta J., Heller G., Prandi D., Armenia J., Coleman I., Cieslik M., Benelli M., Robinson D., Allen E.M. Genomic correlates of clinical outcome in advanced prostate cancer. Proc. Natl. Acad Sci U S A. 2019;116:11428–11436. - PMC - PubMed
    1. Albrecht B.K., Gehling V.S., Hewitt M.C., Vaswani R.G., Côtô A., Leblanc Y., Nasveschuk C.G., Bellon S., Bergeron L., Campbell R. Identification of a benzoisoxazoloazepine inhibitor (CPI-0610) of the bromodomain and extra-terminal (BET) family as a candidate for human clinical trials. J. Med. Chem. 2016;59:1330–1339. - PubMed
    1. Alizadeh A.A., Aranda V., Bardelli A., Blanpain C., Bock C., Borowski C., Caldas C., Califano A., Doherty M., Elsner M. Toward understanding and exploiting tumor heterogeneity. Nat. Med. 2015;21:846–853. - PMC - PubMed
    1. Arora V.K., Schenkein E., Murali R., Subudhi S.K., Wongvipat J., Balbas M.D., Shah N., Cai L., Efstathiou E., Logothetis C. Glucocorticoid receptor confers resistance to antiandrogens by bypassing androgen receptor blockade. Cell. 2013;155:1309–1322. - PMC - PubMed

Publication types

MeSH terms