. 2020 Apr 6;53(1):102-116.e8.
doi: 10.1016/j.devcel.2020.02.019. Epub 2020 Mar 26.

Dynamic Transcriptional Responses to Injury of Regenerative and Non-regenerative Cardiomyocytes Revealed by Single-Nucleus RNA Sequencing

Affiliations

Dynamic Transcriptional Responses to Injury of Regenerative and Non-regenerative Cardiomyocytes Revealed by Single-Nucleus RNA Sequencing

Miao Cui et al. Dev Cell. .

Erratum in

Abstract

The adult mammalian heart is incapable of regeneration following injury. In contrast, the neonatal mouse heart can efficiently regenerate during the first week of life. The molecular mechanisms that mediate the regenerative response and its blockade in later life are not understood. Here, by single-nucleus RNA sequencing, we map the dynamic transcriptional landscape of five distinct cardiomyocyte populations in healthy, injured, and regenerating mouse hearts. We identify immature cardiomyocytes that enter the cell cycle following injury and disappear as the heart loses the ability to regenerate. These proliferative neonatal cardiomyocytes display a unique transcriptional program dependent on nuclear transcription factor Y subunit alpha (NFYa) and nuclear factor erythroid 2-like 1 (NFE2L1) transcription factors, which exert proliferative and protective functions, respectively. Cardiac overexpression of these two factors conferred protection against ischemic injury in mature mouse hearts that were otherwise non-regenerative. These findings advance our understanding of the cellular basis of neonatal heart regeneration and reveal a transcriptional landscape for heart repair following injury.

Keywords: NFE2L1; NFYa; cell survival; heart regeneration; ischemia; transcriptional response to injury.


Conflict of interest statement

Declaration of Interests The authors declare no competing interests.

Figures

Figure 1.
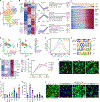
Figure 1.. Single-nucleus RNA sequencing identifies distinct cardiomyocyte populations in neonatal heart.
See also Figure S1 and Figure S2. A. Schematic showing myocardial infarction (MI) or sham surgery performed at P1 and subsequent days (d) of sample collection for pH3 staining. B. Fold change of pH3+ cardiomyocytes (cTnT+) in MI hearts at 1-, 3-, and 7-days after P1 surgery compared with sham hearts at the same stage (Sham heart n=3, MI heart n=4). *p<0.05, **p<0.01. Data are represented as mean ± SD. C. Immunohistochemistry showing pH3+ cardiomyocytes (cTnT+) in heart sections collected at 3-days after MI (P1-MI-d3) or sham (P1-Sham-d3) performed at P1. Scale bar, 50um. D. Schematic of the experimental design for snRNA-seq analysis. MI or sham surgery was performed on P1 and P8 hearts. Ventricles below the ligation plane (indicated by dashed lines) were collected at 1- and 3-days post-surgery. E. UMAP visualization of cardiomyocyte clusters colored by identity (n =21,737). F. UMAP visualization of cardiomyocyte clusters colored by timepoint. G. Heatmap of Myh6 expression in each cardiomyocyte cluster projected on UMAP graph. Color scale represents the expression of Myh6. H. Gene signatures of cardiomyocyte CM1-CM5 populations based on expression levels of top markers for each cluster, displaying 200 randomly selected cells per cluster. I. Fraction of cardiomyocyte populations in each snRNA-seq sample.
Figure 2.
Figure 2.. Identification of the hypertrophic response of CM5 cardiomyocytes following injury.
See also Table S1. A. Percentage of CM5 cardiomyocytes in each snRNA-seq sample. B. Immunohistochemistry of heart sections from P8 heart 1-day after MI showing Xirp2+ cardiomyocytes in the border zone. TUNEL co-staining marks the infarct zone. Scale bar, 50um. C. Immunohistochemistry of heart sections from P8 heart 1-day after MI showing colocalization of Xirp2+ and Cd44+ cardiomyocytes. Scale bar, 50um. D. Monocle2 pseudotime analysis of major cardiomyocyte populations in injured P8 hearts depicting an injury response trajectory of CM1 cells towards CM5 cells. Cell identities are projected on the injury trajectory (left); Injury trajectory of non-regenerative CM5 cells (arrow) is shown in pseudotime (right). E. Palantir pseudotime analysis also revealed an injury response trajectory (arrow) of CM1 cells to CM5 cells. F. Activation of Xirp2 and Cd44 expression along the injury response trajectory (arrow) of CM5 cells. G. Heatmap showing the expression of differentially regulated genes along the CM1-to-CM5 injury trajectory at 1-day post-MI in P8 hearts (left). Top GO terms for genes down-regulated (DOWN) and up-regulated (UP) after injury in CM5 cells compared to CM1 cells are shown (right). H. Volcano plot showing fold changes and p-values of genes up-regulated (CM5-MI-d3) and down-regulated (CM5-MI-d1) in CM5 cells at 3-days post-MI compared to 1-day post-MI (left) and top enriched GO terms (right). I. Immunostaining of heart sections from the P8 injured heart 7 days after MI showing the hypertrophic phenotype in Xirp2+ CM5 cardiomyocytes in the border zone. WGA counter staining was used to show cell borders. Scale bar, 50um. J. Quantification of transverse area of Xirp2 and Xirp2+ cardiomyocytes in P8 hearts 7 days post injury, showing hypertrophy of Xirp2+ CM5 cells. Four different hearts were analyzed. *** p< 0.001.
Figure 3.
Figure 3.. An immature cardiomyocyte population (CM4) is enriched in the regenerative heart and becomes proliferative after injury.
See also Figure S3 and Figure S4. A. Schematic showing decreasing capacity of heart regeneration during postnatal life. Heart samples at timepoints P2, P4, P9 and P11 were collected for sham samples. B. Percentage change of each cardiomyocyte population (CM1-CM5) in P2, P4, P9 and P11 hearts. *** p < 0.001, Chi square test. C. Violin plots showing the expression of embryonic genes, Tnni1, Myh7, and Actc1, in CM1-CM5 cells. D. Violin plots showing the expression of mature cardiomyocyte genes, Myh6, Ryr2, and Cacna1c in CM1-CM5 cells. E. Heatmap showing expression of embryonic genes that are highly expressed in E15 hearts compared to P1 hearts in CM1-CM5 populations. Z-scores of RPKM values are plotted for the expression in E15 and P1 hearts (left). Z-scores of the averaged expression of imputation corrected values from cluster CM1-CM5 are plotted (right). Representative genes related to cell-cycle regulation, extracellular matrix organization, and fetal contractile gene isoforms are labeled. Top GO terms enriched for these genes are shown (bottom left). F. Percentage of cardiomyocytes mapped to the G2/M phase in CM1-CM5 populations from P1 heart at 3-days post MI or Sham. n.s, not significant; *** p< 0.001, Chi square test. G and H. Flow cytometry graphs showing cardiac nuclei labeled with Hoechst alone to analyze DNA content (G), or Hoechst plus PCM-1 antibody to identify 2n and 4n cardiomyocytes (H). Note that the different fluorescent intensity of Hoechst staining indicates 2n and 4n DNA content, which correspond to G0/G1 and G2/M cell-cycle phases, respectively. PCM1+ 2n and 4n cardiomyocyte nuclei were collected and separately analyzed with snRNA-seq. 2n: diploid; 4n: tetraploid; CM: cardiomyocytes. I. The percentage of CM4 population in 2n and 4n cardiomyocyte nuclei. *** p< 0.001, Chi square test.
Figure 4.
Figure 4.. Regenerative response of CM4 cardiomyocytes following injury.
See also Figure S4, Figure S5, Table S2, and Table S3. A. Reclustering of CM4 cardiomyocytes reveals transcriptome differences between injured (P1-MI-d1 and P1-MI-d3) and control (P1-Sham-d1) samples, visualized in UMAP. B. Hierarchical clustering of differentially expressed genes (p< 0.0001, Wilcoxon rank-sum test) in CM4 cells across timepoints identified 3 groups of genes that showed different dynamic regulation in response to injury. Left, heatmap of gene expression in z-scores; middle, z-scores of the average expression of genes in each group, with shade representing standard error; right, top GO terms enriched for genes in each group. C. Expression of transcription factors that highly correlate (Spearman’s rank correlation coefficient >0.85) with Mki67 and Ccnb1 expression in CM4 cells. Cells are ordered (from left to right) by their expression level of Mki67 from low to high. The corresponding sample point of each cell is color-coded and shown on the top. Representative genes with known roles in cardiomyocyte proliferation are indicated. The predicted upstream regulators of the CM4 injury response are labeled in bold. D. UMAP visualization of co-embedded scATAC-seq and snRNA-seq datasets obtained in P1 hearts at 3-days after MI. Cardiomyocytes are colored by experimental technique (left). Cardiomyocytes are colored by the cell type identified after the cell-label transfer in Seurat (right). EC, endothelial cells; EndoEC, endocardial cells; EPI, epicardial cells; FB, fibroblasts. E. Aggregate read counts of scATAC-seq in CM1 and CM4 cells within 2kb range of the CM4-active open chromatin regions. F. TF motifs enriched at CM4-active open chromatin regions. G. Relative expression of Srf, Nfe2l, Nfe2l2, Nfya, Nfyb, and Nfic in each cardiomyocyte cluster. H. Relative expression of Srf, Nfe2l1, Nfe2l2, Nfya, Nfyb, and Nfic in CM4 cells from the sham heart 1-day after surgery (P1-Sham-d1) and hearts at 1-day (P1 -MI-d1 ) and 3-days (P1-MI-d3) after injury. I. Quantification showing fold-change of the proportion of EdU+ cardiomyocytes in NRVMs overexpressing NFE2L1, NFE2L2, NFIc, NFYa, NFYb, or SRF compared with YFP control (n=3 for each group). * p< 0.05, ** p< 0.01. Data are represented as mean ± SD. J. EdU (violet) and cTnT (green) immunostaining of NRVMs overexpressing YFP (negative control), SRF, or NFYA followed by EdU incorporation for 24h. Scale bar, 100um. K. Quantification showing the number of viable NRVMs overexpressing YFP, NFE2L1, NFE2L2, NFIc, NFYa, NFYb, or SRF (n=4 for each group). ** p< 0.01. Data are represented as mean ± SD. L. Viable NRVMs overexpressing YFP, NFE2L1, or NFE2L2 following H2O2 treatment indicated by Calcerin AM (green). Scale bar, 100um
Figure 5.
Figure 5.. Combined overexpression of NFYa and NFE2L1 promotes cardiomyocyte proliferation and survival.
See also Figure S5. A. Quantification showing the fold change of the proportion of EdU+ NRVMs overexpressing single factors or combinations of NFYa, NFE2L1, and SRF compared with control YFP (n=5 for each group). ** p< 0.001; n.s, not significant. Data are represented as mean ± SD. B. Immunofluorescent staining of cTnT (green) and pH3 (white) in NRVMs overexpressing YFP or NFYa plus NFE2L1 (left). Quantification of the percentage of pH3+ and cTnT+ cells (right). ** p< 0.01, *** p< 0.001. Scale bar, 100um. Data are represented as mean ± SD. C. Quantification showing the number of viable NRVMs overexpressing single factors or combinations of NFYa, NFE2L1, and SRF compared with control YFP (n=5 for each group). ** p< 0.01; n.s, not significant. Data are represented as mean ± SD. D. Viable NRVMs overexpressing YFP with and without H2O2 treatment, or NFYa plus NFE2L1 after H2O2 treatment, indicated by Calcerin AM (green). Scale bar, 100um E. Immunostaining showing TUNEL+ (purple) and cTnT+ (green) NRVMs overexpressing YFP or NFYa plus NFE2L1 after H2O2 treatment. Scale bar, 100um F. Heatmap showing expression of selected genes related to injury-activated pathways in CM4 cells. Z-scores of averaged normalized expression values of each gene in CM1 and CM4 at 3-days post Sham and MI (left). Z-scores of RPKM of each gene in three replicates of NRVMs expressing GFP, NFYa, or NFE2L1 (right).
Figure 6.
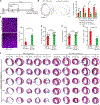
Figure 6.. Combined overexpression of NFYa and NFE2L1 confers cardio-protection.
See also Figure S6. A. Schematic showing experimental design for AAV9 injection and timepoints of sample collections. B. Comparison of TUNEL positive area in hearts of mice that received AAV9-TdTomato or AAV9-NFYa+NFE2L1. Samples were collected at 6h post-MI. Left, TUNEL staining of heart sections collected at 400um below the ligation suture. Right, quantification of TUNEL relative signal intensity normalized by heart section size at 0um, 200um, 400um, and 600um below the suture (n=3 for each group). * p< 0.05, ** p< 0.01, n.s not significant. Data are represented as mean ± SD. Scale bar, 100um. C. Immunostaining of cTnT (purple) and pH3 (white) on transverse sections from hearts of mice treated with AAV9-TdTomato or AAV9-NFYa+NFE2L1 at P11 (left). Fold change of the percentage of pH3+ and cTnT+ cells in AAV9-NFYa+NFE2L1 treated hearts compared with AAV9-TdTomato hearts (n=4 for each group). * p< 0.05. Data are represented as mean ± SD. Scale bar, 50um. D and E. Fractional shortening (D) and ejection fraction (E) measurements of mice injected with AAV9-TdTomato and AAV9-NFYa+NFE2L1 at P4 and analyzed at 3wks after MI at P8 (n=16 for AAV9-TdTomato, n=17 for AAV9- NFYa+NFE2L1). ** p< 0.01. Data are represented as mean ± SD. F. Masson’s trichrome staining of transverse sections of hearts of mice injected with AAV9-TdTomato or AAV9-NFYa+NFE2L1. Samples were collected at 3wks after P8 MI. Images of heart sections at 0um, 200um, 400um, 600um, and 800um below the ligation point are depicted. Five representative hearts are shown for each group, and their fractional shortening (FS) measurements are noted. Scale bar, 500um. G. Quantification of fibrotic regions of heart sections in F (n=3 for each group). * p< 0.05. Data are represented as mean ± SD.

References

    1. Aguirre A, Montserrat N, Zacchigna S, Nivet E, Hishida T, Krause MN, Kurian L, Ocampo A, Vazquez-Ferrer E, Rodriguez-Esteban C et al. (2014). In vivo activation of a conserved microRNA program induces mammalian heart regeneration. Cell stem cell 15, 589–604. - PMC - PubMed
    1. Alkass K, Panula J, Westman M, Wu TD, Guerquin-Kern JL, and Bergmann O (2015). No Evidence for Cardiomyocyte Number Expansion in Preadolescent Mice. Cell 163, 1026–1036. - PubMed
    1. Ames EG, Lawson MJ, Mackey AJ, and Holmes JW (2013). Sequencing of mRNA identifies re-expression of fetal splice variants in cardiac hypertrophy. J Mol Cell Cardiol 62, 99–107. - PMC - PubMed
    1. Amoasii L, Long C, Li H, Mireault AA, Shelton JM, Sanchez-Ortiz E, McAnally JR, Bhattacharyya S, Schmidt F, Grimm D, et al. (2017). Single-cut genome editing restores dystrophin expression in a new mouse model of muscular dystrophy. Science translational medicine 9. - PMC - PubMed
    1. Bartelt A, Widenmaier SB, Schlein C, Johann K, Goncalves RLS, Eguchi K, Fischer AW, Parlakgul G, Snyder NA, Nguyen TB, et al. (2018). Brown adipose tissue thermogenic adaptation requires Nrf1-mediated proteasomal activity. Nature medicine 24, 292–303. - PMC - PubMed

Publication types

MeSH terms

Substances