. 2020 Apr 7;31(4):822-836.e5.
doi: 10.1016/j.cmet.2020.03.002. Epub 2020 Mar 26.

Beta Cell Dedifferentiation Induced by IRE1α Deletion Prevents Type 1 Diabetes

Affiliations

Beta Cell Dedifferentiation Induced by IRE1α Deletion Prevents Type 1 Diabetes

Hugo Lee et al. Cell Metab. .

Abstract

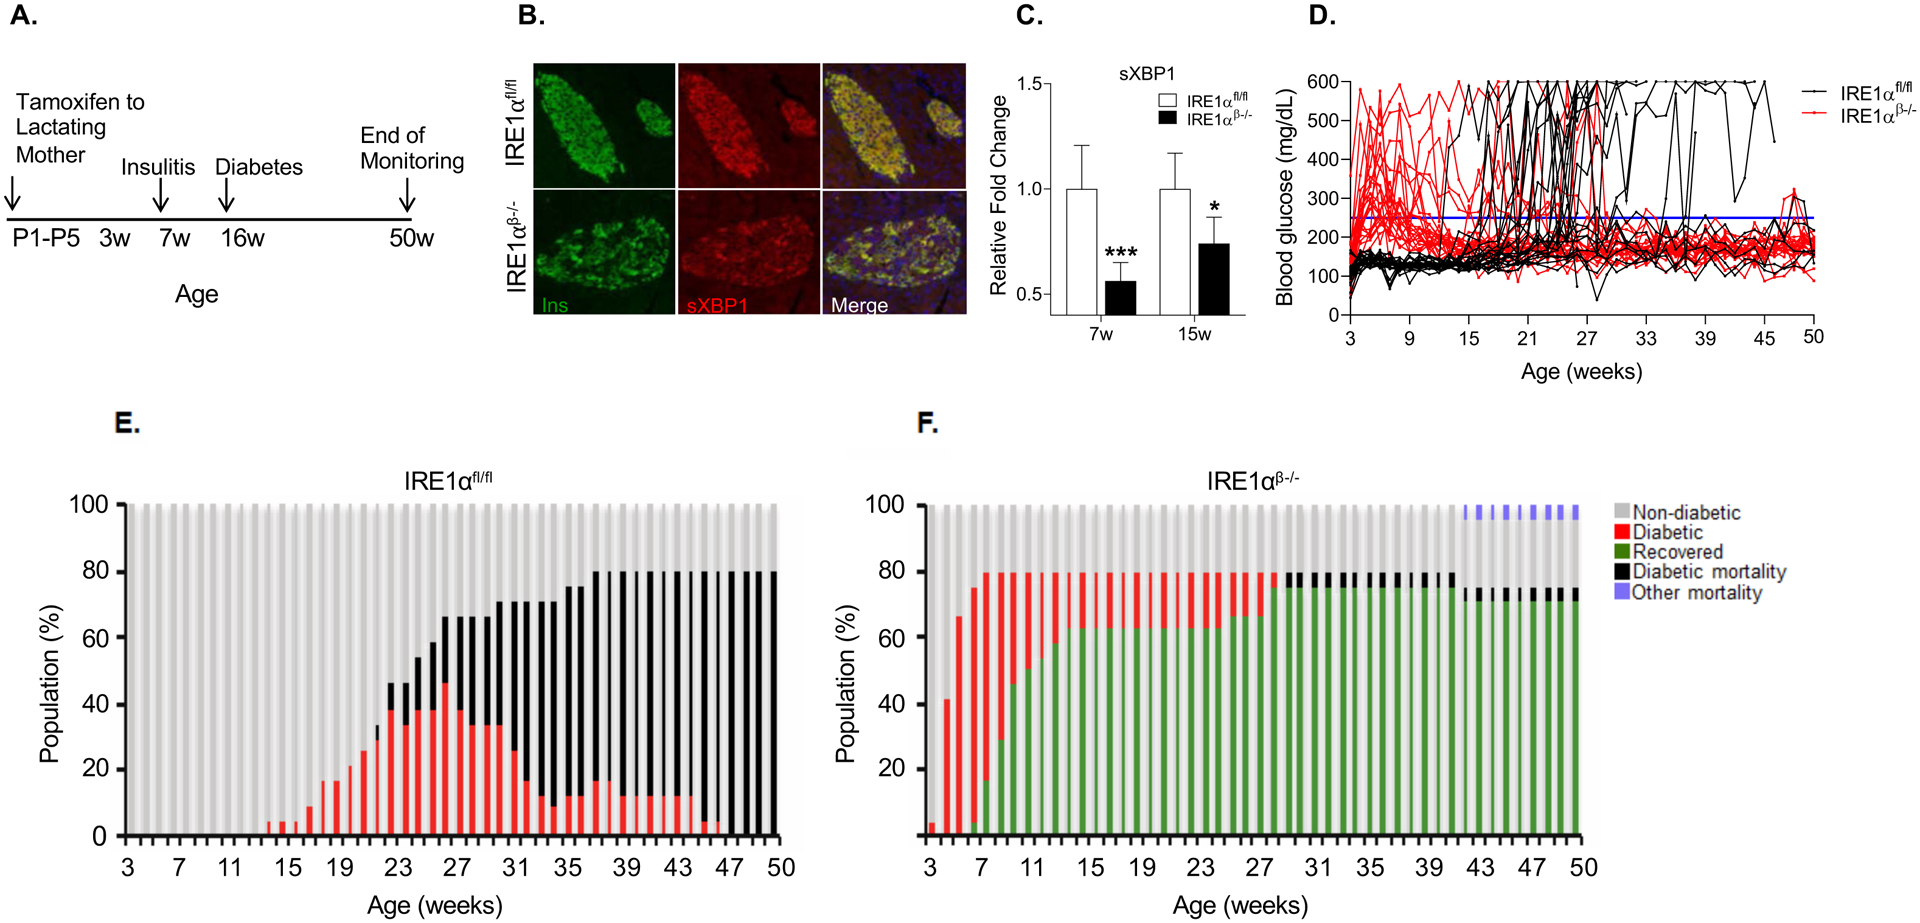
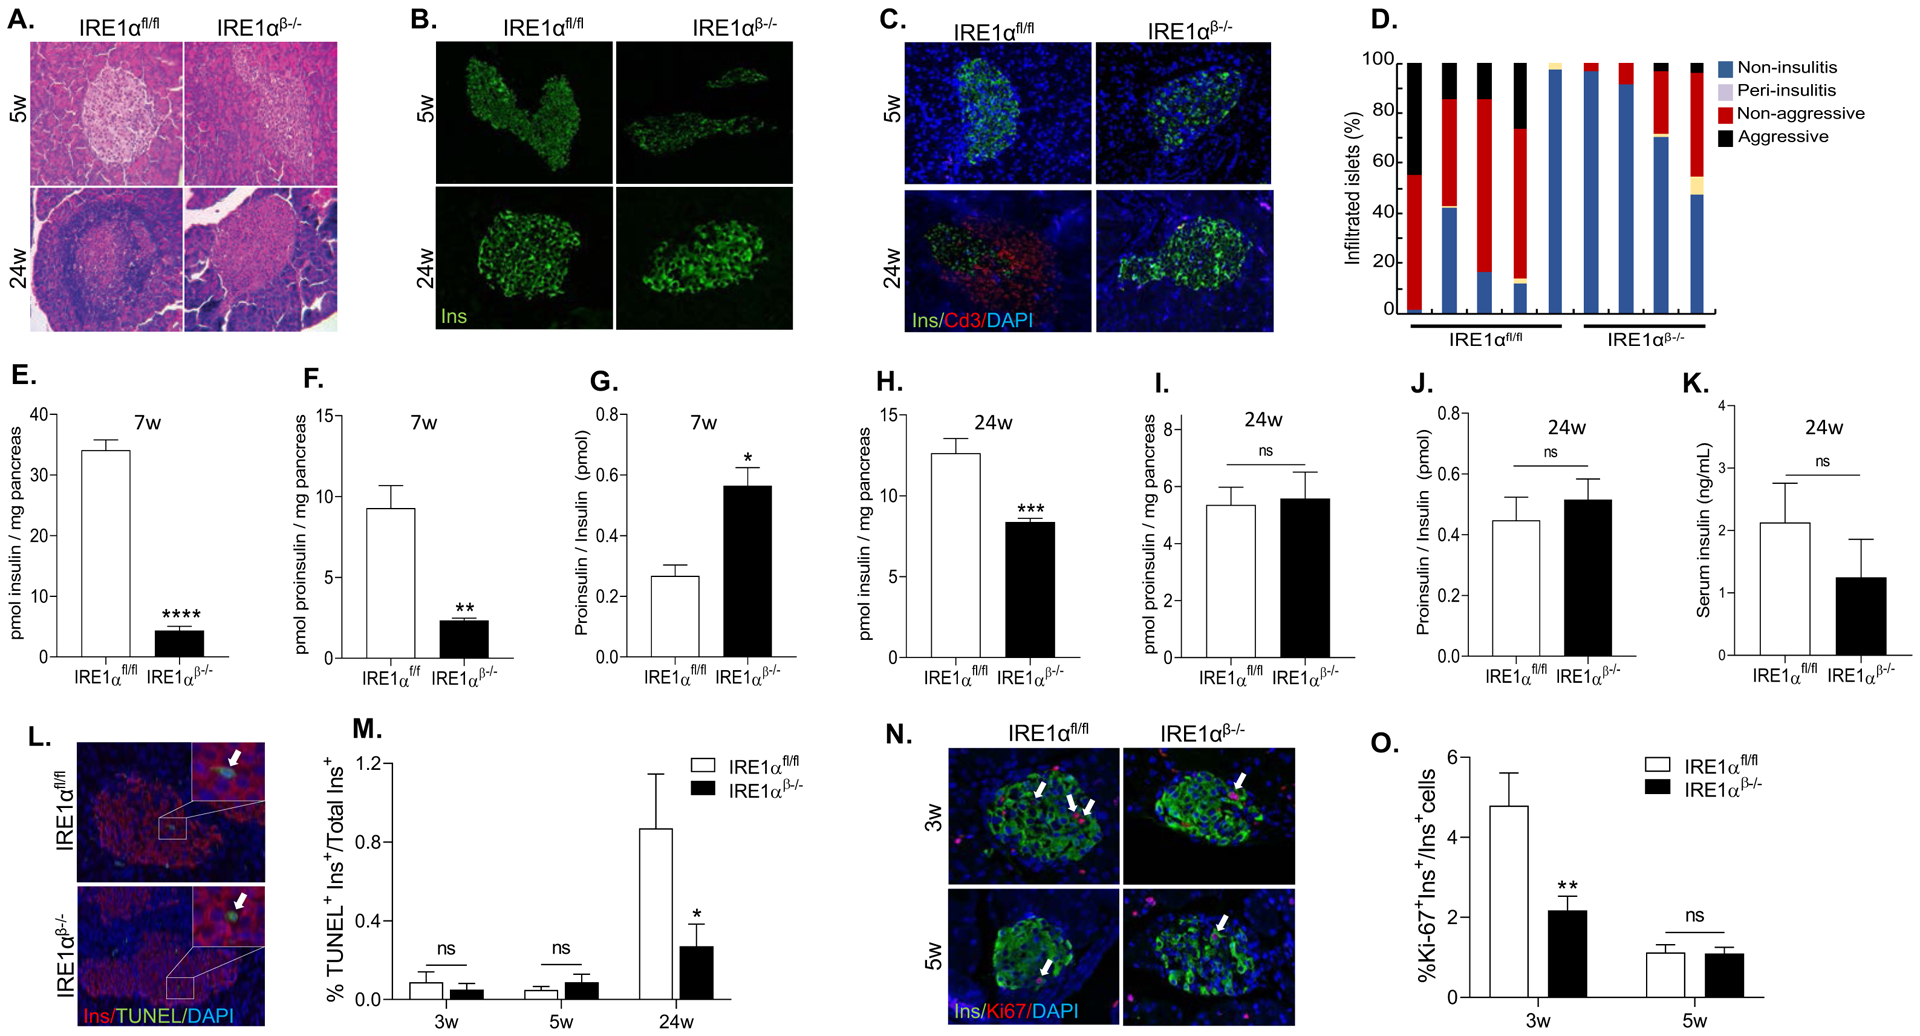
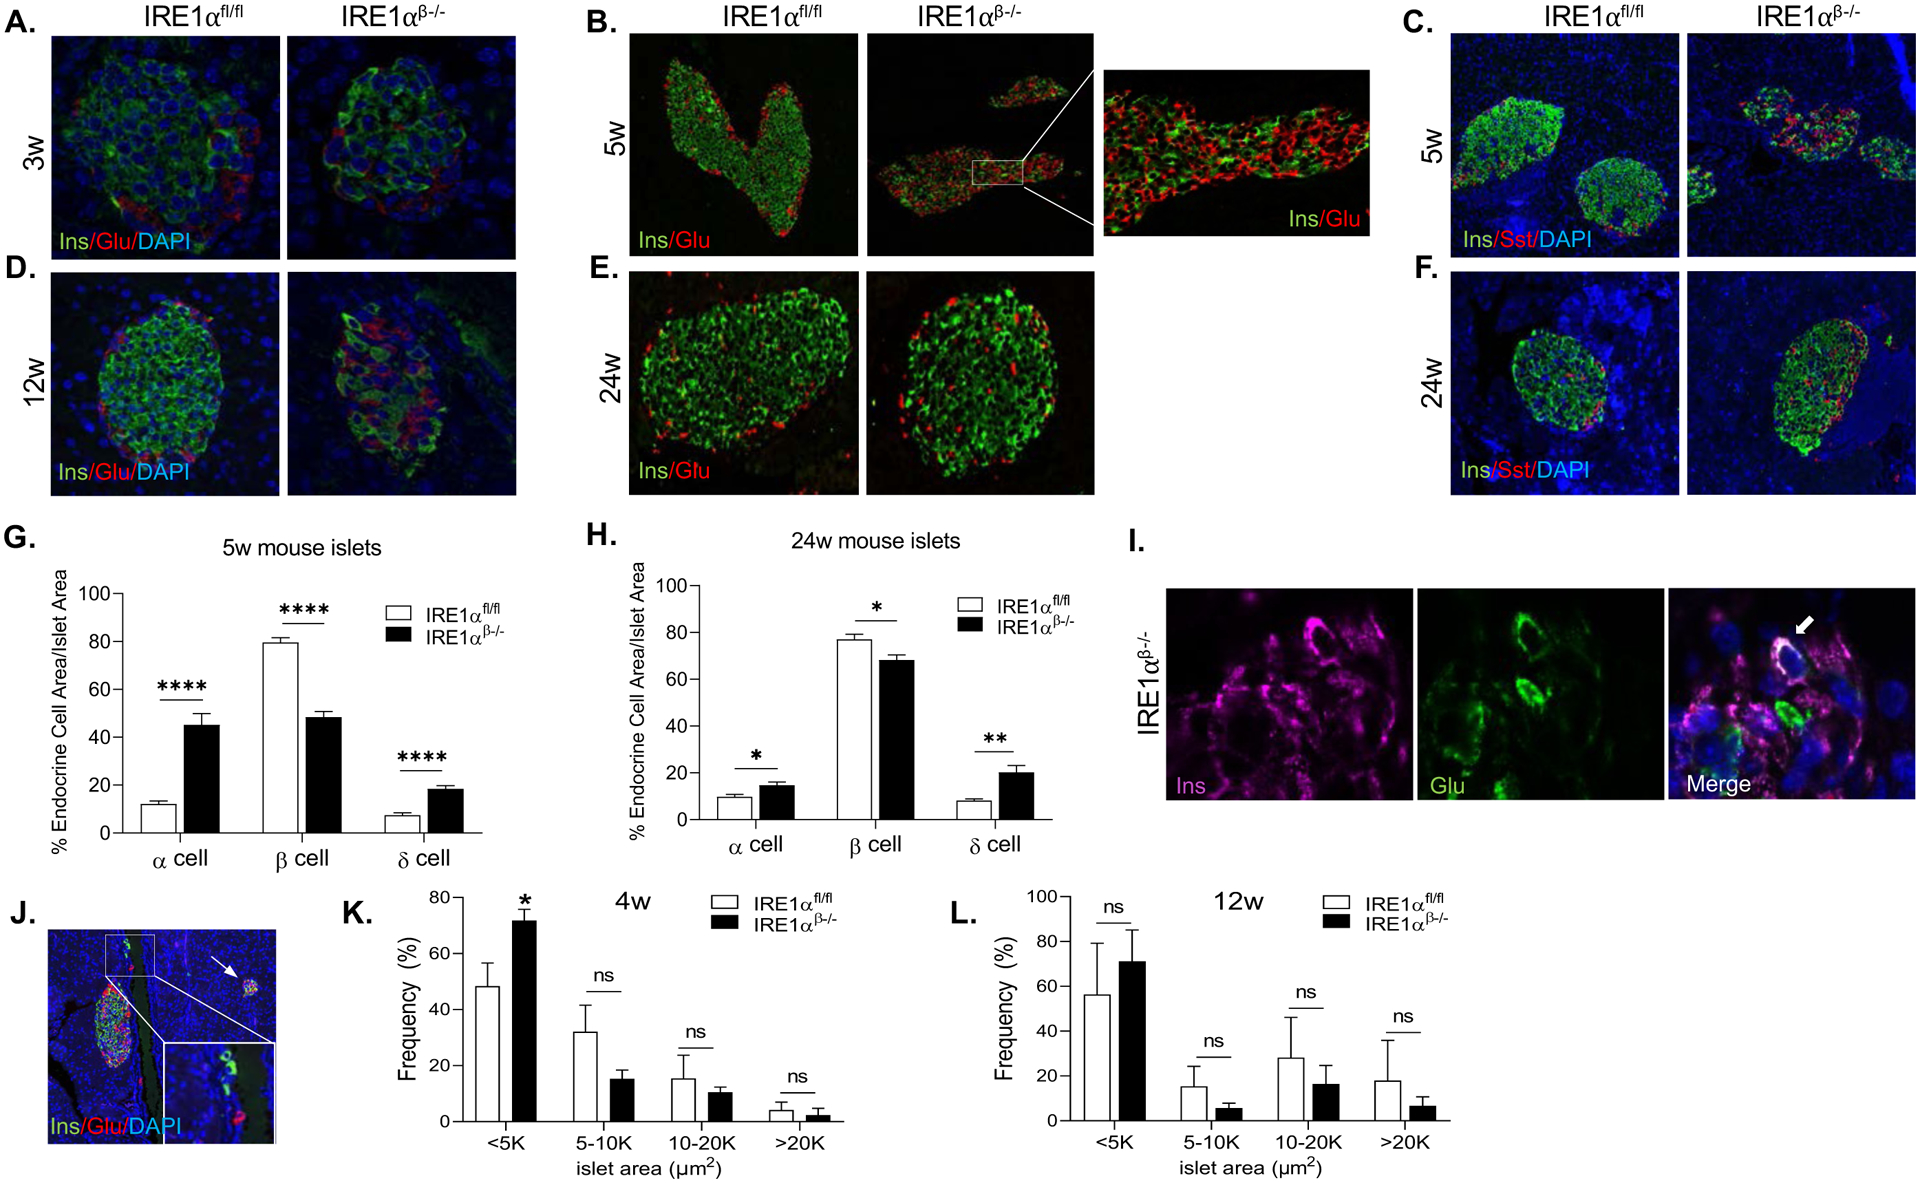
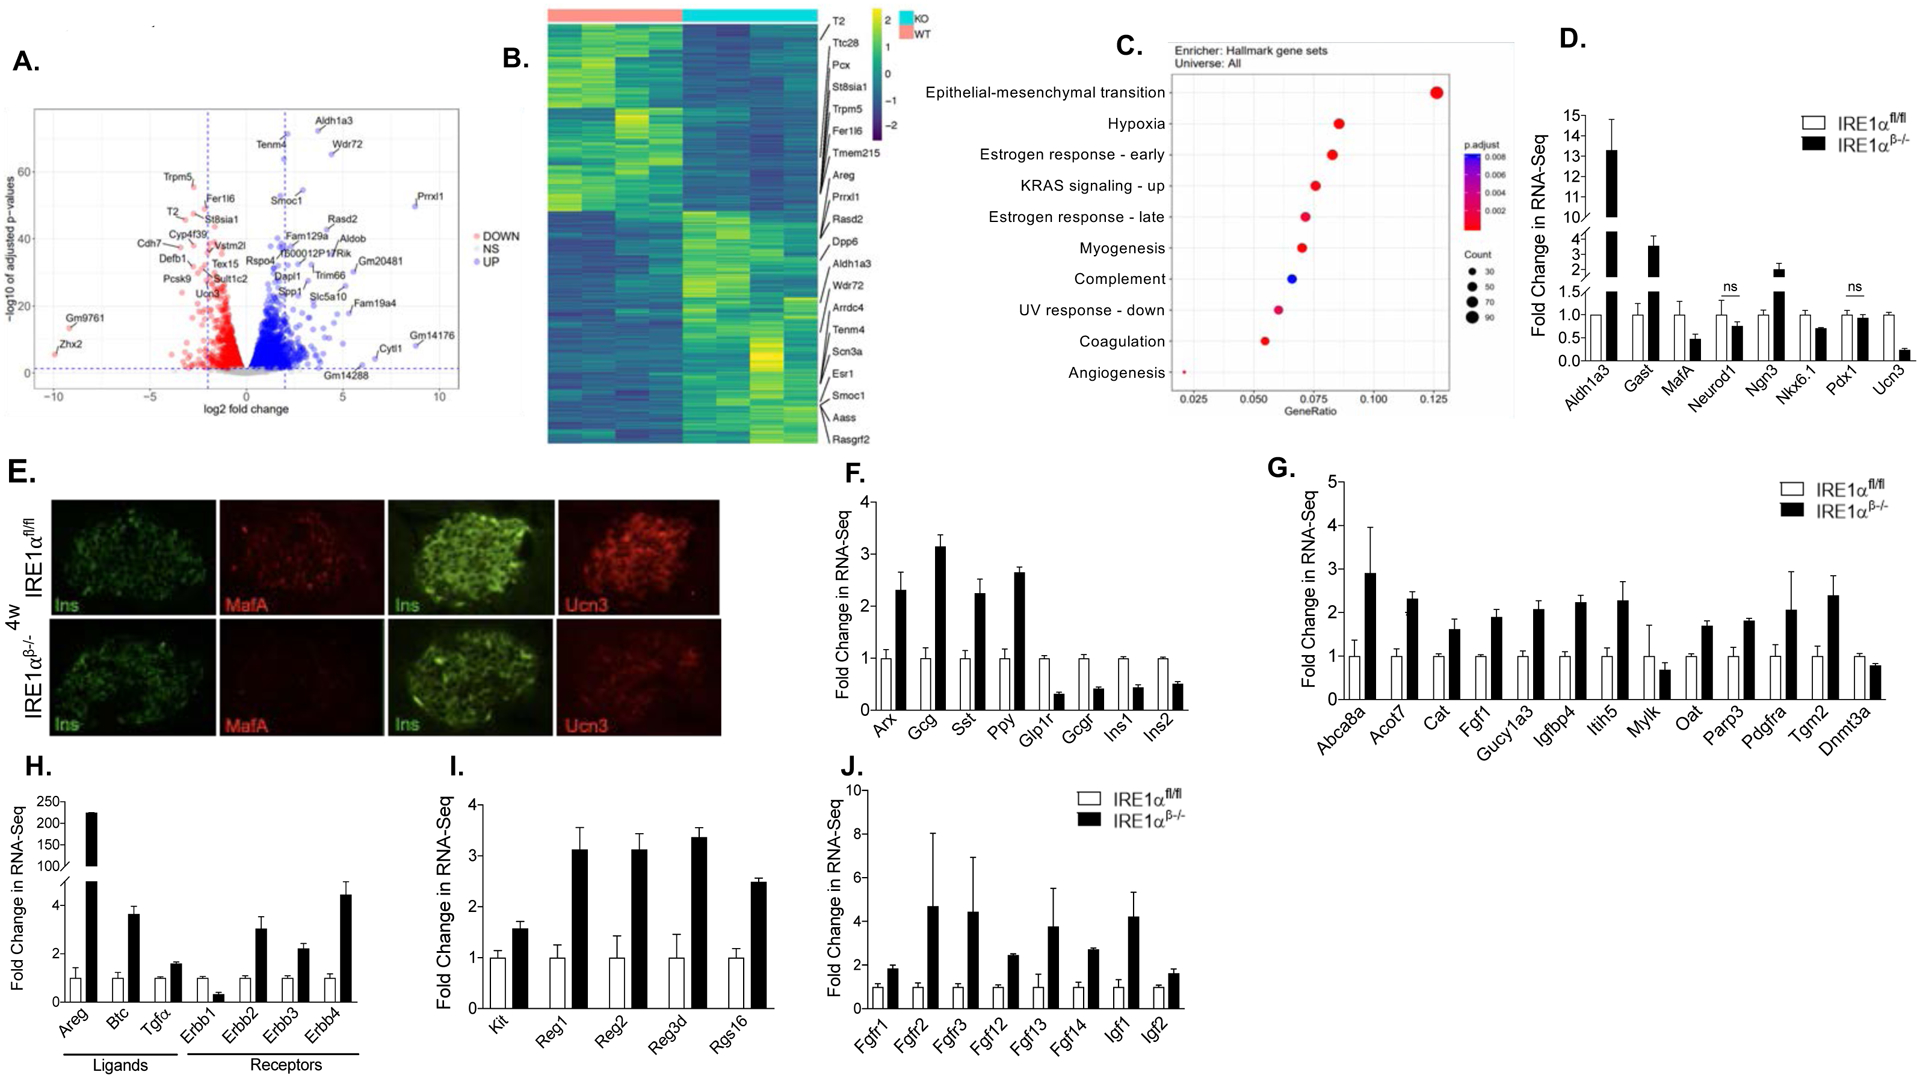
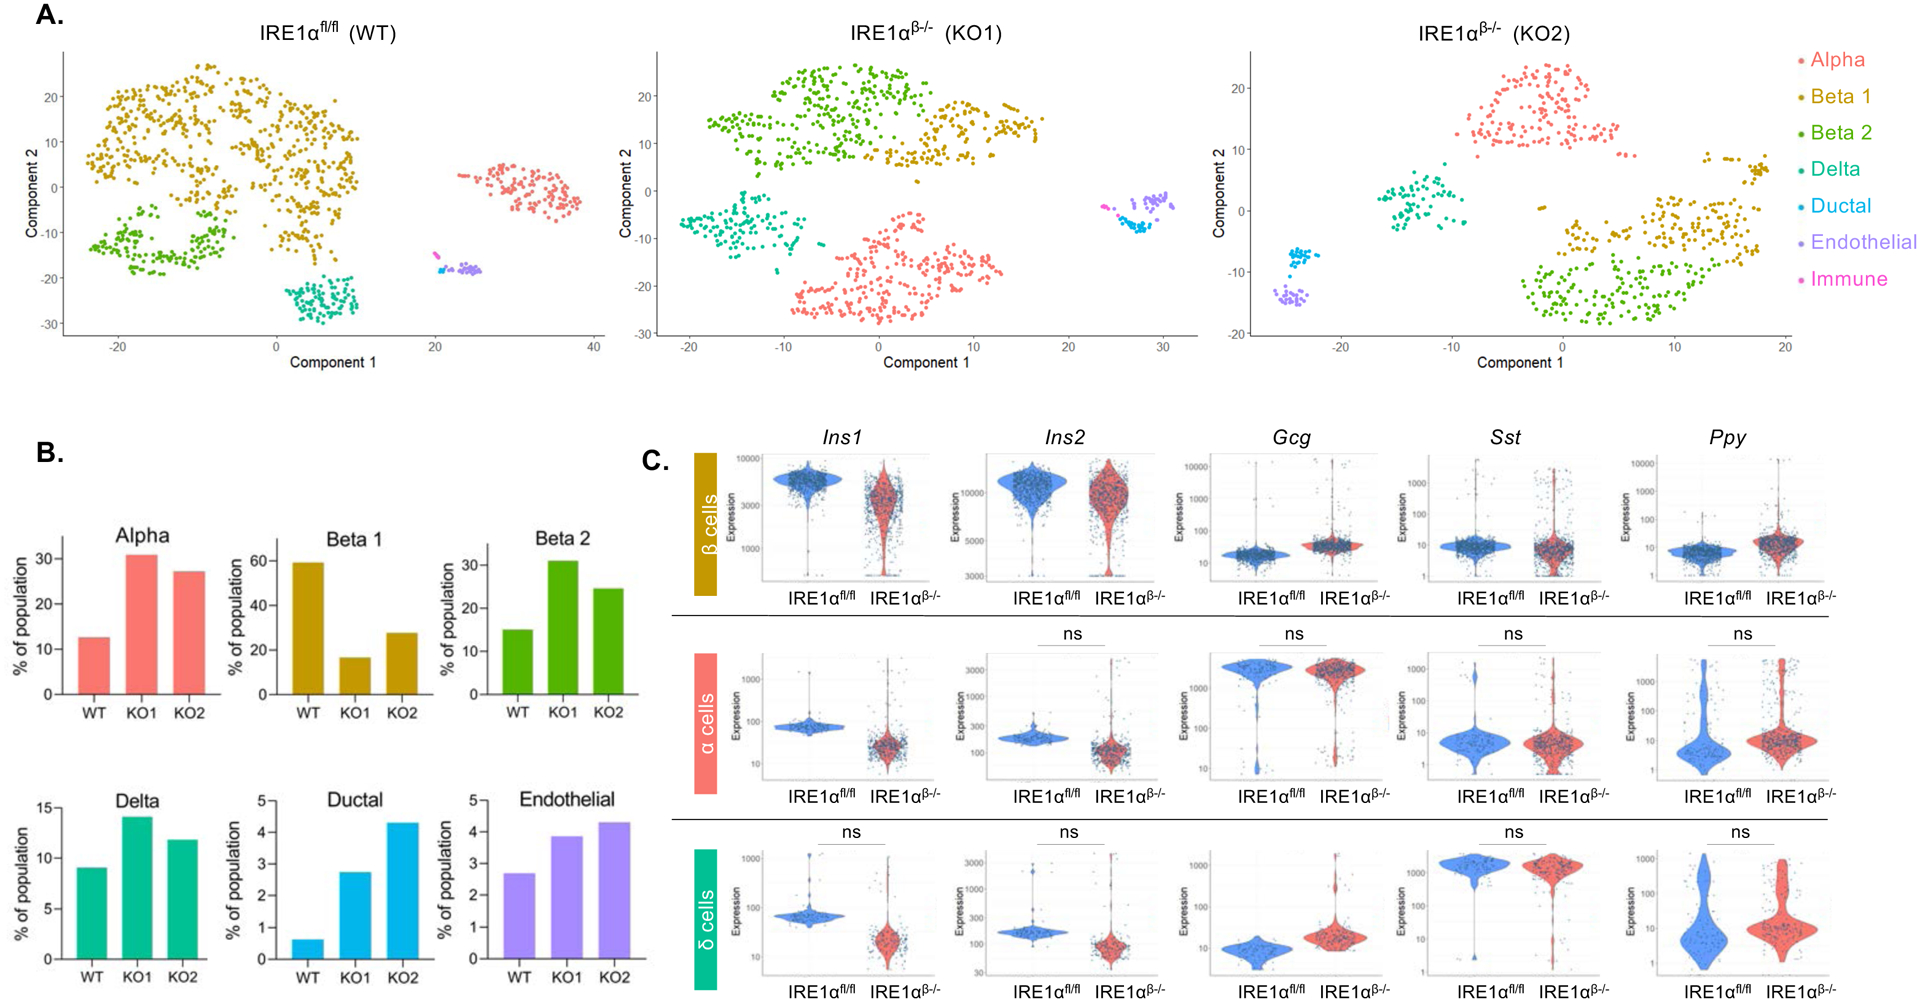
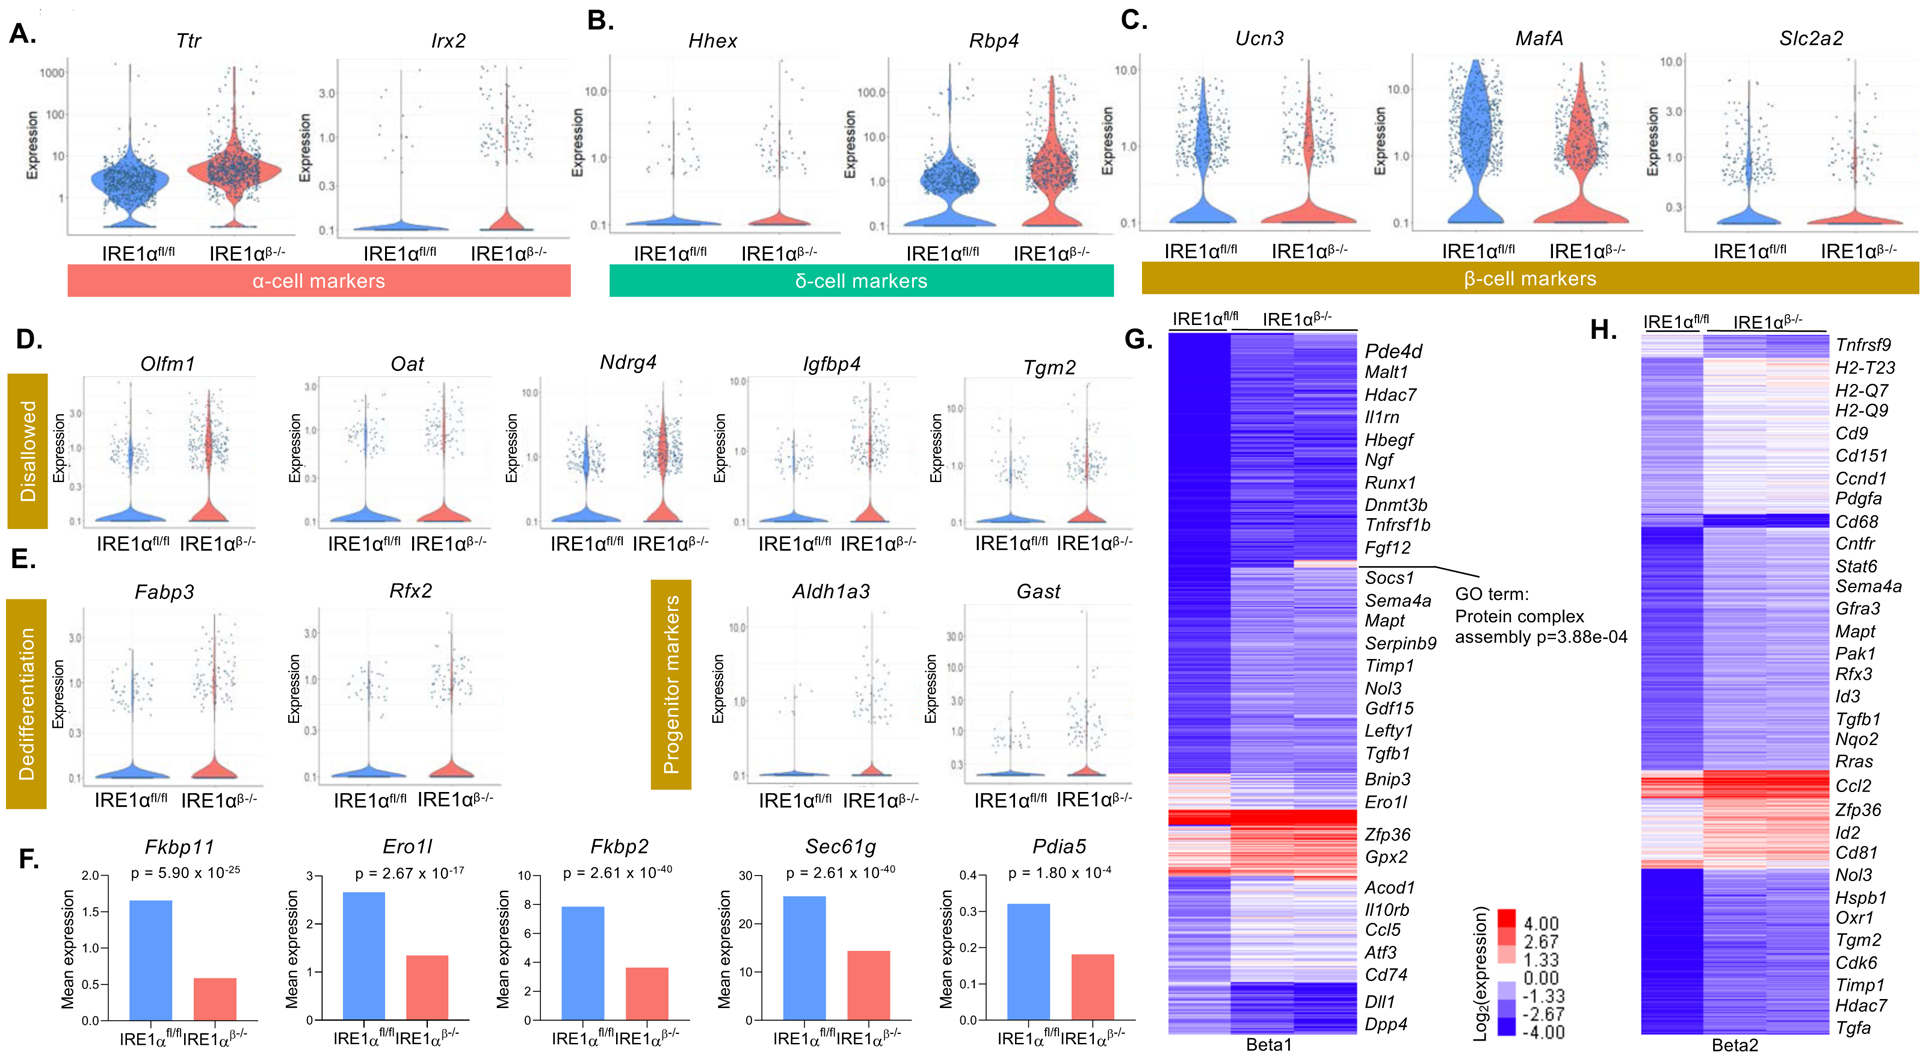
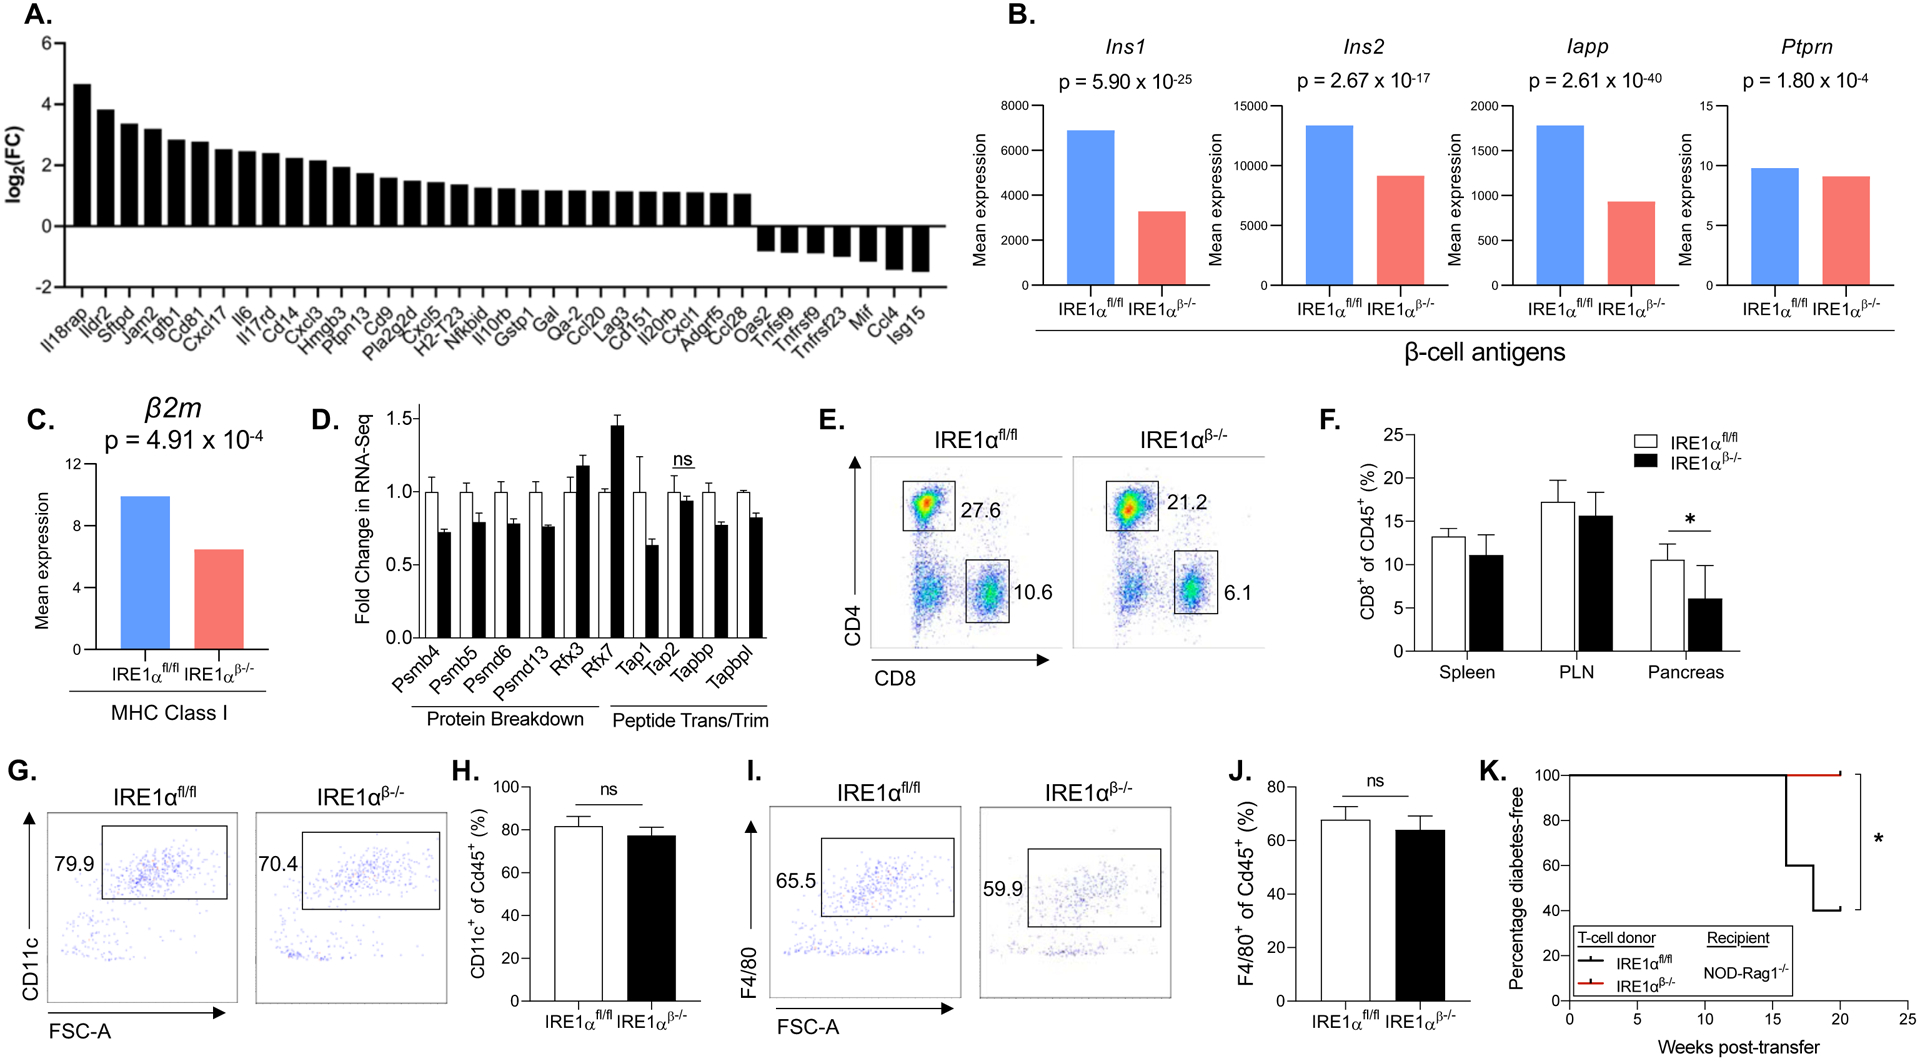
Immune-mediated destruction of insulin-producing β cells causes type 1 diabetes (T1D). However, how β cells participate in their own destruction during the disease process is poorly understood. Here, we report that modulating the unfolded protein response (UPR) in β cells of non-obese diabetic (NOD) mice by deleting the UPR sensor IRE1α prior to insulitis induced a transient dedifferentiation of β cells, resulting in substantially reduced islet immune cell infiltration and β cell apoptosis. Single-cell and whole-islet transcriptomics analyses of immature β cells revealed remarkably diminished expression of β cell autoantigens and MHC class I components, and upregulation of immune inhibitory markers. IRE1α-deficient mice exhibited significantly fewer cytotoxic CD8+ T cells in their pancreata, and adoptive transfer of their total T cells did not induce diabetes in Rag1-/- mice. Our results indicate that inducing β cell dedifferentiation, prior to insulitis, allows these cells to escape immune-mediated destruction and may be used as a novel preventive strategy for T1D in high-risk individuals.

Keywords: ER stress; IRE1; NOD; RNA-seq; UPR; beta cell; dedifferentiation; islet; single cell; type 1 diabetes.


Conflict of interest statement

Declaration of Interests The authors declare no competing interests.

Figures

Figure 1.
Figure 1.. IRE1αβ−/− NOD female mice are protected from T1D.
(A) Schematic representation of tamoxifen-induced deletion of IRE1α in β-cells of NOD mice. (B) Representative immunofluorescence images showing sXBP1 expression on pancreatic sections from 5-week-old mice. (C) Quantification of sXBP1 expression in the islets of 7- and 15-week-old IRE1αfl/fl (7 weeks: n = 6; 15 weeks: n = 5) and IRE1αβ−/− mice (7 weeks: n = 5; 15 weeks: n = 6). Data are averages of two technical replicates from a representative experiment. (D) Blood glucose levels of IRE1αfl/fl and IRE1αβ−/− mice (n = 24 per group). (E and F) Diabetes progression in IRE1αfl/fl and IRE1αβ−/− mice. All data are represented as mean ± SEM, with statistical analysis performed by Student’s t-test (***P < 0.001, *P < 0.05).
Figure 2.
Figure 2.. Improved β-cell function and survival in IRE1αβ−/− NOD mice upon recovery from hyperglycemia.
(A) A representative image of H&E staining showing varying degree of lymphocyte infiltration of islets. (B) Representative immunofluorescence images showing insulin expression. (C) Representative immunofluorescence images showing insulin and CD3 expression. (D) Insulitis scoring of 24 weeks of age IRE1αfl/fl (n = 5) and IRE1αβ−/− (n = 4) mice. (E and F) Insulin and proinsulin content of 7-week-old mice (n = 4 per group). (G) Proinsulin-to-insulin molar ratio was calculated. Data are averages of two technical replicates from a representative experiment. (H and I) Insulin (n = 6 per group) and proinsulin content of 24-week-old IRE1αfl/fl (n = 5) and IRE1αβ−/− (n = 7) mice. (J) Proinsulin-to-insulin molar ratio was calculated. Data are averages of two technical replicates from a representative experiment. (K) Serum insulin levels of 24-week-old IRE1αfl/fl and IRE1αβ−/− mice (n = 6 per group). (L) Representative images of TUNEL assay showing β-cell apoptosis. The arrows point to TUNEL+ cells. (M) Percentage of TUNEL+ β-cells (IRE1αfl/fl: 3, 5, and 24 weeks: n = 6, 6, and 5, respectively; IRE1αβ−/−: 3, 5, and 24 weeks: n = 6, 6, and 8, respectively). (N) Representative fluorescence images showing insulin and Ki67 expression. The arrows point to Ki67+ cells. (O) Percentage of Ki67+ β-cells (IRE1αfl/fl : 3 and 5 weeks: n = 6, and n = 7, respectively; IRE1αβ−/−: 3 and 5 weeks: n = 8 and n = 7, respectively). All data are represented as mean ± SEM, with statistical analysis performed by Student’s t-test (****P < 0.0001, **P < 0.01, *P < 0.05). w: weeks. ns: non-significant.
Figure 3.
Figure 3.. Islet cell composition is altered in IRE1αβ−/− mice during the hyperglycemic phase.
(A and B) Representative immunofluorescence images for insulin and glucagon expression at indicated time points. (C) Representative immunofluorescence images for insulin and somatostatin expression at 5 weeks of age. (D and E) Representative immunofluorescence images for insulin and glucagon expression at indicated time points. (F) Representative immunofluorescence images showing insulin and somatostatin expression at 24 weeks of age. (G and H) Quantification of α, β, and δ-cells as a percentage of total islet area at 5 and 24 weeks of age (15–25 islets/animal/time point). (I) Representative image of an insulin+ and glucagon+ bihormonal cell in an islet of IRE1αβ−/− mice. Arrow indicates the bihormonal cell. (J) Representative image of a pancreatic section from 5-week-old IRE1αβ−/− mice showing the presence of single β-cells and small islet clusters. The arrow points to a small islet cluster. (K and L) The quantification of islet area of 4 weeks and 12 weeks of age IRE1αfl/fl (n = 3 per time point) and IRE1αβ−/− (4 weeks: n = 3; 12 weeks: n = 4) mice. All data are represented as mean ± SEM, with statistical analysis performed by Student’s t test (****P < 0.0001, **P < 0.01, *P < 0.05). w: weeks.
Figure 4.
Figure 4.. Bulk RNA-seq on intact islets from hyperglycemic mice indicates changes in the expression of cell survival and differentiation markers.
(A) Volcano plots indicating differentially expressed genes. Horizontal line depicts the FDR cutoff of 0.05 and the vertical lines mark log2 fold changes of −2 and 2. Genes with absolute log2 fold change larger than 5 or adjusted p value smaller than 1e-25 and absolute log2 fold change larger than 2 are labeled with their gene symbols. (B) Heatmap of expression levels for the differentially expressed genes (FDR < 0.01, FC > 2). (C) Gene set enrichment analysis with the Molecular Signatures Database (MSigDB) Hallmark gene sets (FDR < 0.05). (D) The mRNA expression of β-cell identity and endocrine progenitor markers (FDR < 0.05). (E) Immunofluorescence staining showing the expression of β-cell maturity markers MafA, and Ucn3. (F-J) The mRNA expression of islet cell markers, disallowed genes, ErbB family of genes, regeneration-related genes, and growth factor gene transcripts (FDR < 0.05). ns: non-significant, w: weeks. FC: Fold change.
Figure 5.
Figure 5.. Single-cell RNA-seq identifies altered proportion of islet cell clusters, hormonal expression, and non-β-cell islet markers in IRE1αβ−/− mice.
(A) Distinct pancreatic islet cell clusters in IRE1αfl/fl and IRE1αβ−/− mice. Each dot represents a single cell, color-coded according to its cellular identity as defined by gene expression. (B) Percent of population composed of cell sub-types identified in (A) in dissociated islets obtained from 5-week-old IRE1αfl/fl (WT) and IRE1αβ−/− (knockout 1 (KO1) and knockout2 (KO2)) mice. (C) Expression of islet hormones in β-cells (upper panel), α-cells (middle panel), and δ-cells (bottom panel) of IRE1αfl/fl and IRE1αβ−/− mice (FDR < 0.01). ns: non-significant.
Figure 6.
Figure 6.. β-cells of IRE1αβ−/− mice dedifferentiate.
(A-C) Expression of α-cell markers, δ-cell markers, and β-cell maturity markers in β-cell clusters of IRE1αfl/fl and IRE1αβ−/− mice at 5 weeks of age (FDR < 0.01). (D and E) Expression of disallowed genes, dedifferentiation, and endocrine progenitor markers in β-cell clusters of IRE1αfl/fl and IRE1αβ−/− mice (FDR < 0.01). (F) Mean expression of sXBP1 target genes in β-cell clusters of IRE1αfl/fl and IRE1αβ−/− mice. (G and H) k-means clustering (7 clusters) of differentially expressed genes (FDR < 0.01, FC > 2) among the beta1 and beta2 populations (columns). Selected genes that define each cluster are displayed. Color bar represents expression changes in log2 scale. FC: Fold change.
Figure 7.
Figure 7.. -cells of IRE1αβ−/− mice have altered expression of genes associated with immune cell recruitment.
β (A) The expression of genes that is key in regulation of lymphocyte activation, as well as markers of cytokine, chemokine, and ECM (FDR < 0.01). (B) The mRNA expression of β-cell autoantigens in β-cells. (C and D) The mRNA expression of MHC class I component β2m and genes that are involved in the MHC class I loading (FDR < 0.05). (E) Fractions of CD4+ and CD8+ T-cells in representative dot plots from pancreata of 21 weeks of age IRE1αfl/fl and IRE1αβ−/− mice after pre-gating for single, viable, and CD45+ cells. (F) Immunophenotyping data showing percentage of CD8+ T-cells in spleen, pancreatic lymph node (PLN), and pancreas from 21 weeks of age IRE1αfl/fl (n = 6) and IRE1αβ−/− (n = 4) mice. (G) Fractions of CD11c+ dendritic cells in representative dot plots from pancreata of 5 weeks of age IRE1αfl/fl and IRE1αβ−/− mice after pre-gating for single, viable, and CD45+ cells. (H) Quantification of percentage of CD11c+ dendritic cells in pancreata from 5 weeks of age IRE1αfl/fl (n = 6) and IRE1αβ−/− (n = 7) mice. (I) Fractions of F4/80+ macrophages in representative dot plots from pancreata of 5 weeks of age IRE1αfl/fl and IRE1αβ−/− mice after pre-gating for single, viable, and CD45+ cells. (J) Quantification of percentage of F4/80+ macrophages in pancreata from 5 weeks of age IRE1αfl/fl (n = 6) and IRE1αβ−/− (n = 7) mice. (K) Percentage of diabetes-free NOD-Rag1−/− mice (n = 5 per group) post-total T-cell transfer from 8-week-old IRE1αfl/fl and IRE1αβ−/− mice. The incidence of diabetes was compared by log-rank (Mantel-Cox) test (*P < 0.05).

Comment in

References

    1. Artner I, Hang Y, Mazur M, Yamamoto T, Guo M, Lindner J, Magnuson MA, and Stein R (2010). MafA and MafB regulate genes critical to beta-cells in a unique temporal manner. Diabetes 59, 2530–2539. - PMC - PubMed
    1. Arvan P, Pietropaolo M, Ostrov D, and Rhodes CJ (2012). Islet autoantigens: structure, function, localization, and regulation. Cold Spring Harb Perspect Med 2. - PMC - PubMed
    1. Atkinson MA (2012). The pathogenesis and natural history of type 1 diabetes. Cold Spring Harb Perspect Med 2. - PMC - PubMed
    1. Bernales S, Papa FR, and Walter P (2006). Intracellular signaling by the unfolded protein response. Annu Rev Cell Dev Biol 22, 487–508. - PubMed
    1. Bersell K, Arab S, Haring B, and Kuhn B (2009). Neuregulin1/ErbB4 signaling induces cardiomyocyte proliferation and repair of heart injury. Cell 138, 257–270. - PubMed

Publication types

MeSH terms

Substances