. 2020 Jul:111:102436.
doi: 10.1016/j.jaut.2020.102436. Epub 2020 Mar 24.

Multi-omics: Differential expression of IFN-γ results in distinctive mechanistic features linking chronic inflammation, gut dysbiosis, and autoimmune diseases

Affiliations

Multi-omics: Differential expression of IFN-γ results in distinctive mechanistic features linking chronic inflammation, gut dysbiosis, and autoimmune diseases

Heekyong R Bae et al. J Autoimmun. 2020 Jul.

Abstract

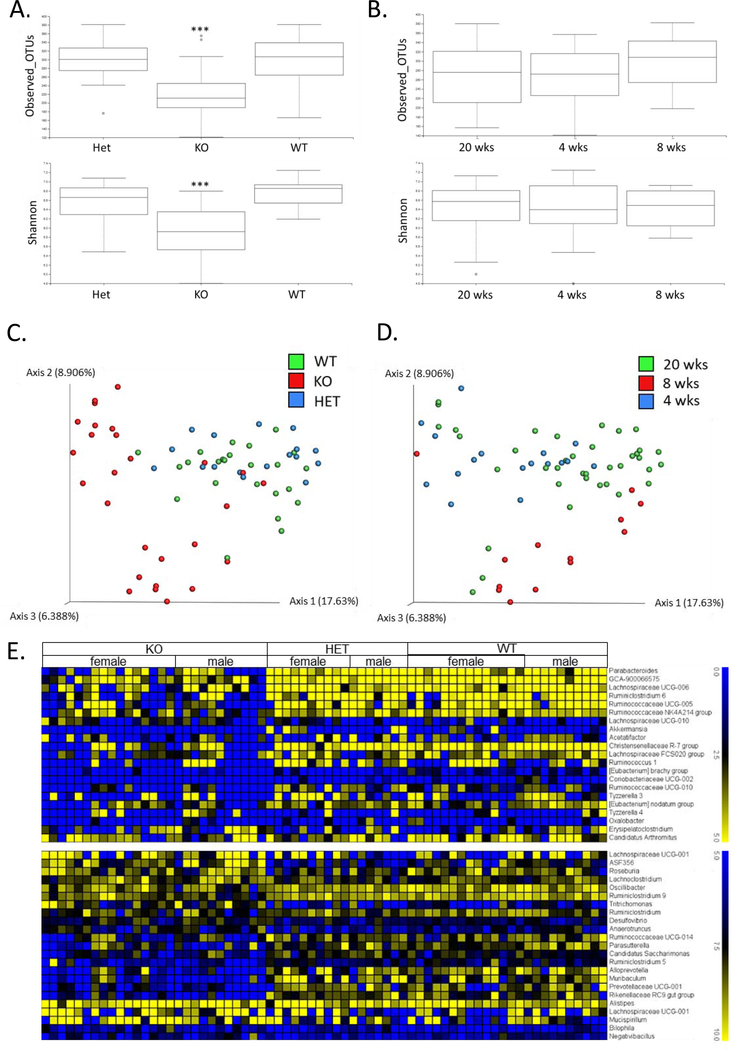
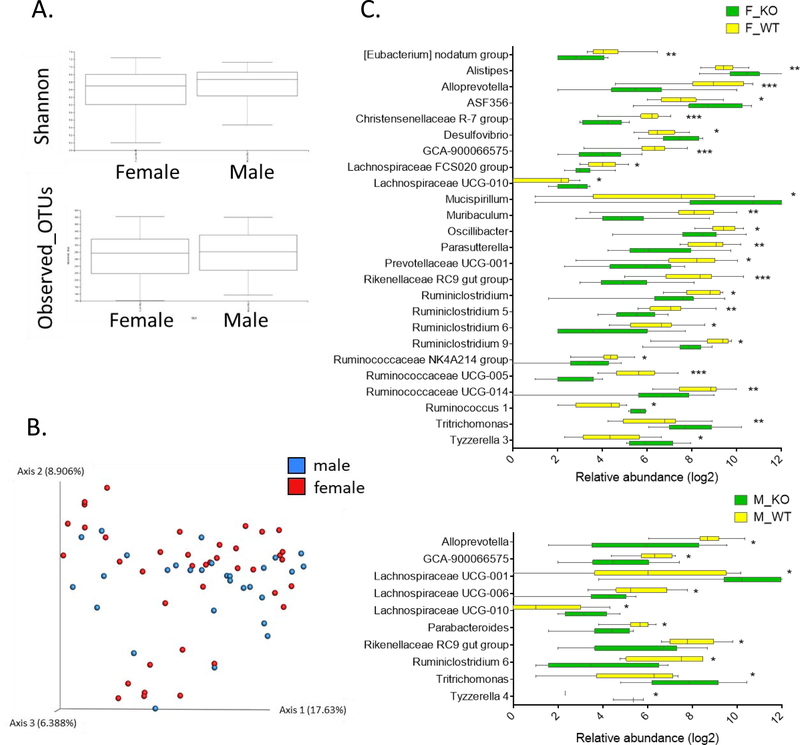
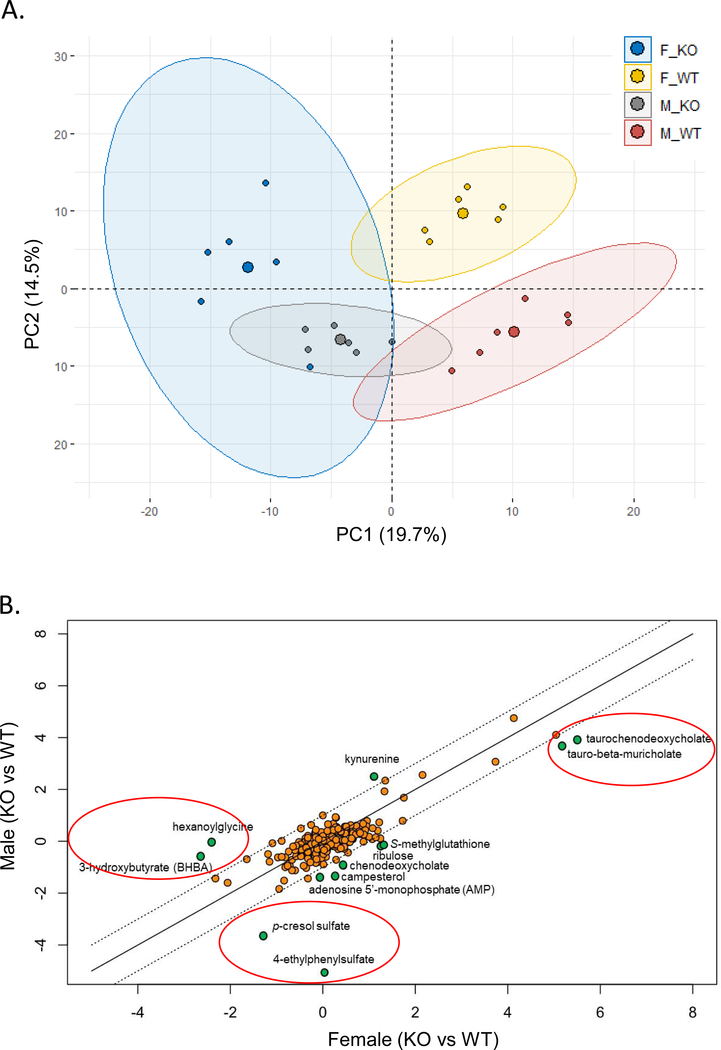
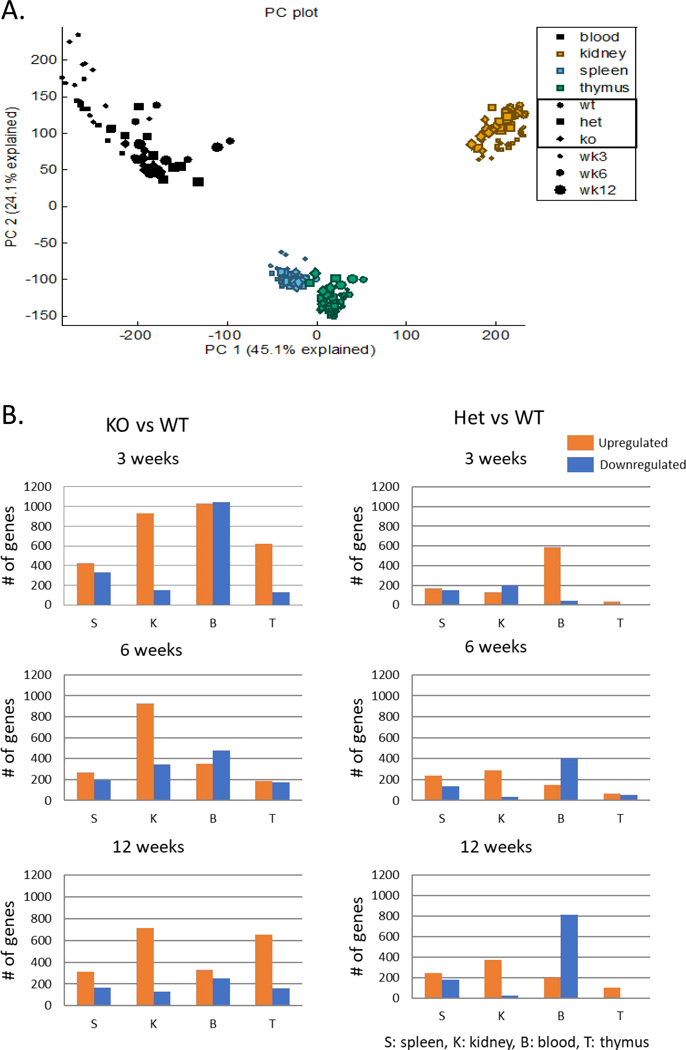
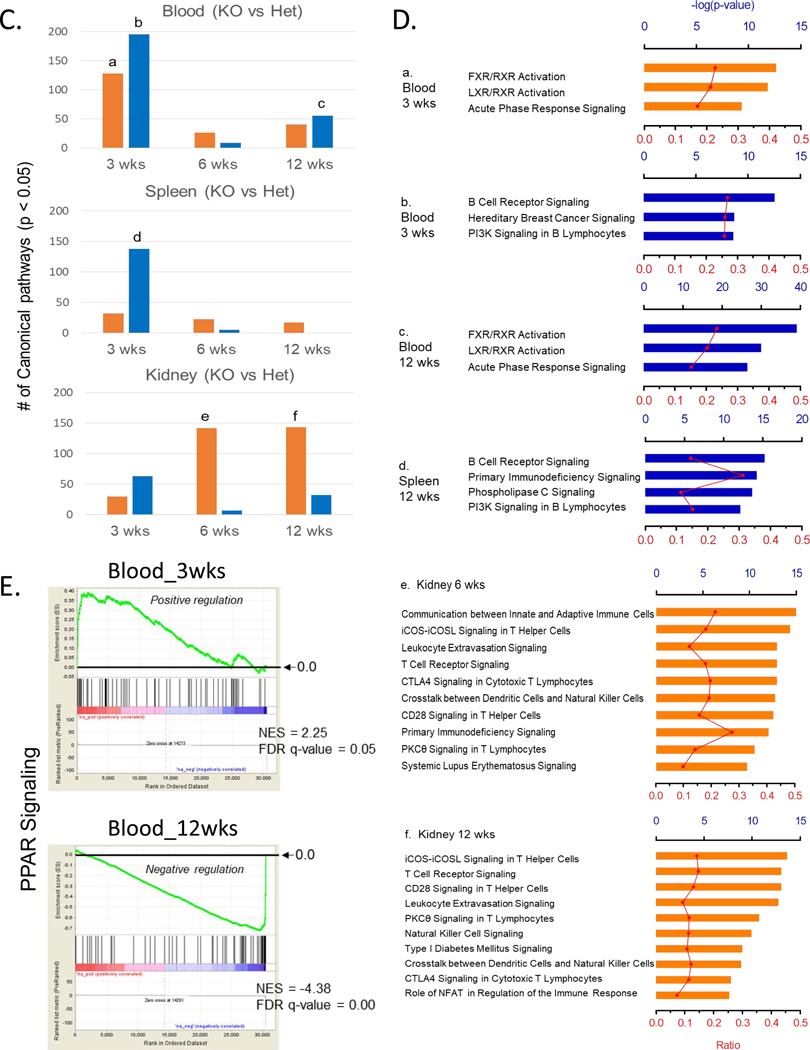
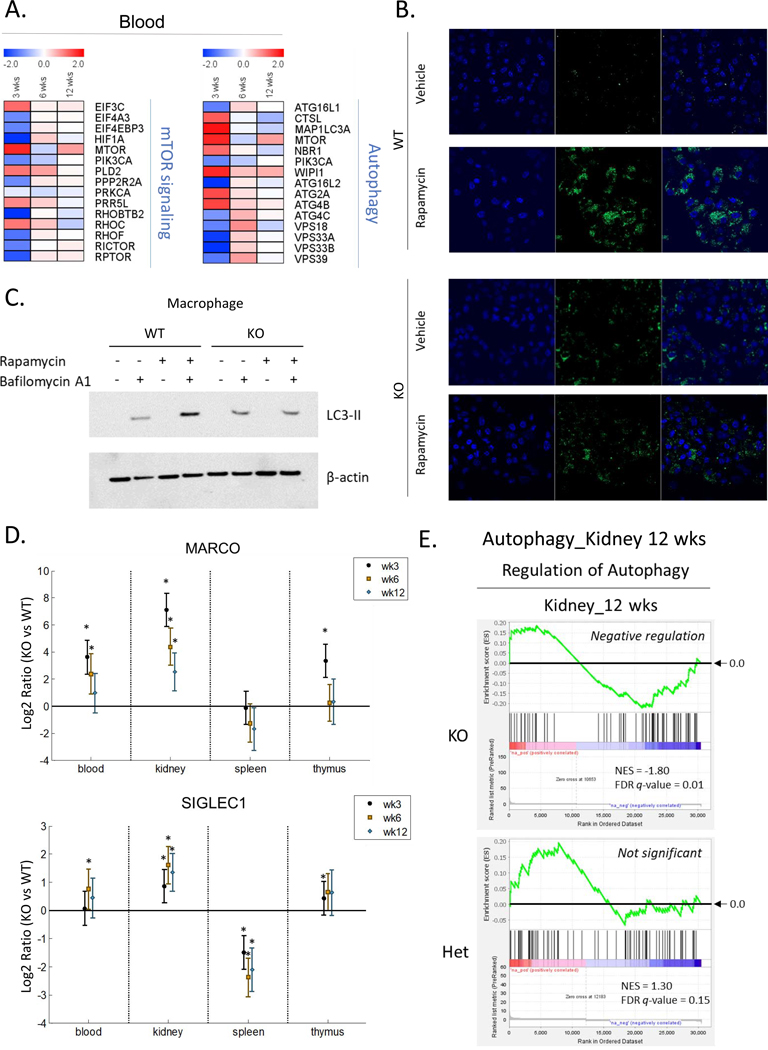
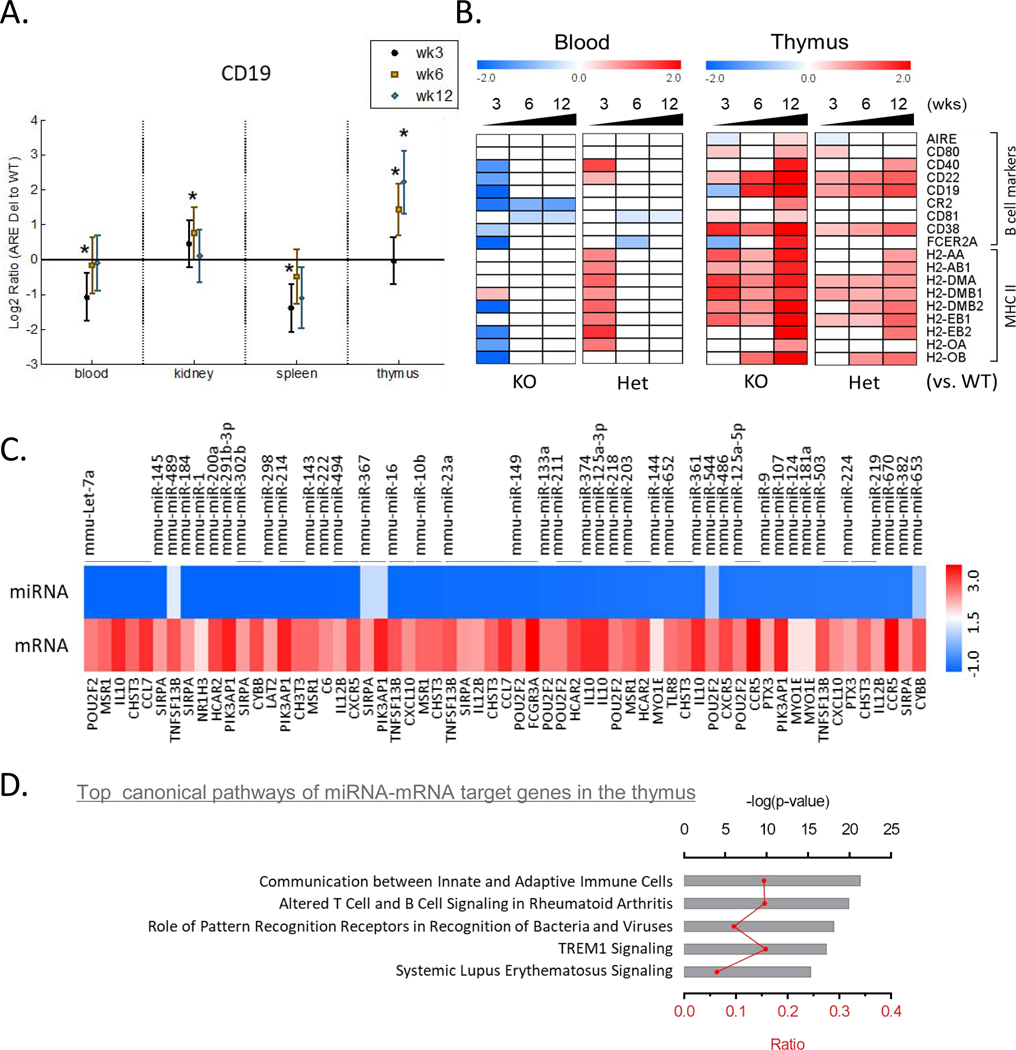
Low grade, chronic inflammation is a critical risk factor for immunologic dysfunction including autoimmune diseases. However, the multiplicity of complex mechanisms and lack of relevant murine models limit our understanding of the precise role of chronic inflammation. To address these hurdles, we took advantage of multi-omics data and a unique murine model with a low but chronic expression of IFN-γ, generated by replacement of the AU-rich element (ARE) in the 3' UTR region of IFN-γ mRNA with random nucleotides. Herein, we demonstrate that low but differential expression of IFN-γ in mice by homozygous or heterozygous ARE replacement triggers distinctive gut microbial alterations, of which alteration is female-biased with autoimmune-associated microbiota. Metabolomics data indicates that gut microbiota-dependent metabolites have more robust sex-differences than microbiome profiling, particularly those involved in fatty acid oxidation and nuclear receptor signaling. More importantly, homozygous ARE-Del mice have dramatic changes in tryptophan metabolism, bile acid and long-chain lipid metabolism, which interact with gut microbiota and nuclear receptor signaling similarly with sex-dependent metabolites. Consistent with these findings, nuclear receptor signaling, encompassing molecules such as PPARs, FXR, and LXRs, was detectable as a top canonical pathway in comparison of blood and tissue-specific gene expression between female homozygous vs heterozygous ARE-Del mice. Further analysis implies that dysregulated autophagy in macrophages is critical for breaking self-tolerance and gut homeostasis, while pathways interact with nuclear receptor signaling to regulate inflammatory responses. Overall, pathway-based integration of multi-omics data provides systemic and cellular insights about how chronic inflammation driven by IFN-γ results in the development of autoimmune diseases with specific etiopathological features.

Keywords: Autoimmune diseases; Autophagy; Chronic inflammation; Gut dysbiosis; Interferons; Multi-omics; Nuclear receptors; Sex-difference.


Figures

Figure 1.
Figure 1.
Comparison of cecal microbial profiles from homozygous and heterozygous ARE-Del mice. (A) Boxplots of observed OTUs richness and Shannon diversity indexes comparing cecum samples from homozygous (n=27) and heterozygous (n=17) ARE-Del mice with control littermates (n=25) at 20 weeks old. Kruskal-Wallis test was performed to analyze the significance (***p<0.0001). (B) Boxplots of observed OTUs richness and Shannon diversity indexes comparing different ages of 4 weeks (n=17), 8 weeks (n=13) and 20 weeks (n=39). (C) A PCoA plot of cecum samples from homozygous (KO) and heterozygous (Het) mice with control littermates (WT). (D) A PCoA plot of cecum samples collected at 4, 8 and 20 weeks of age. (C-D) Pairwise Permanova was also used to estimate beta group significance. (E) Heat map of relative expression values of normalized counts for the significant changes (p<0.05) at the genus level in female and male homozygous and heterozygous ARE-Del mice compared to control littermates.
Figure 2.
Figure 2.
Sex-specific cecal microbial profiles in ARE-Del mice. (A) Boxplots of observed OTUs richness and Shannon diversity indexes and (B) A PCoA plot comparing cecum samples from female (n=40) and male (n=29) mice (all genotypes combined). (C) Bar graphs of sex-specific intestinal bacteria at the genus level. The upper graph presents significantly changed bacteria between female homozygous ARE-Del mice (F_KO) and control female littermates (F_WT). The lower graph presents data comparing male homozygous ARE-Del mice (M_KO) and control male littermates (M_WT). The abundance of genera was converted into log fold ratio (Log2) and each bar shows Mean with SEM. Statistical analysis is performed by multiple t-test (no multiple comparisons), *P<0.05, **P<0.001, ***P<0.001.
Figure 3.
Figure 3.
Sex-specific metabolite profiles in homozygous ARE-Del mice. (A) A PCA plot of the metabolites in male or female homozygous ARE-Del mice vs control littermates. (B) Scatter plot showing the relationship of between overall metabolites (Log2 fold changes) from male or female homozygous ARE-Del mice vs control littermates. Dotted lines point relatively one fold up or down-regulated directions between male vs female homozygous ARE-Del mice. (C) Heatmap of differentially expressed metabolites (p<0.05), which were selected from Figure B and presented by log2 fold change. (p<0.05). (D-E) FAO related metabolites (hexanoylglycine and 3-hydroxybutyrate) in male and female homozygous ARE-Del mice compared to control littermates (each group, n=4–6). Statistical analysis is performed by Mann Whitney test (**p<0.001). Sex-different bile acid composition in male and female homozygous ARE-Del mice (F-G). (F) The relative ratio of bile acids was calculated by comparison of fold changes between male or female homozygous ARE-Del vs control littermates. (G) The relative ratio of Tauro-conjugated vs unconjugated bile acids in male and female ARE-Del−/− mice. CA; cholate, TCA; taurocholate, DCA; deoxycholate, TDCA; taurodeoxycholate, βMCA; beta-muricholate, TβMCA; tauro-beta-muricholate, CDCA; chenodeoxycholate, TCDCA; taurochenodeoxycholate.
Figure 3.
Figure 3.
Sex-specific metabolite profiles in homozygous ARE-Del mice. (A) A PCA plot of the metabolites in male or female homozygous ARE-Del mice vs control littermates. (B) Scatter plot showing the relationship of between overall metabolites (Log2 fold changes) from male or female homozygous ARE-Del mice vs control littermates. Dotted lines point relatively one fold up or down-regulated directions between male vs female homozygous ARE-Del mice. (C) Heatmap of differentially expressed metabolites (p<0.05), which were selected from Figure B and presented by log2 fold change. (p<0.05). (D-E) FAO related metabolites (hexanoylglycine and 3-hydroxybutyrate) in male and female homozygous ARE-Del mice compared to control littermates (each group, n=4–6). Statistical analysis is performed by Mann Whitney test (**p<0.001). Sex-different bile acid composition in male and female homozygous ARE-Del mice (F-G). (F) The relative ratio of bile acids was calculated by comparison of fold changes between male or female homozygous ARE-Del vs control littermates. (G) The relative ratio of Tauro-conjugated vs unconjugated bile acids in male and female ARE-Del−/− mice. CA; cholate, TCA; taurocholate, DCA; deoxycholate, TDCA; taurodeoxycholate, βMCA; beta-muricholate, TβMCA; tauro-beta-muricholate, CDCA; chenodeoxycholate, TCDCA; taurochenodeoxycholate.
Figure 4.
Figure 4.
Overall age-and tissue-dependent gene expression profiles in female homozygous and heterozygous ARE-Del mice with control littermates. (A) A PCA plot of overall gene expression in blood, kidney, spleen, and thymus at 3, 6, 12 weeks in homozygous and heterozygous ARE-Del mice with control littermates. (B) Comparison of upregulated or downregulated genes in PBMC, spleen, thymus, and kidney from homozygous and heterozygous ARE-Del mice compared to control littermates at 3, 6, 12 wks. The total height of each bar indicates the number of genes (orange bar; upregulated genes, blue bar; downregulated genes). S; spleen, K; kidney, B; blood, T; thymus. (C) Number of canonical pathways in homozygous ARE-Del mice compared to heterozygous ARE-Del mice in PBMC, spleen, and kidney at 3, 6, and 12 weeks old. The total height of each bar indicates the number of significant canonical pathways derived from upregulated (orange) or downregulated (blue) genes in female homozygous ARE-Del mice compared to heterozygotes. (D) The significant number of canonical pathways from Figure 5A was calculated by –log (p-value) less than 1.5 (relative to p-value < 0.05). Ratio (red line) refers to the number of genes from the data set divided by the total number of genes according to the IPA knkowledge base. a-f; representative top canonical pathways ordered from the highest one in each group. (E) GSEA plots of PPAR signaling in the blood with a comparison between 3 and 12 weeks in female homozygous ARE-Del mice. PPAR signaling gene set was derived from the GSEA database, and enrichment was defined by normalized enrichment score (NES), false discovery rate (FDR) q-value.
Figure 4.
Figure 4.
Overall age-and tissue-dependent gene expression profiles in female homozygous and heterozygous ARE-Del mice with control littermates. (A) A PCA plot of overall gene expression in blood, kidney, spleen, and thymus at 3, 6, 12 weeks in homozygous and heterozygous ARE-Del mice with control littermates. (B) Comparison of upregulated or downregulated genes in PBMC, spleen, thymus, and kidney from homozygous and heterozygous ARE-Del mice compared to control littermates at 3, 6, 12 wks. The total height of each bar indicates the number of genes (orange bar; upregulated genes, blue bar; downregulated genes). S; spleen, K; kidney, B; blood, T; thymus. (C) Number of canonical pathways in homozygous ARE-Del mice compared to heterozygous ARE-Del mice in PBMC, spleen, and kidney at 3, 6, and 12 weeks old. The total height of each bar indicates the number of significant canonical pathways derived from upregulated (orange) or downregulated (blue) genes in female homozygous ARE-Del mice compared to heterozygotes. (D) The significant number of canonical pathways from Figure 5A was calculated by –log (p-value) less than 1.5 (relative to p-value < 0.05). Ratio (red line) refers to the number of genes from the data set divided by the total number of genes according to the IPA knkowledge base. a-f; representative top canonical pathways ordered from the highest one in each group. (E) GSEA plots of PPAR signaling in the blood with a comparison between 3 and 12 weeks in female homozygous ARE-Del mice. PPAR signaling gene set was derived from the GSEA database, and enrichment was defined by normalized enrichment score (NES), false discovery rate (FDR) q-value.
Figure 5.
Figure 5.
Dysregulated autophagy process from female homozygous ARE-Del mice. (A) Heat map of the PBMC gene expression in mTOR signaling and autophagy process in female homozygous ARE-Del mice compared to heterozygotes. (B) Representative images of autophagosome formation after rapamycin treatment in born-marrow derived macrophages from female homozygous ARE-Del mice and control wild type mice. Both normal control and treated cells were stained with Cyto-ID® green dye and Hoechst 33342, followed by the manufacturer’s protocol. (C) Immunoblotting to detect the accumulation of LC3-II upon treatment of rapamycin (3 uM, 2 hrs) with or without pre-treatment of bafilomycin A1 (50 nM, 30 min prior to rapamycin). (D) Gene expression levels of macrophage markers (Marco and Siglec1) comparing homozygous ARE Del mice to control littermates in the PBMCs, kidney, spleen, and thymus according at 3, 6, and 12 weeks old. Statistical analysis is performed by t-test, *P<0.05. (E) GSEA plots of positive regulation of the autophagy process in the kidney from homozygous and heterozygous ARE-Del mice at 12 weeks old.
Figure 6.
Figure 6.
Correlation between early loss of peripheral B cells and late increase of thymic B cells. (A) Gene expression levels of CD19 comparing homozygous ARE Del mice to control littermates in the PBMCs, kidney, spleen, and thymus at 3, 6, and 12 weeks old. Statistical analysis is performed by t-test, *P<0.05. (B) Heat map of genes for B cell markers and MHC II molecules in PBMCs and thymus according to ages in female homozygous and heterozygous ARE-Del mice compared to control littermates. (C) Heat map of miRNA-mRNA target genes in the thymus. Significantly changed microRNAs in the thymus were selected by p-value (p<0.05) and fold changes (fold change threshold ±1.5). Target genes (21 genes without overlapping) were identified by integration of miRNAs and mRNAs, which significantly changed in the thymus at 12 weeks old, using the IPA’s miRNA target filter. (D) Top cannonical pathways of significantly chanted miRNA-mRNA target genes were analyzed by -log(p-value) and ratio according to IPA. Red shading indicates an increase, green shading indicates a decrease.

References

    1. Hunter P. The inflammation theory of disease. The growing realization that chronic inflammation is crucial in many diseases opens new avenues for treatment. EMBO reports, 2012;13:968–70. - PMC - PubMed
    1. Liu CH, Abrams ND, Carrick DM, Chander P, Dwyer J, Hamlet MRJ et al. Biomarkers of chronic inflammation in disease development and prevention: challenges and opportunities. Nature immunology, 2017;18:1175–80. - PubMed
    1. Ercolini AM, Miller SD. The role of infections in autoimmune disease. Clinical and experimental immunology, 2009;155:1–15. - PMC - PubMed
    1. Samuel CE. Antiviral actions of interferons. Clinical microbiology reviews, 2001;14:778–809, table of contents. - PMC - PubMed
    1. Meyer O. Interferons and autoimmune disorders. Joint, bone, spine : revue du rhumatisme, 2009;76:464–73. - PubMed

Publication types

Substances