. 2020 Sep;73(3):616-627.
doi: 10.1016/j.jhep.2020.03.023. Epub 2020 Mar 24.

MLKL-dependent signaling regulates autophagic flux in a murine model of non-alcohol-associated fatty liver and steatohepatitis

Affiliations

MLKL-dependent signaling regulates autophagic flux in a murine model of non-alcohol-associated fatty liver and steatohepatitis

Xiaoqin Wu et al. J Hepatol. 2020 Sep.

Erratum in

Abstract

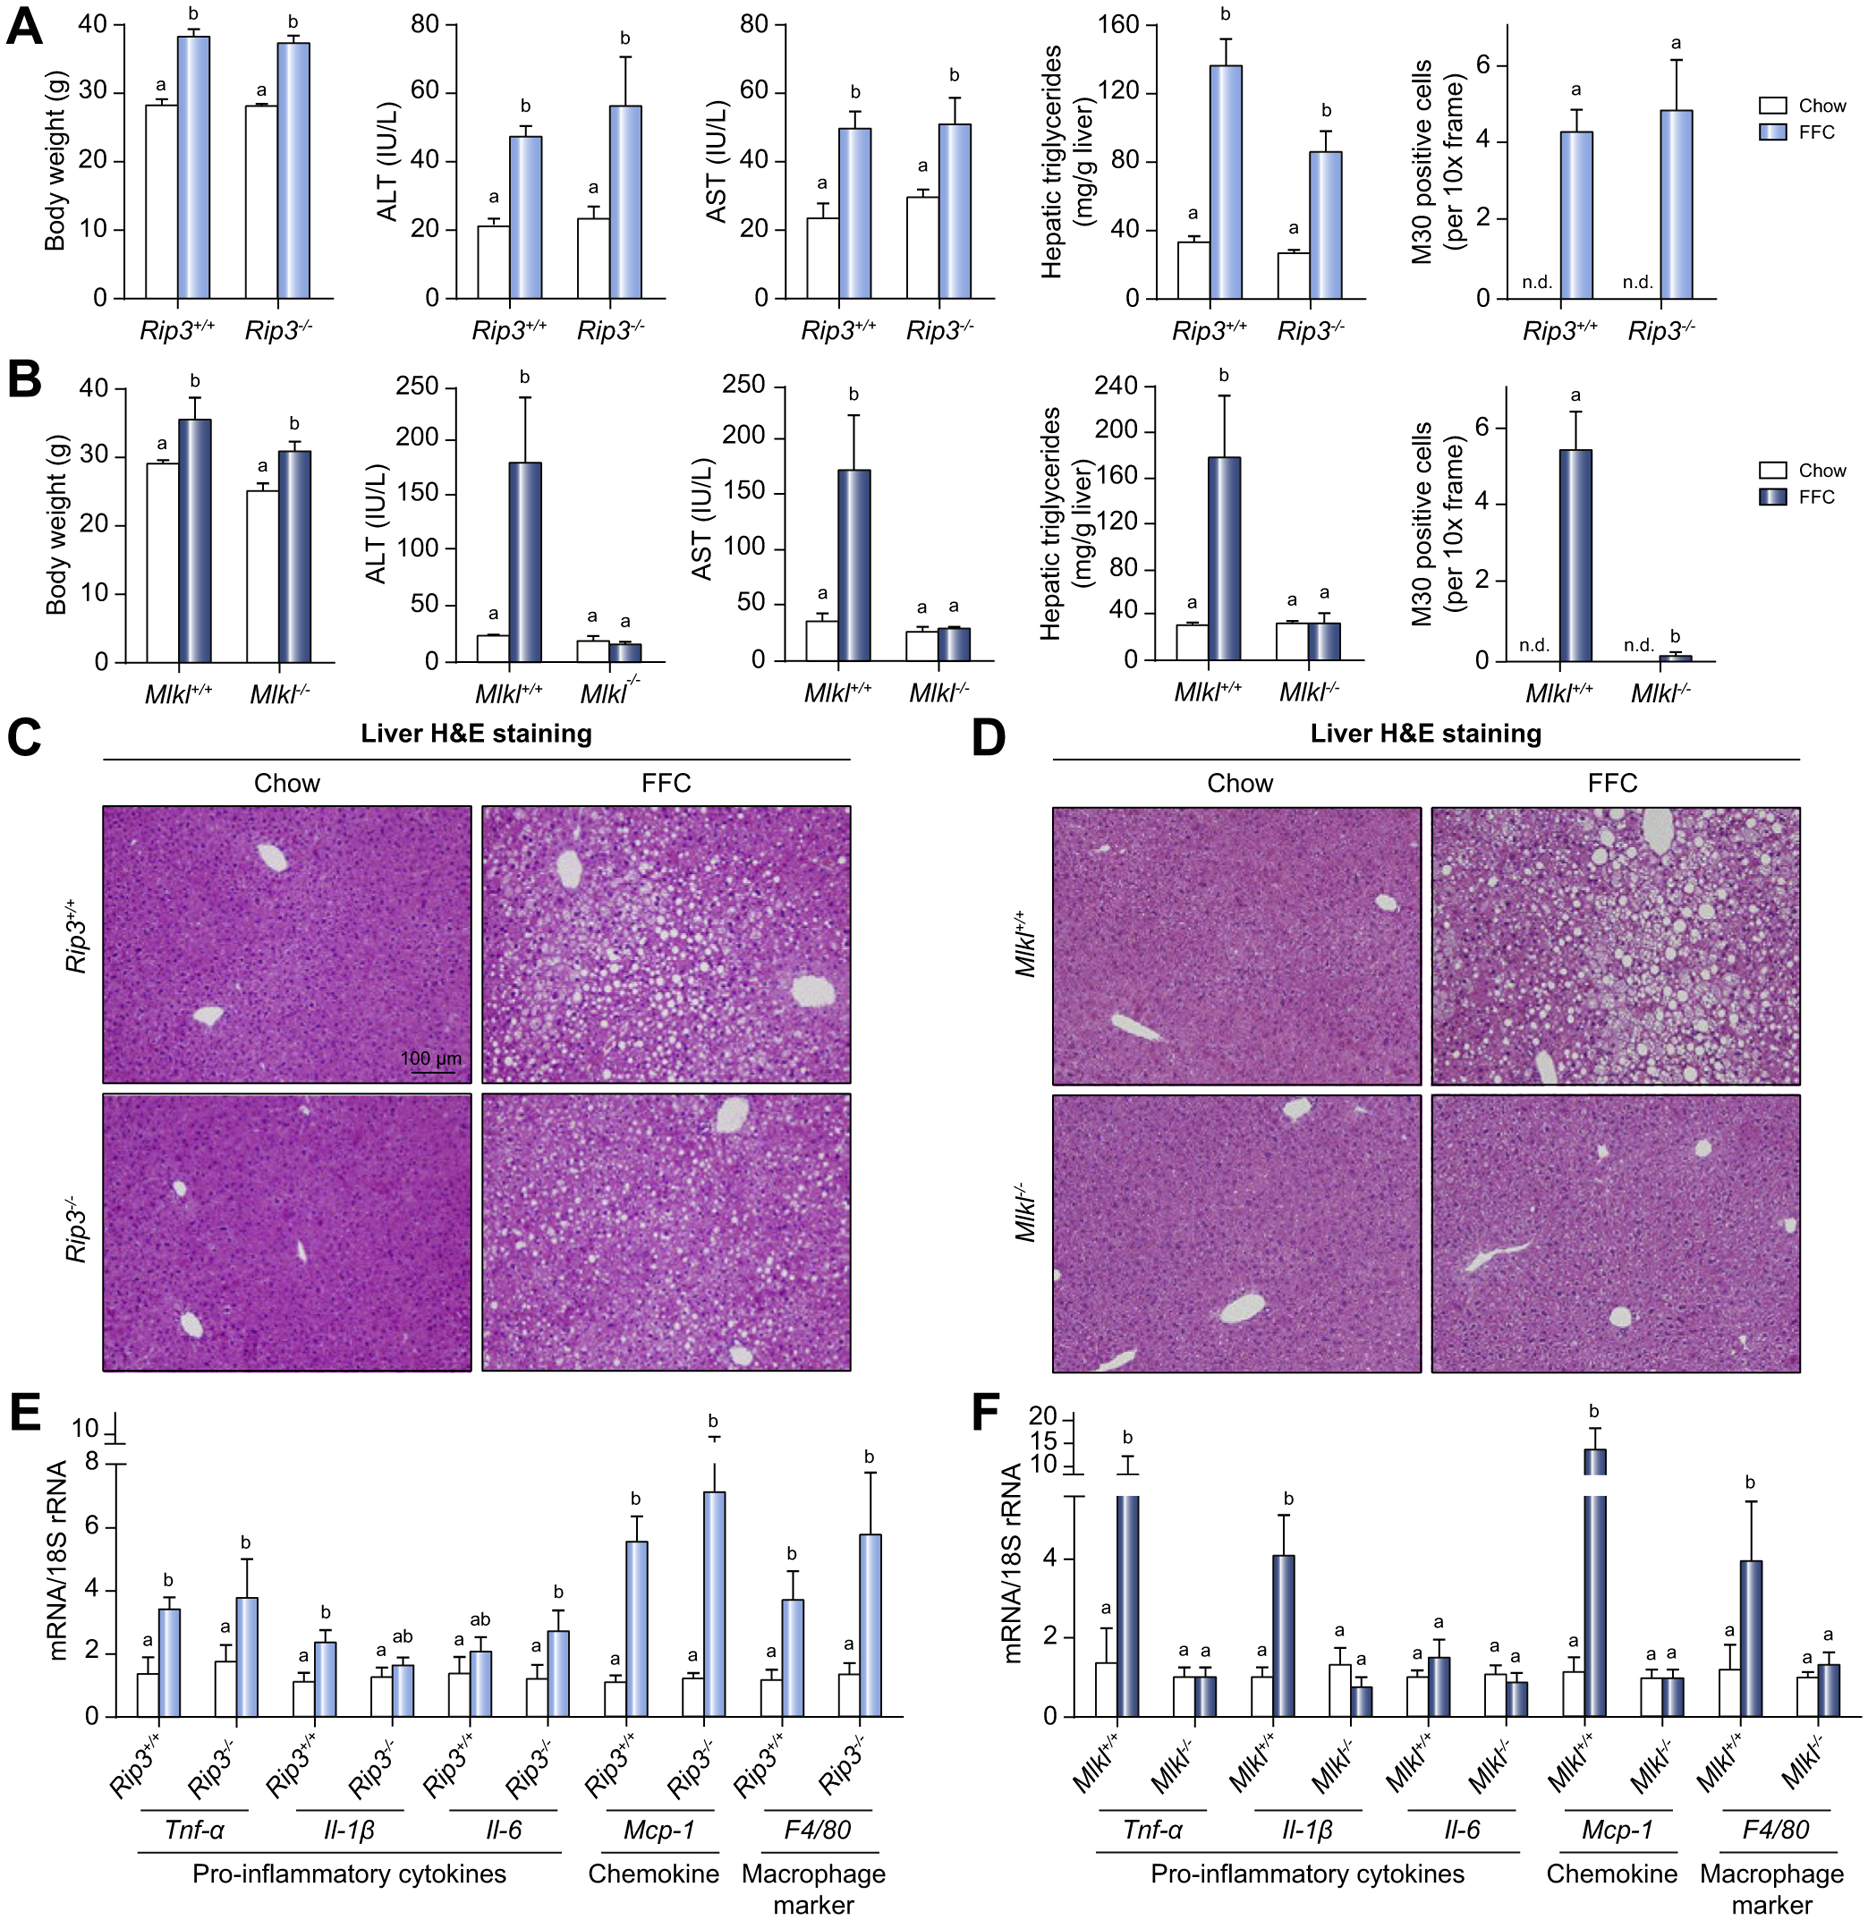
Background & aims: Autophagy maintains cellular homeostasis and plays a critical role in the development of non-alcoholic fatty liver and steatohepatitis. The pseudokinase mixed lineage kinase domain-like (MLKL) is a key downstream effector of receptor interacting protein kinase 3 (RIP3) in the necroptotic pathway of programmed cell death. However, recent data reveal that MLKL also regulates autophagy. Herein, we tested the hypothesis that MLKL contributes to the progression of Western diet-induced liver injury in mice by regulating autophagy.

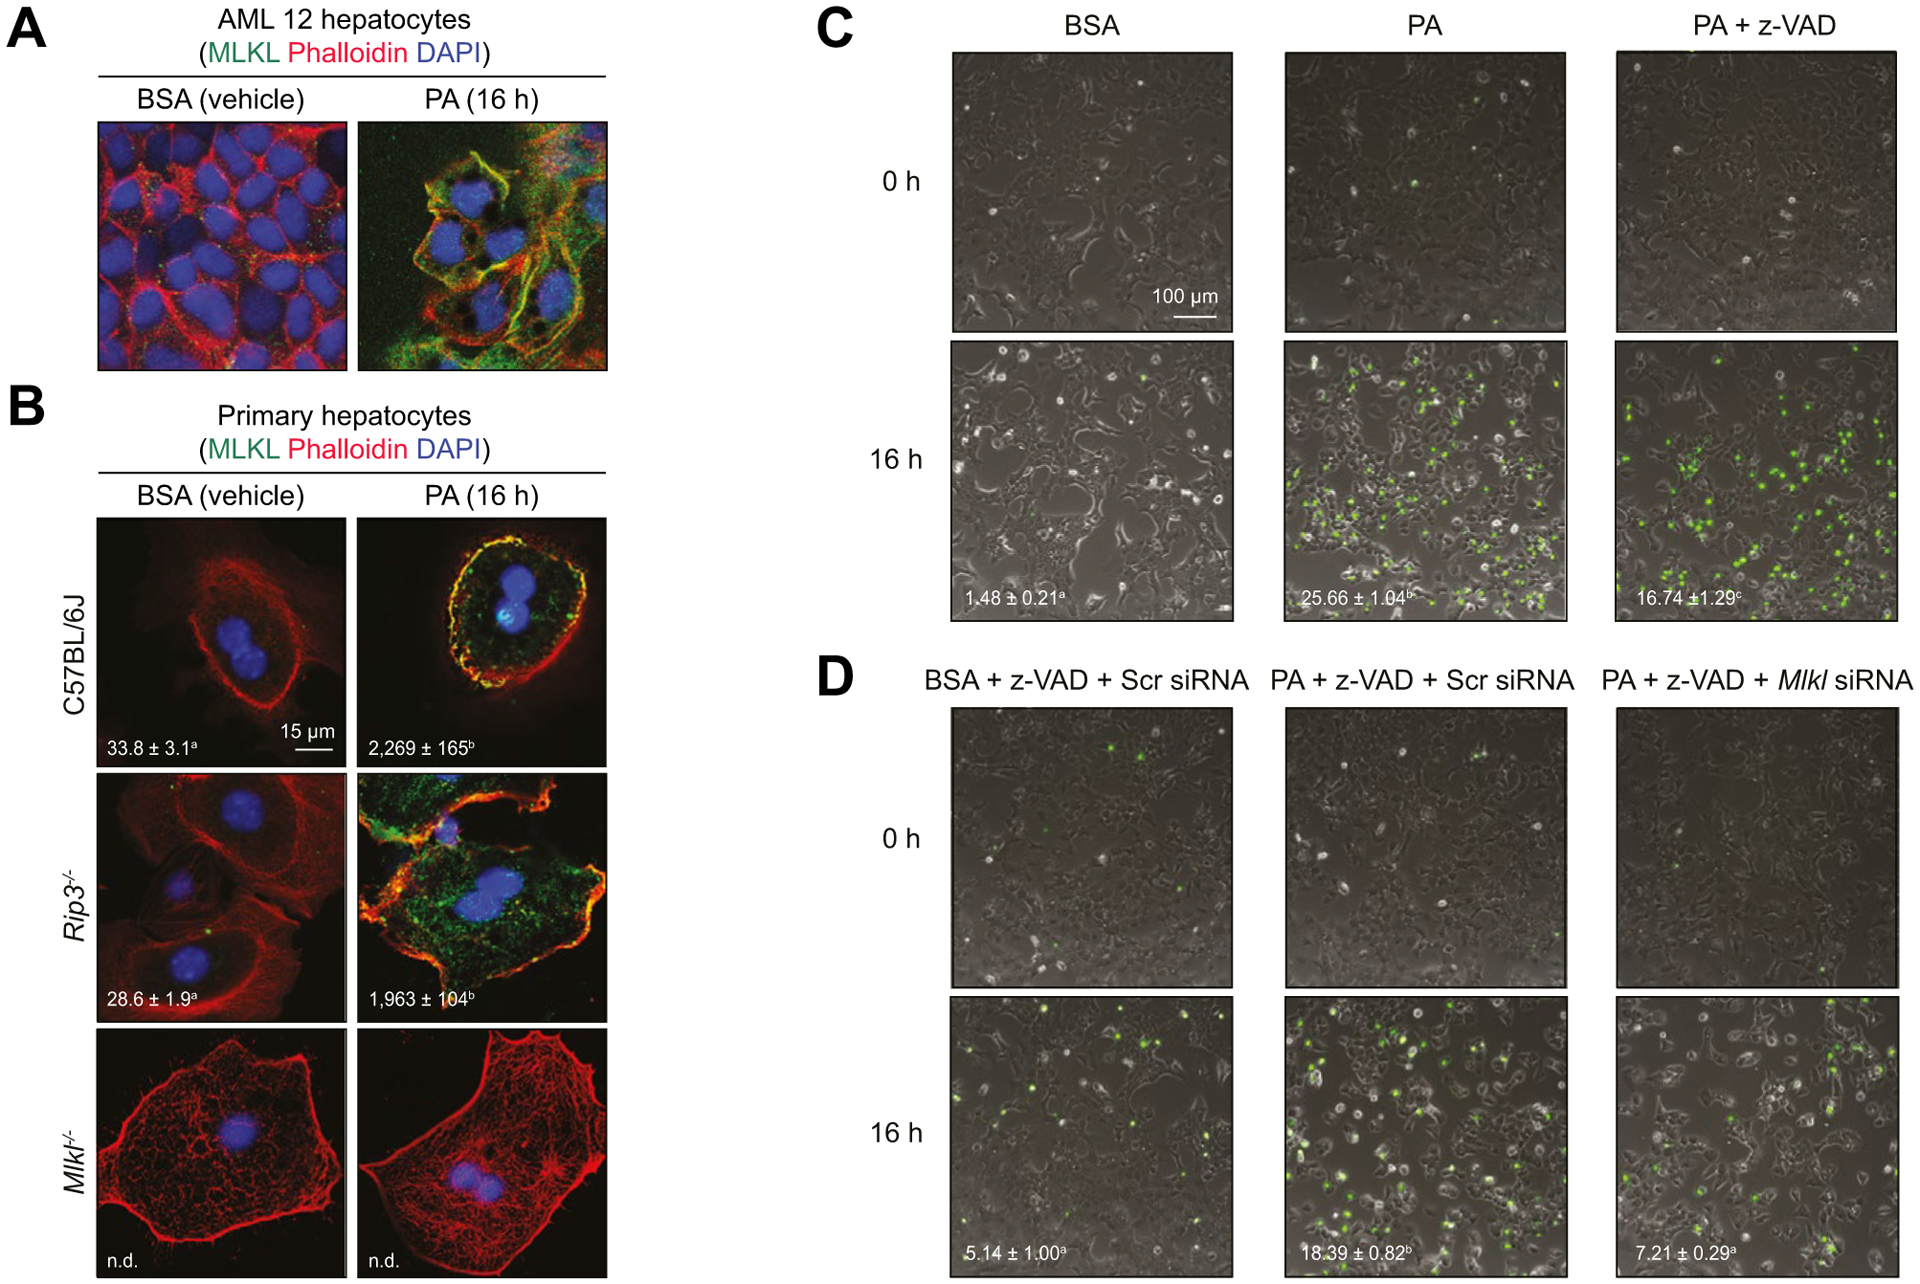
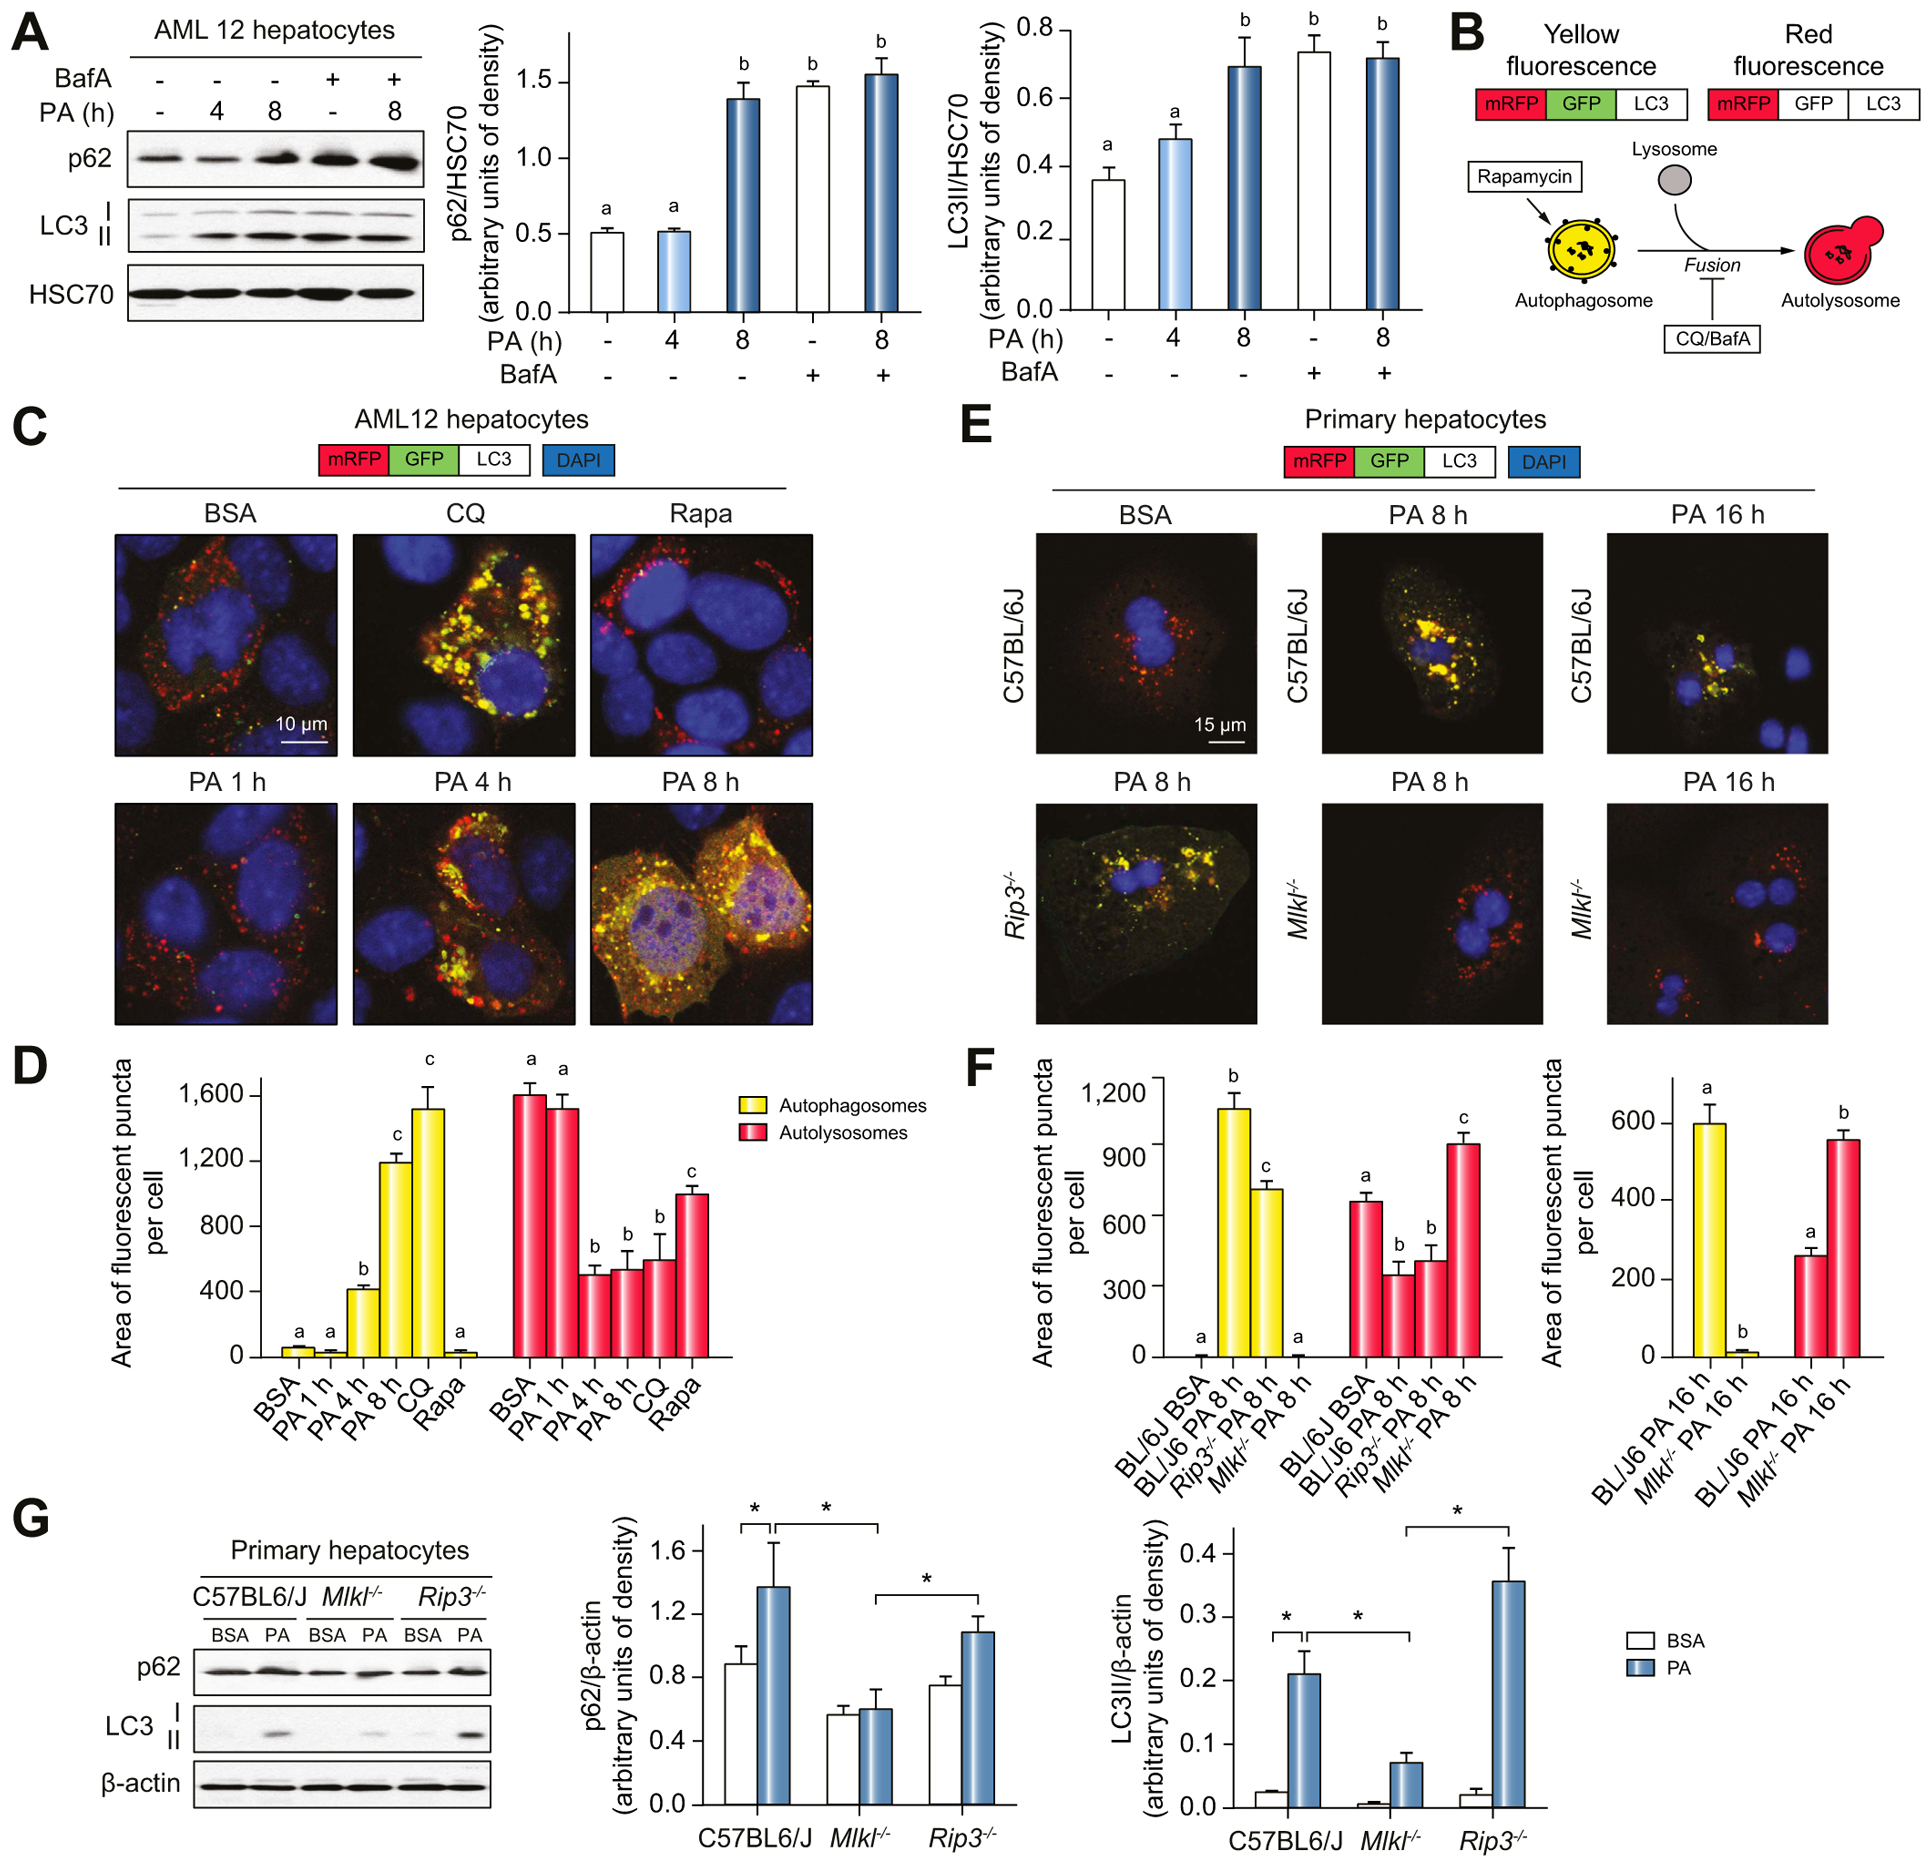
Methods: Rip3+/+, Rip3-/-, Mlkl+/+ and Mlkl-/- mice were fed a Western diet (FFC diet, high in fat, fructose and cholesterol) or chow for 12 weeks. AML12 and primary mouse hepatocytes were exposed to palmitic acid (PA).

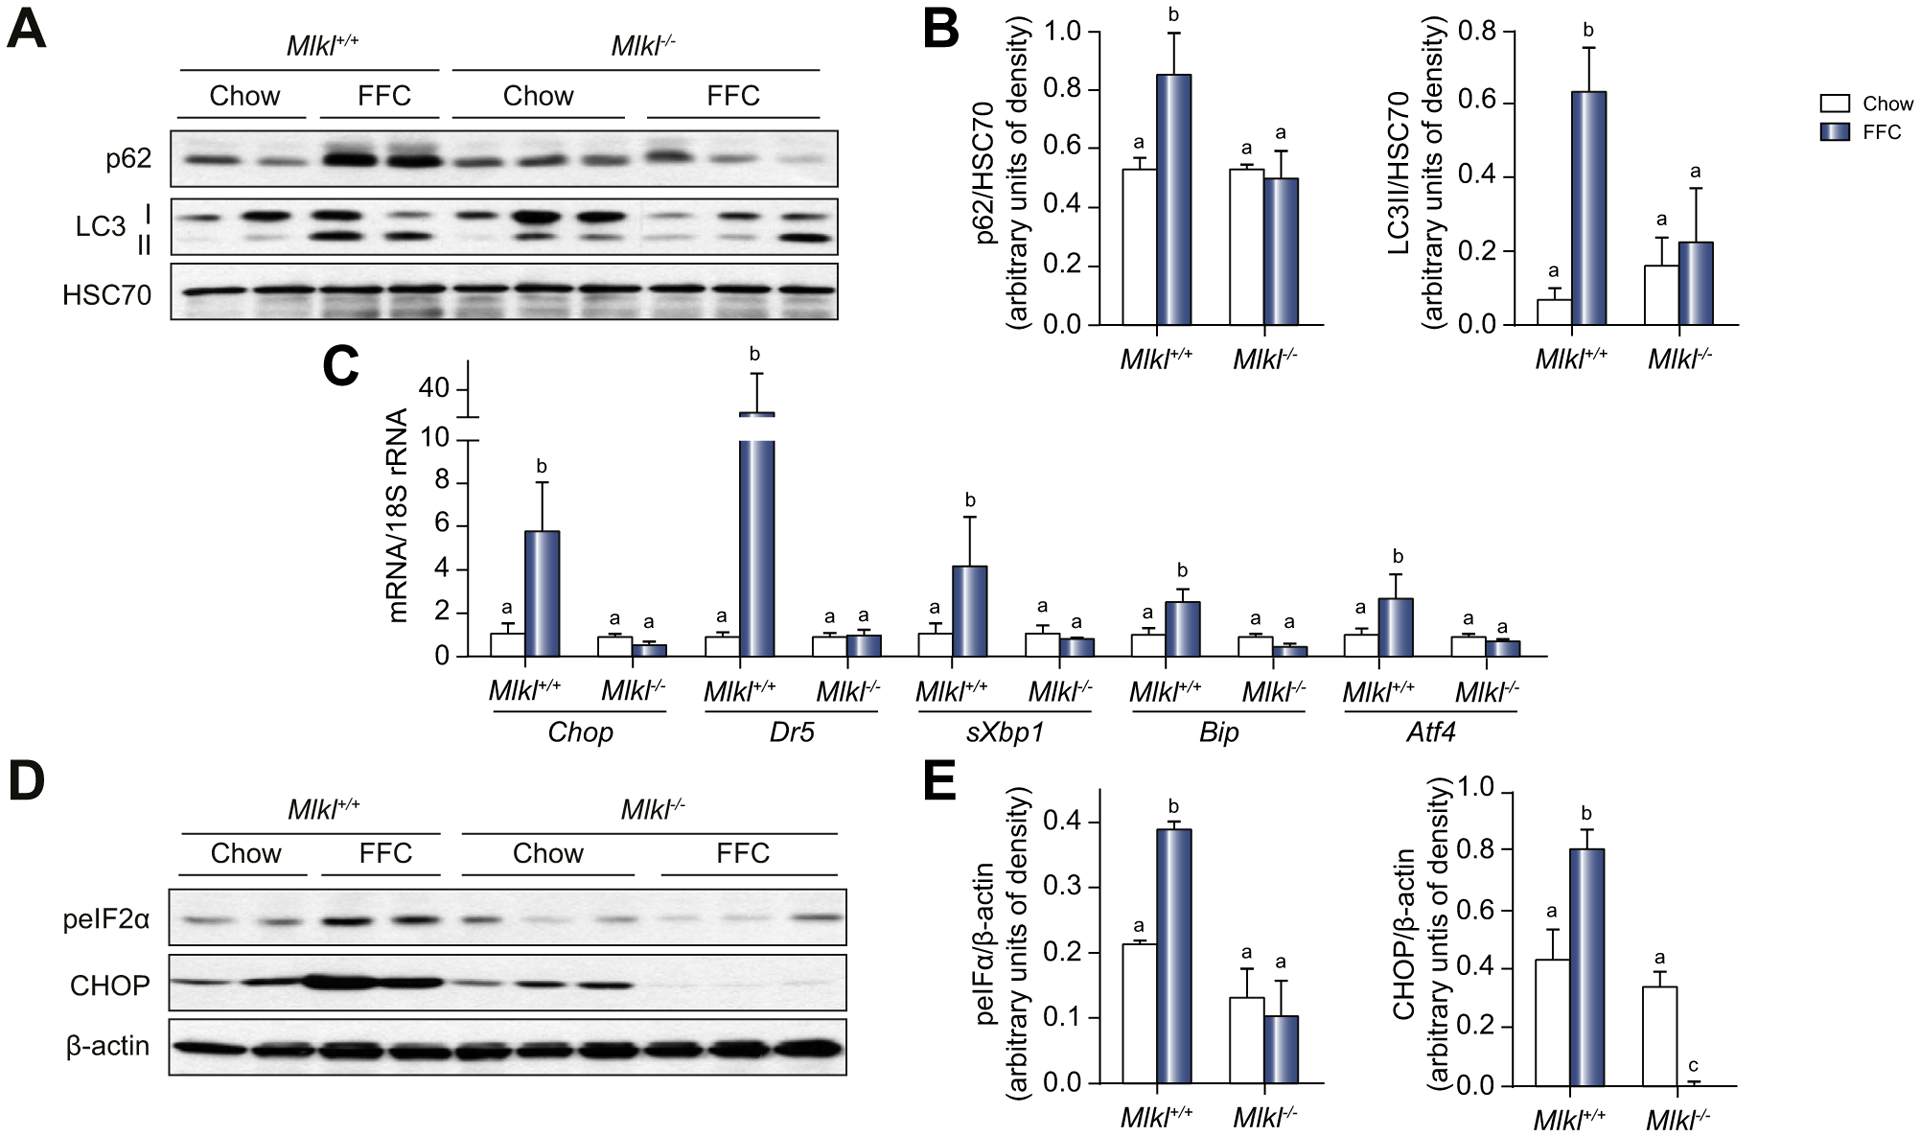
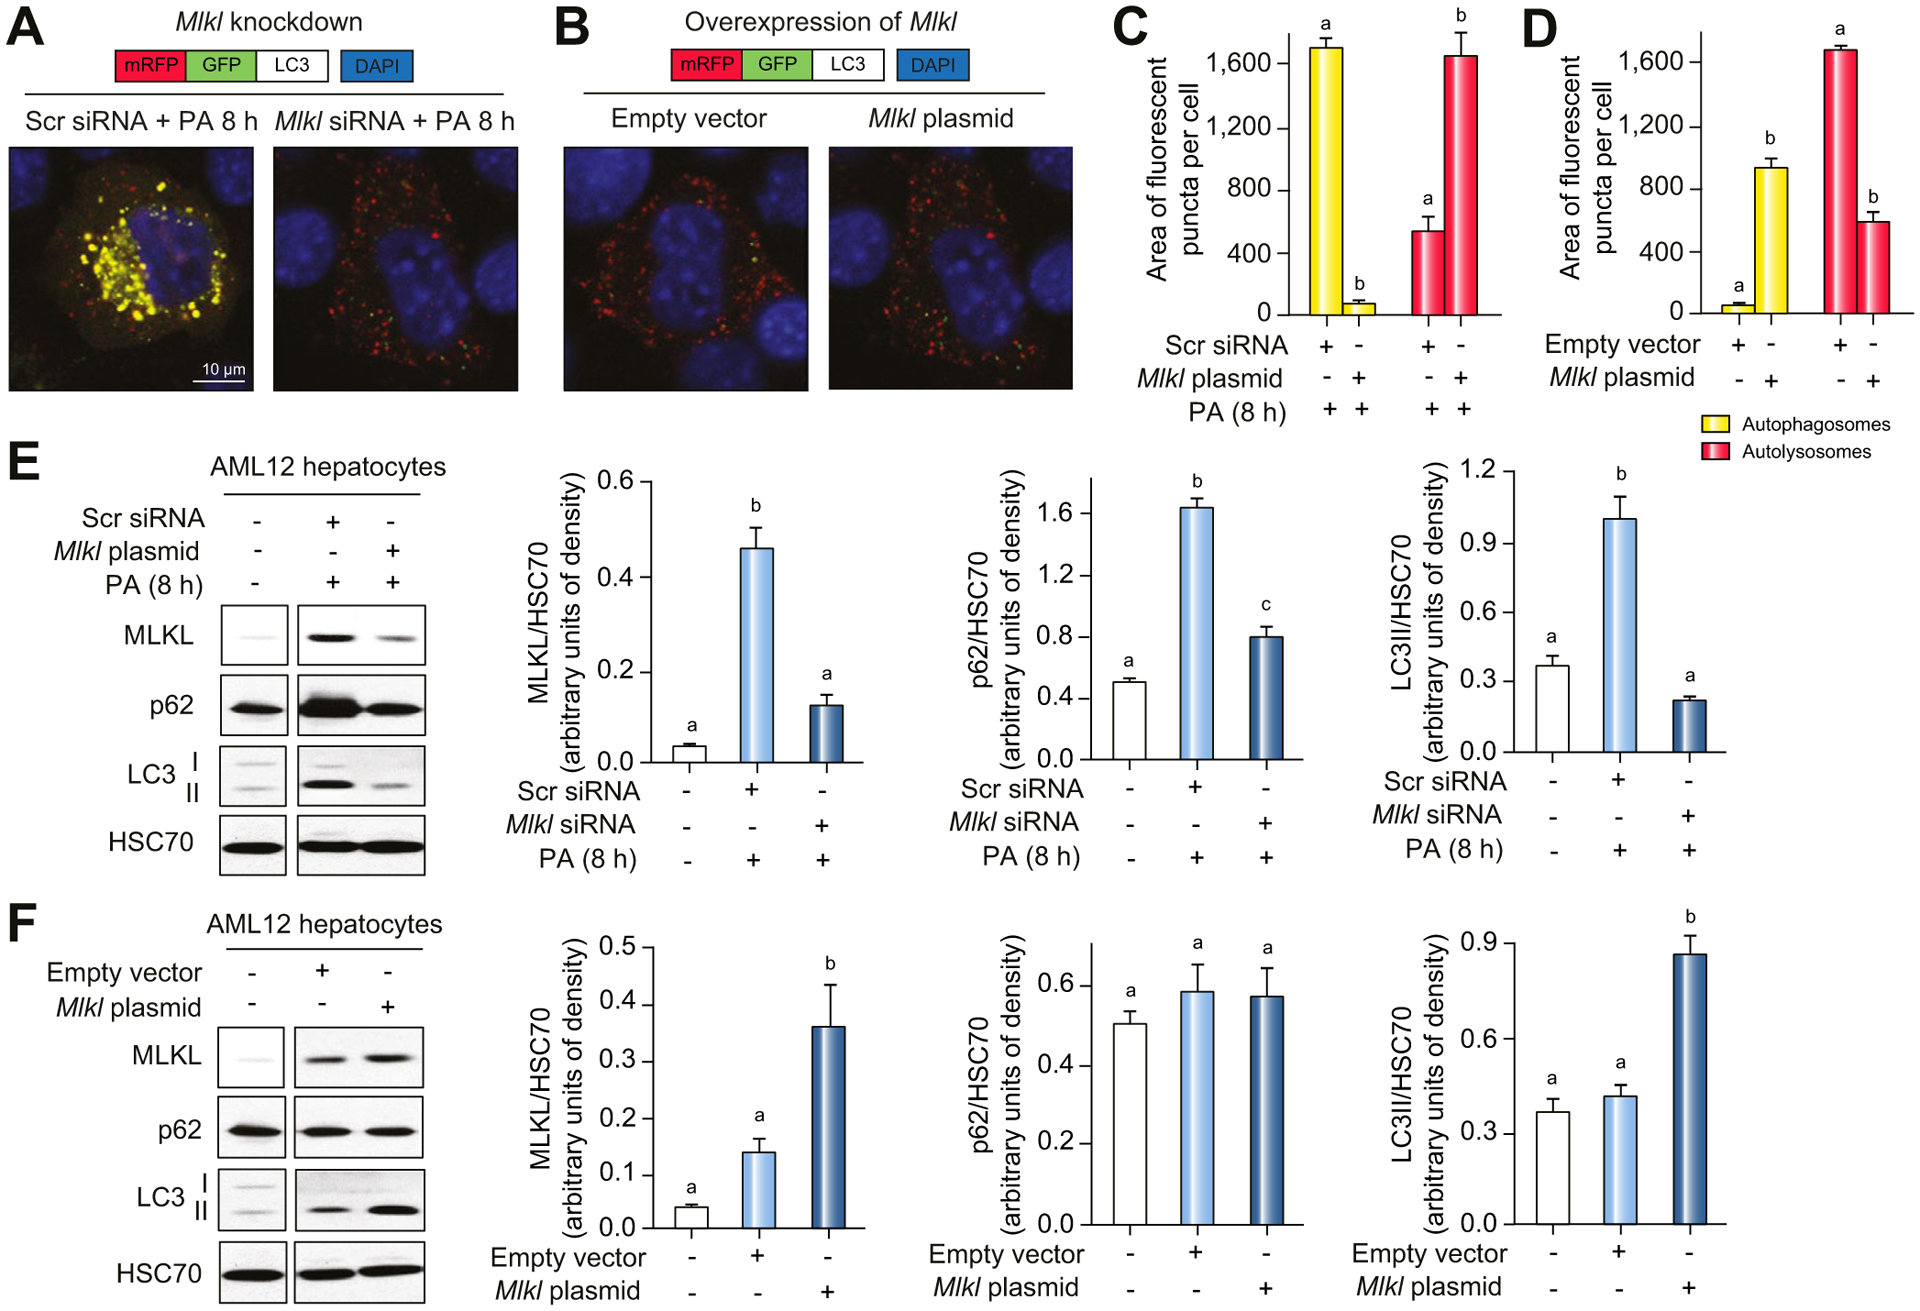
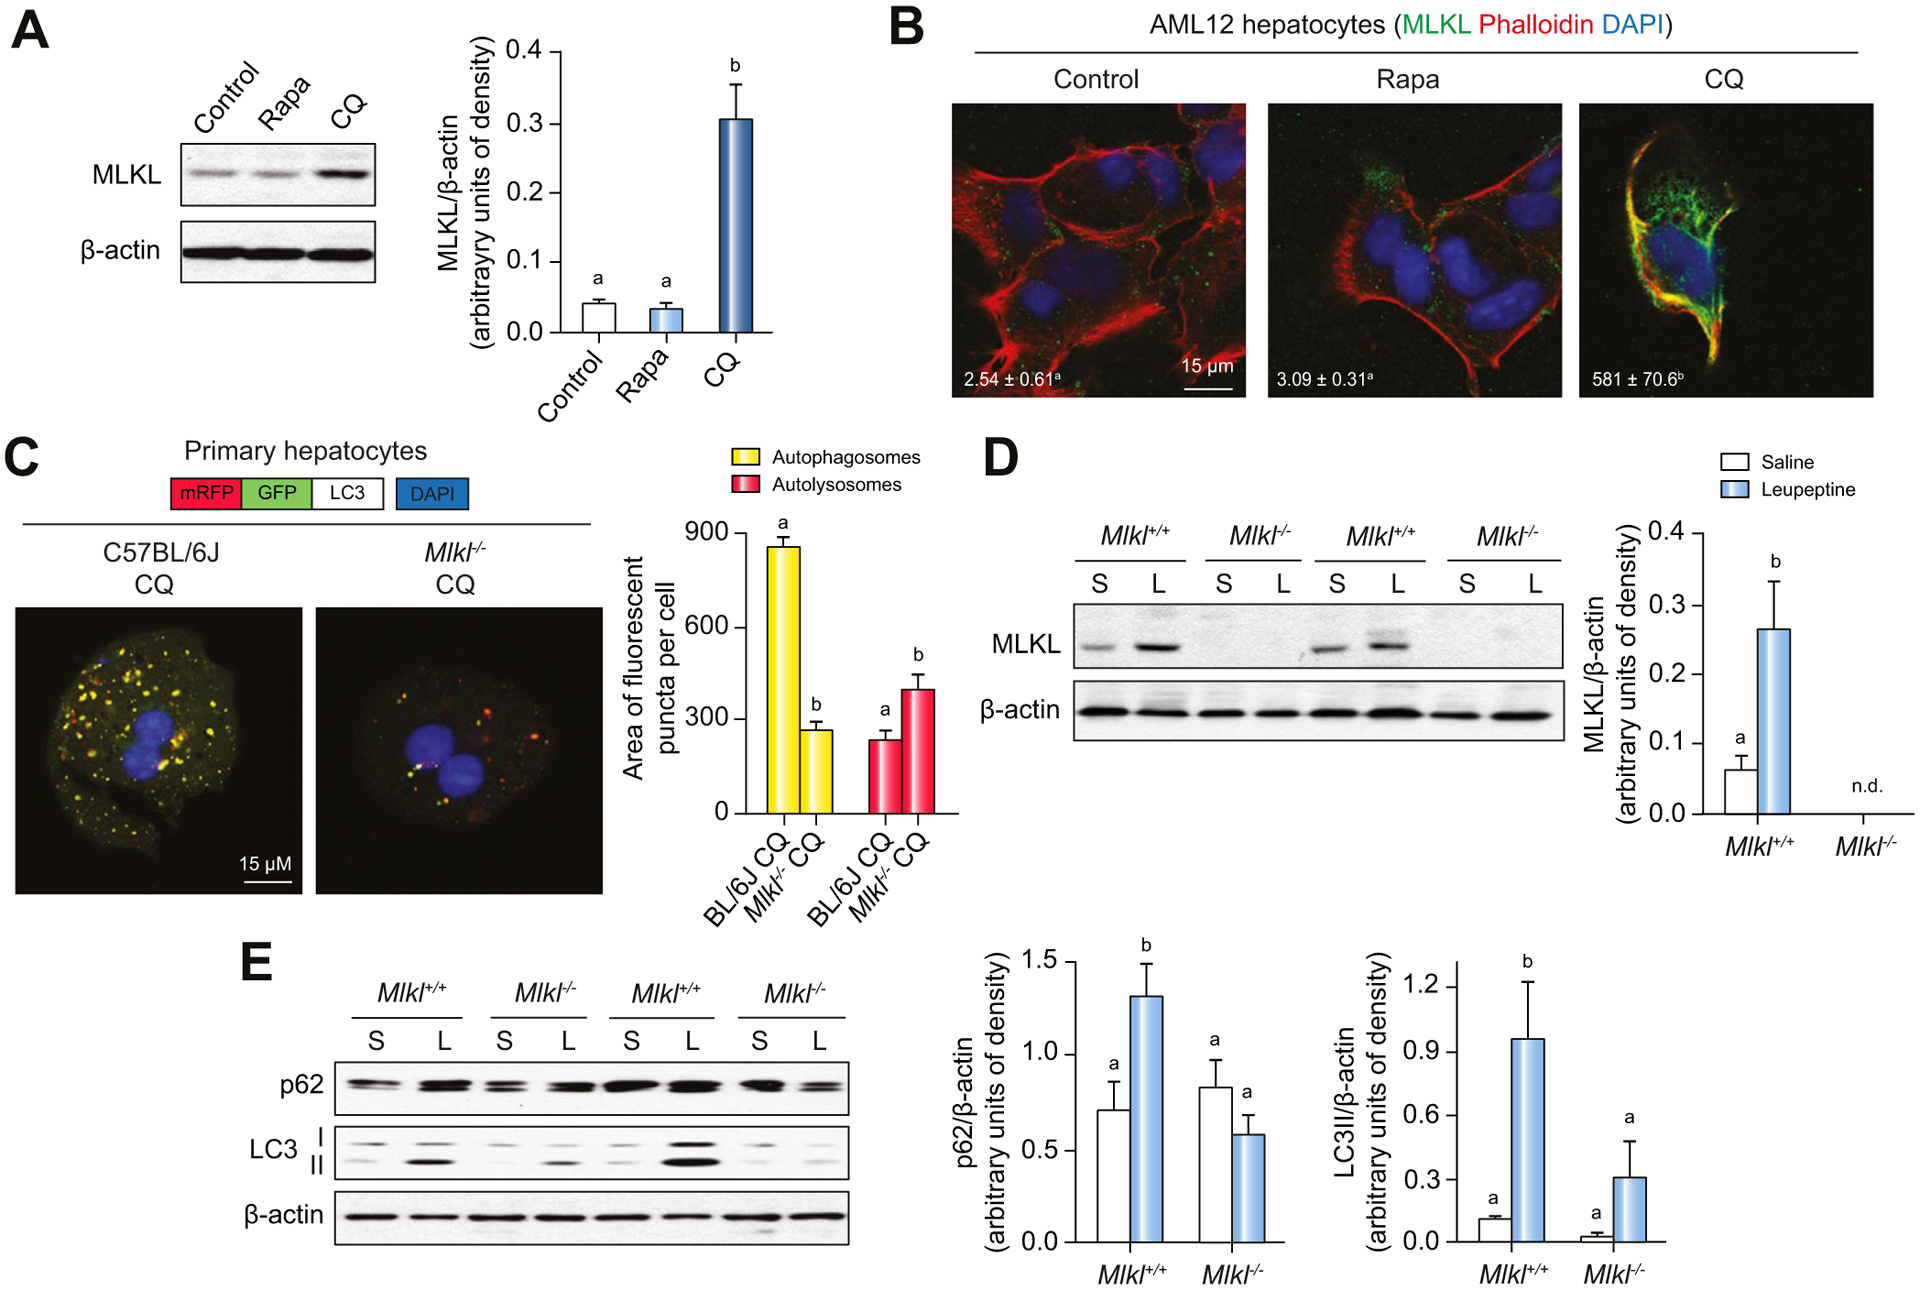
Results: The FFC diet increased expression, phosphorylation and oligomerization of MLKL in the liver. Mlkl, but not Rip3, deficiency protected mice from FFC diet-induced liver injury. The FFC diet also induced accumulation of p62 and LC3-II, as well as markers of endoplasmic reticulum stress, in Mlkl+/+ but not Mlkl-/- mice. Mlkl deficiency in mice also prevented the inhibition of autophagy by a protease inhibitor, leupeptin. Using an mRFP-GFP-LC3 reporter in cultured hepatocytes revealed that PA blocked the fusion of autophagosomes with lysosomes. PA triggered MLKL expression and translocation, first to autophagosomes and then to the plasma membrane, independently of Rip3. Mlkl, but not Rip3, deficiency prevented inhibition of autophagy in PA-treated hepatocytes. Overexpression of Mlkl blocked autophagy independently of PA. Additionally, pharmacologic inhibition of autophagy induced MLKL expression and translocation to the plasma membrane in hepatocytes.

Conclusions: Taken together, these data indicate that MLKL-dependent, but RIP3-independent, signaling contributes to FFC diet-induced liver injury by inhibiting autophagy.

Lay summary: Autophagy is a regulated process that maintains cellular homeostasis. Impaired autophagy contributes to cell injury and death, thus playing a critical role in the pathogenesis of a number of diseases, including non-alcohol-associated fatty liver and steatohepatitis. Herein, we show that Mlkl-dependent, but Rip3-independent, signaling contributed to diet-induced liver injury and inflammatory responses by inhibiting autophagy. These data identify a novel co-regulatory mechanism between necroptotic and autophagic signaling pathways in non-alcoholic fatty liver disease.

Keywords: Autophagic flux; MLKL; NAFLD; NASH; Necroptosis; RIPK3.


Conflict of interest statement

Conflict of interest The authors declare no conflicts of interest that pertain to this work. Please refer to the accompanying ICMJE disclosure forms for further details.

Figures

Fig. 1.
Fig. 1.. Differential role of Rip3 and Mlkl deficiency on FFC diet-induced liver injury, steatosis, inflammatory response and hepatocyte apoptosis.
Rip3+/+, Rip3/, Mlkl+/+ and Mlkl/ mice were allowed free access to FFC or chow diet for 12 weeks. Body weight, ALT and AST concentration in plasma, hepatic triglyceride content in whole liver homogenate and M30 positive cells (total number of cells per 10× frame) in formalin-fixed paraffin-embedded sections of liver from (A) Rip3+/+ and Rip3/ and (B) Mlkl+/+ and Mlkl/ littermates. Images of M30 are shown in Fig. S2. N.D.: M30-positive cells were not detectable in livers from chow-fed mice. H&E staining of livers from (C) Rip3+/+ and Rip3/ and (D) Mlkl+/+ and Mlkl/ mice on FFC or chow diet. Images were acquired at 10× magnification. Expression of mRNA for pro-inflammatory cytokines, chemokine and macrophage markers was detected in livers from (E) Rip3+/+ and Rip3/ and (F) Mlkl+/+ and Mlkl/ littermates using qRT-PCR and normalized to 18S rRNA. Values represent means ± SEM. Values with different superscripts are significantly different from each other, n = 3–6 per group. p <0.05, assessed by ANOVA. ALT, alanine aminotransferase; AST, aspartate aminotransferase; FFC, high-fat, high-fructose, high-cholesterol; qRT-PCR, quantitative reverse transcription PCR.
Fig. 2.
Fig. 2.. MLKL expression, phosphorylation and oligomerization in livers of FFC diet fed mice.
Expression of Mlkl mRNA in livers from (A) Rip3+/+ and Rip3/ and (B) Mlkl+/+ and Mlkl/ mice was assessed by qRT-PCR and normalized to 18S rRNA. MLKL and RIP3 protein in liver lysates from (C) Rip3+/+ and Rip3/ and (D) Mlkl+/+ and Mlkl/ mice was assessed by western blot and normalized to b-actin. Liver lysates were isolated from Rip3/ mice on chow or FFC diet as a negative control for the RIP3 antibody. (E) Paraffin-embedded livers were de-paraffinized followed by phospho-MLKL staining. Images were acquired using a 10× objective. Representative images are shown (C–E). Values represent means ± SEM. Values with different superscripts are significantly different from each other, n = 3–6 per group, p <0.05, assessed by ANOVA. (F) Plasma membranes and (G) subcellular fractions (cytosol, P10: 10,000 g pellet) were isolated from liver tissues, resolved by non-reducing PAGE and probed with antibody to MLKL. A longer exposure of the PM fraction is shown in panel G. Images are representative on n = 3 isolations. FFC, high-fat, high-fructose, high-cholesterol; PM, plasma membrane; qRT-PCR, quantitative reverse transcription PCR.
Fig. 3.
Fig. 3.. PA-mediated MLKL translocation to the cell surface and caspase-independent cell death.
(A) AML12 and (B) primary hepatocytes isolated from C57BL/6J, Rip3/, and Mlkl/ mice were exposed to 500 lM PA for 16 h. Colocalization of MLKL and Alexa Fluor-labeled phalloidin, which stains plasma membrane-associated F-actin, was examined by confocal microscopy. (C,D) Sytox Green nucleic acid staining was used to determine cell death by Incucyte live imaging analysis and quantification. (C) AML12 hepatocytes were pre-treated or not with Z-VAD and then challenged with PA or BSA (Vehicle) for 16 h. (D) AML12 hepatocytes were transfected with scrambled siRNA or siRNA targeted to knock-down Mlkl. 24 h after transfection, cells were pre-treated with z-VAD and challenged with or without PA for 16 h. All images were obtained using a 10× objective. Representative images are shown. Values represent means ± SEM. Values with different superscripts are significantly different from each other, n = 4, p <0.05, assessed by t test (group = 2) or ANOVA (group ≥3). PA, palmitic acid; siRNA, small-interfering RNA.
Fig. 4.
Fig. 4.. Subcellular localization of MLKL in primary hepatocytes and AML12 hepatocytes in response to PA.
(A) AML12 hepatocytes were exposed to PA for different time intervals. Colocalization of MLKL and phalloidin was examined by confocal microscopy. Expression of MLKL protein in (B) AML12 or (C) primary hepatocytes isolated from C57BL/6J, Rip3/, and Mlkl/ mice was assessed by western blot and normalized to HSC70. (D) Primary hepatocytes isolated from C57BL/6J mice were treated with PA for 8 h. Subcellular colocalization of MLKL with mitochondria, lysosomes, early endosomes, late endosomes and Golgi was examined by confocal microscopy. (E) Primary hepatocytes from C57BL/6J, Rip3/ and Mlkl/ mice and (F) AML12 hepatocytes were treated with PA for 8 h or 16 h. Colocalization of MLKL and mature autophagosomes (LC3) was examined by confocal microscopy. All images were obtained using a 40× objective (Zoom 4). Representative images are shown. Values represent means ± SEM. Values with different superscripts are significantly different from each other, n = 3–5, p <0.05, assessed by ANOVA. PA, palmitic acid.
Fig. 5.
Fig. 5.. Mlkl deficiency protected mice from FFC diet- and leupeptin-induced accumulation of p62 and LC3II and ER stress.
(A) Autophagy markers including p62 and LC3-II protein in liver lysates were assessed by western blot and (B) normalized to HSC70. (C) Expression of mRNA for ER stress markers including Chop, Dr5, sXbp1, Bip and Atf4 genes in the liver was assessed by qRT-PCR and normalized to 18S rRNA. (D) Phospho-eIF2a and CHOP protein in liver lysates was assessed by western blot and (E) normalized to b-actin. Values represent means ± SEM. Values with different superscripts are significantly different from each other, n = 3–5, p <0.05, assessed by ANOVA. ER, endoplasmic reticulum; FFC, high-fat, high-fructose, high-cholesterol; qRT-PCR, quantitative reverse transcription PCR.
Fig. 6.
Fig. 6.. Inhibition of autophagy PA-treated hepatocytes.
(A) AML12 hepatocytes were exposed to PA for 4–8 h in the presence or absence of BafA. p62 and LC3-II protein in liver lysates was assessed by western blot and normalized to HSC70. (B) Schematic of the different possible outcomes for the mRFP-GFP-LC3 autophagic flux reporter. (C) Confocal analysis and (D) quantification of AML12 cells infected with mRFP-GFP-LC3. Cells were then treated with PA, CQ or Rapa. (E) Primary hepatocytes isolated from C57BL/6J, Rip3/ and Mlkl/ mice were transduced with mRFP-GFP-LC3 and then exposed to PA for 8 h or 16 h. (E) Confocal analysis and (F) quantification of LC3 reporter. All images were obtained using a 40× objective (Zoom 4). (G) p62 and LC3-II protein in lysates of primary hepatocytes was assessed by western blot and normalized to b-actin. Values represent means ± SEM. Values with different superscripts are significantly different from each other within the same color bars, n = 3–5, p <0.05, assessed by t test (group = 2) or ANOVA (group≥3). BafA, Bafilomycin A1; CQ, chloroquine; PA, palmitic acid; Rapa, rapamycin.
Fig. 7.
Fig. 7.. Inhibition of autophagic flux by PA in hepatocytes was dependent on MLKL.
AML12 hepatocytes were transduced with mRFP-GFP-LC3 and transfected with scrambled siRNA or Mlkl siRNA empty vector or Mlkl overexpression plasmid. LC3 localization was visualized by confocal microscopy (A,B) and quantified (C,D). All images were obtained using a 40× objective (Zoom 4). (E,F) p62 and LC3-II protein in cell lysates was assessed by western blot and normalized to HSC70. Values represent means ± SEM. Values with different superscripts are significantly different from each other within the same color bars, n = 3, p <0.05, assessed by t test (group = 2) or ANOVA (group ≥3). PA, palmitic acid; siRNA, small-interfering RNA.
Fig. 8.
Fig. 8.. Interrelationship between autophagy and MLKL expression.
(A,B) AML12 hepatocytes were treated with CQ or Rapa for 24 h. (A) Expression of MLKL protein in cell lysates was assessed by western blot and normalized to b-actin. (B) Colocalization of MLKL and phalloidin in AML12 hepatocytes was examined by confocal microscopy. (C) Primary hepatocytes isolated from C57BL/6J and Mlkl/ mice were transduced with mRFP-GFP-LC3 and exposed to CQ. Yellow and red fluorescent puncta were visualized by confocal microscopy and quantified. All images were obtained using a 40× objective (Zoom 4). (D,E) Mlkl/ mice and their littermates were intraperitoneally injected with leupeptin (L) or saline (S) 4 h prior to euthanasia. MLKL protein (D) as well as accumulation of p62 and LC3-II (E) in liver lysates was assessed by western blot and normalized to b-actin. Representative images are shown. Values represent means ± SEM. Values with different superscripts are significantly different from each other, n = 3, p <0.05, assessed by t test (group = 2) or ANOVA (group ≥3). CQ, chloroquine; Rapa, rapamycin.

References

    1. Gudipaty SA, Conner CM, Rosenblatt J, Montell DJ. Unconventional ways to live and die: cell death and survival in development, homeostasis, and disease. Annu Rev Cell Dev Biol 2018;34:311–332. - PMC - PubMed
    1. Brenner C, Galluzzi L, Kepp O, Kroemer G. Decoding cell death signals in liver inflammation. J Hepatol 2013;59:583–594. - PubMed
    1. Wang L, Du F, Wang X. TNF-alpha induces two distinct caspase-8 activation pathways. Cell 2008;133:693–703. - PubMed
    1. Brenner D, Blaser H, Mak TW. Regulation of tumour necrosis factor signalling: live or let die. Nat Rev Immunol 2015;15:362–374. - PubMed
    1. Hatting M, Zhao G, Schumacher F, Sellge G, Al Masaoudi M, Gabetaler N, et al. Hepatocyte caspase-8 is an essential modulator of steatohepatitis in rodents. Hepatology (Baltimore, Md) 2013;57:2189–2201. - PubMed

Publication types

MeSH terms