Observational Study
. 2020 Jul 15;26(14):3682-3693.
doi: 10.1158/1078-0432.CCR-19-2563. Epub 2020 Mar 27.

Whole-Exome Sequencing Analysis of the Progression from Non-Low-Grade Ductal Carcinoma In Situ to Invasive Ductal Carcinoma

Affiliations
Observational Study

Whole-Exome Sequencing Analysis of the Progression from Non-Low-Grade Ductal Carcinoma In Situ to Invasive Ductal Carcinoma

Fresia Pareja et al. Clin Cancer Res. .

Abstract

Purpose: Ductal carcinoma in situ (DCIS) is a nonobligate precursor of invasive breast cancer. Here, we sought to investigate the level of intralesion genetic heterogeneity in DCIS and the patterns of clonal architecture changes in the progression from DCIS to invasive disease.

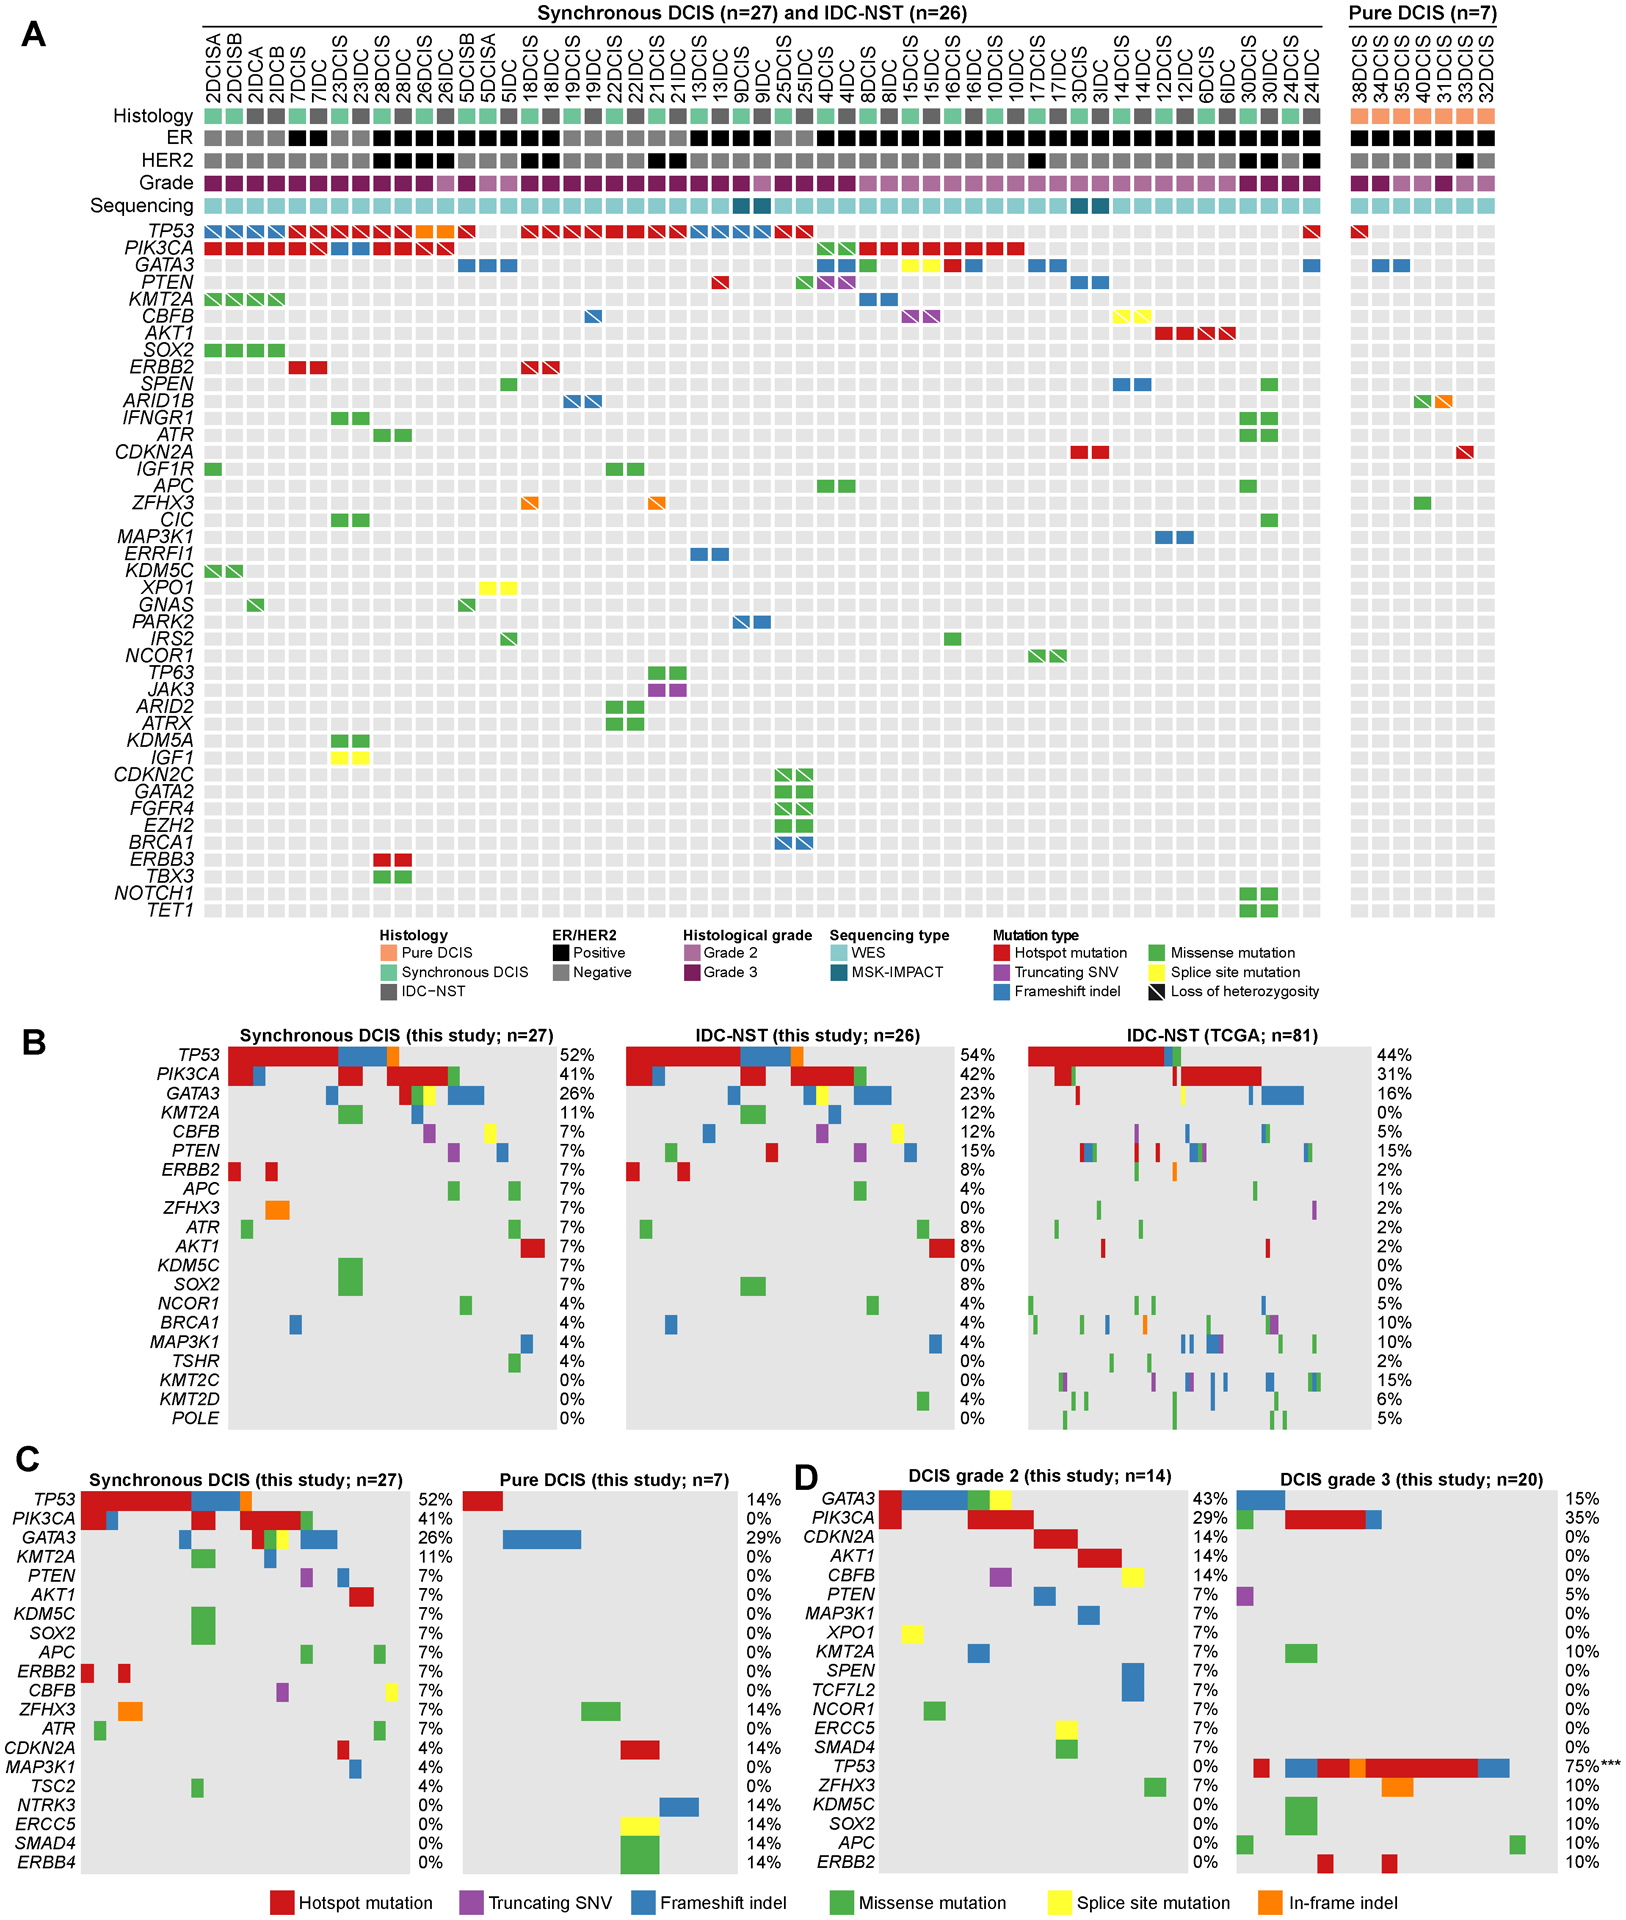
Experimental design: Synchronous DCIS (n = 27) and invasive ductal carcinomas of no special type (IDC-NSTs; n = 26) from 25 patients, and pure DCIS (n = 7) from 7 patients were microdissected separately and subjected to high-depth whole-exome (n = 56) or massively parallel sequencing targeting ≥410 key cancer-related genes (n = 4). Somatic genetic alterations, mutational signatures, clonal composition, and phylogenetic analyses were defined using validated computational methods.

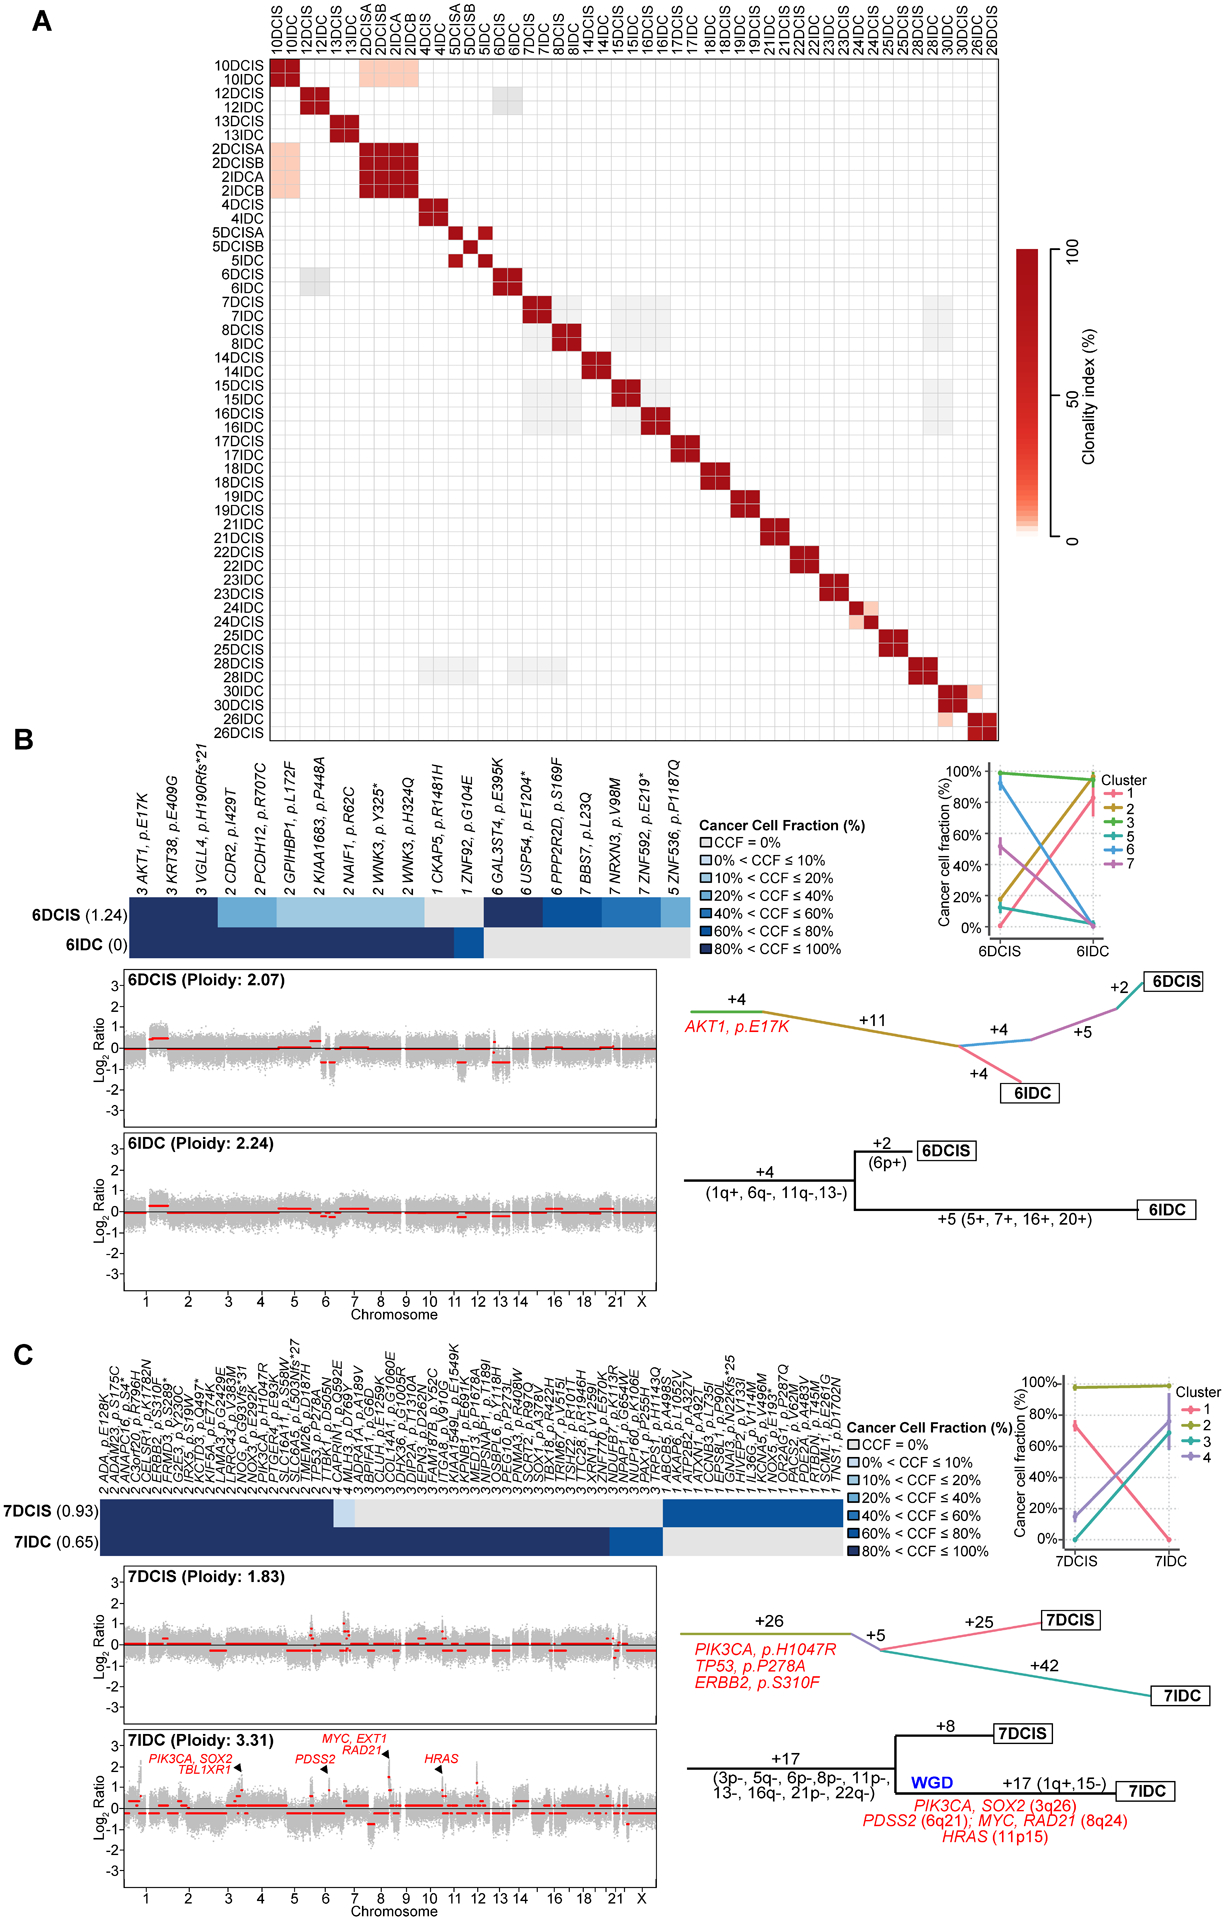
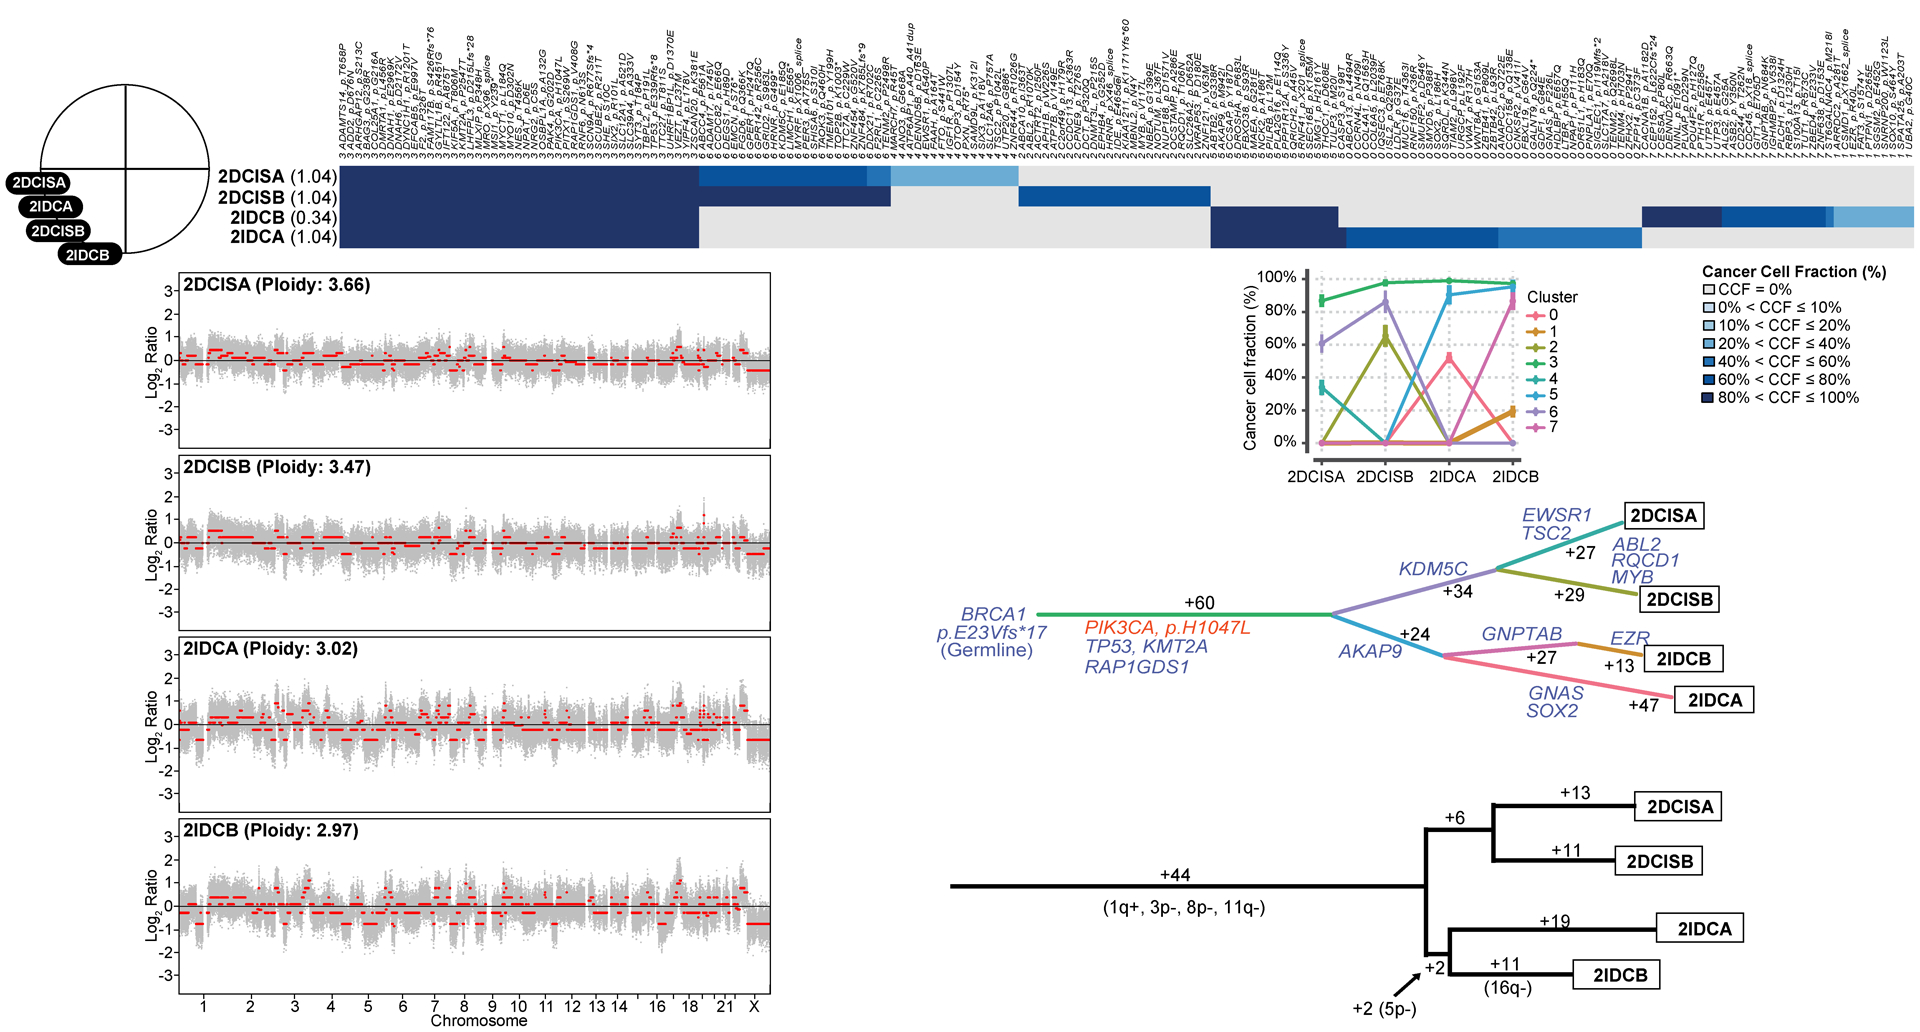
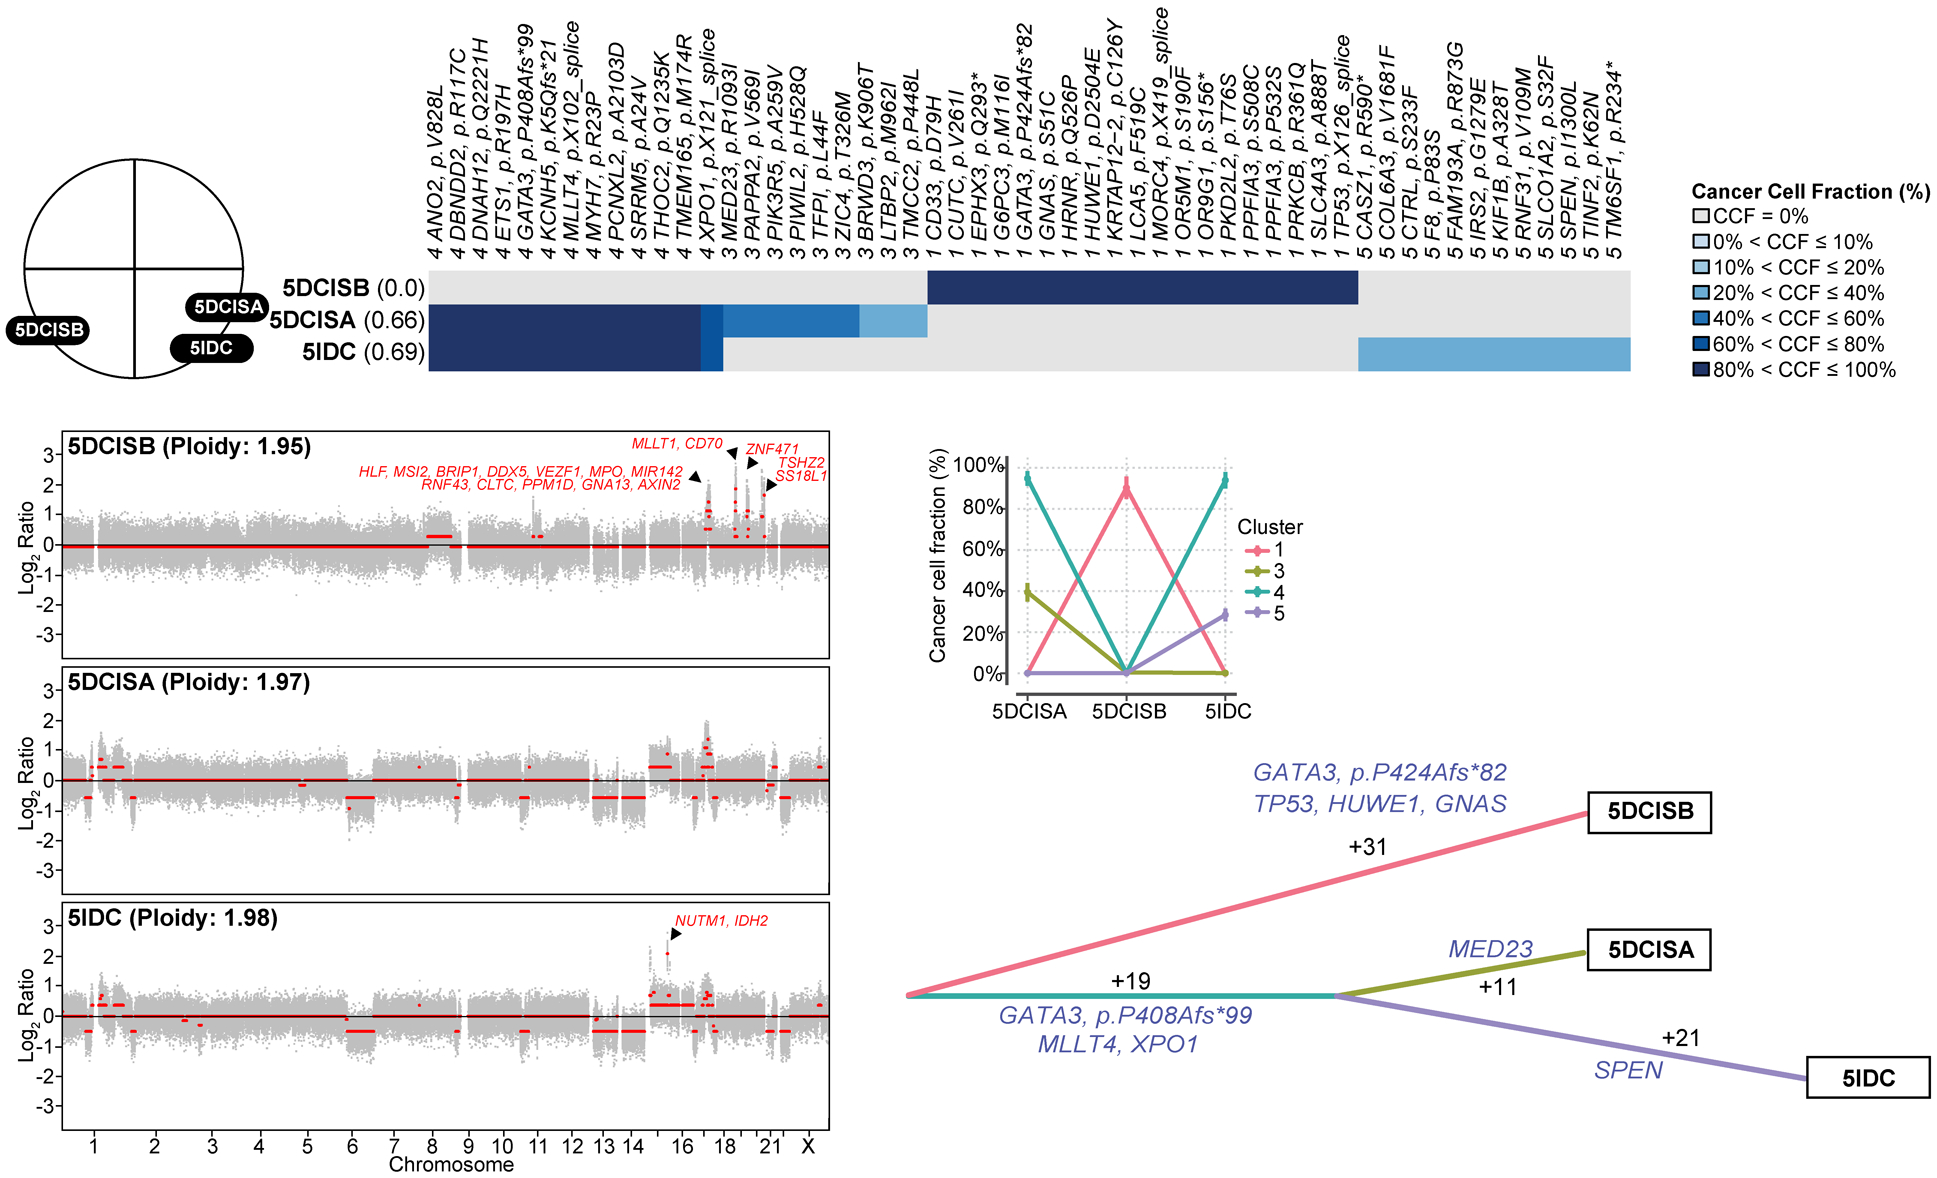
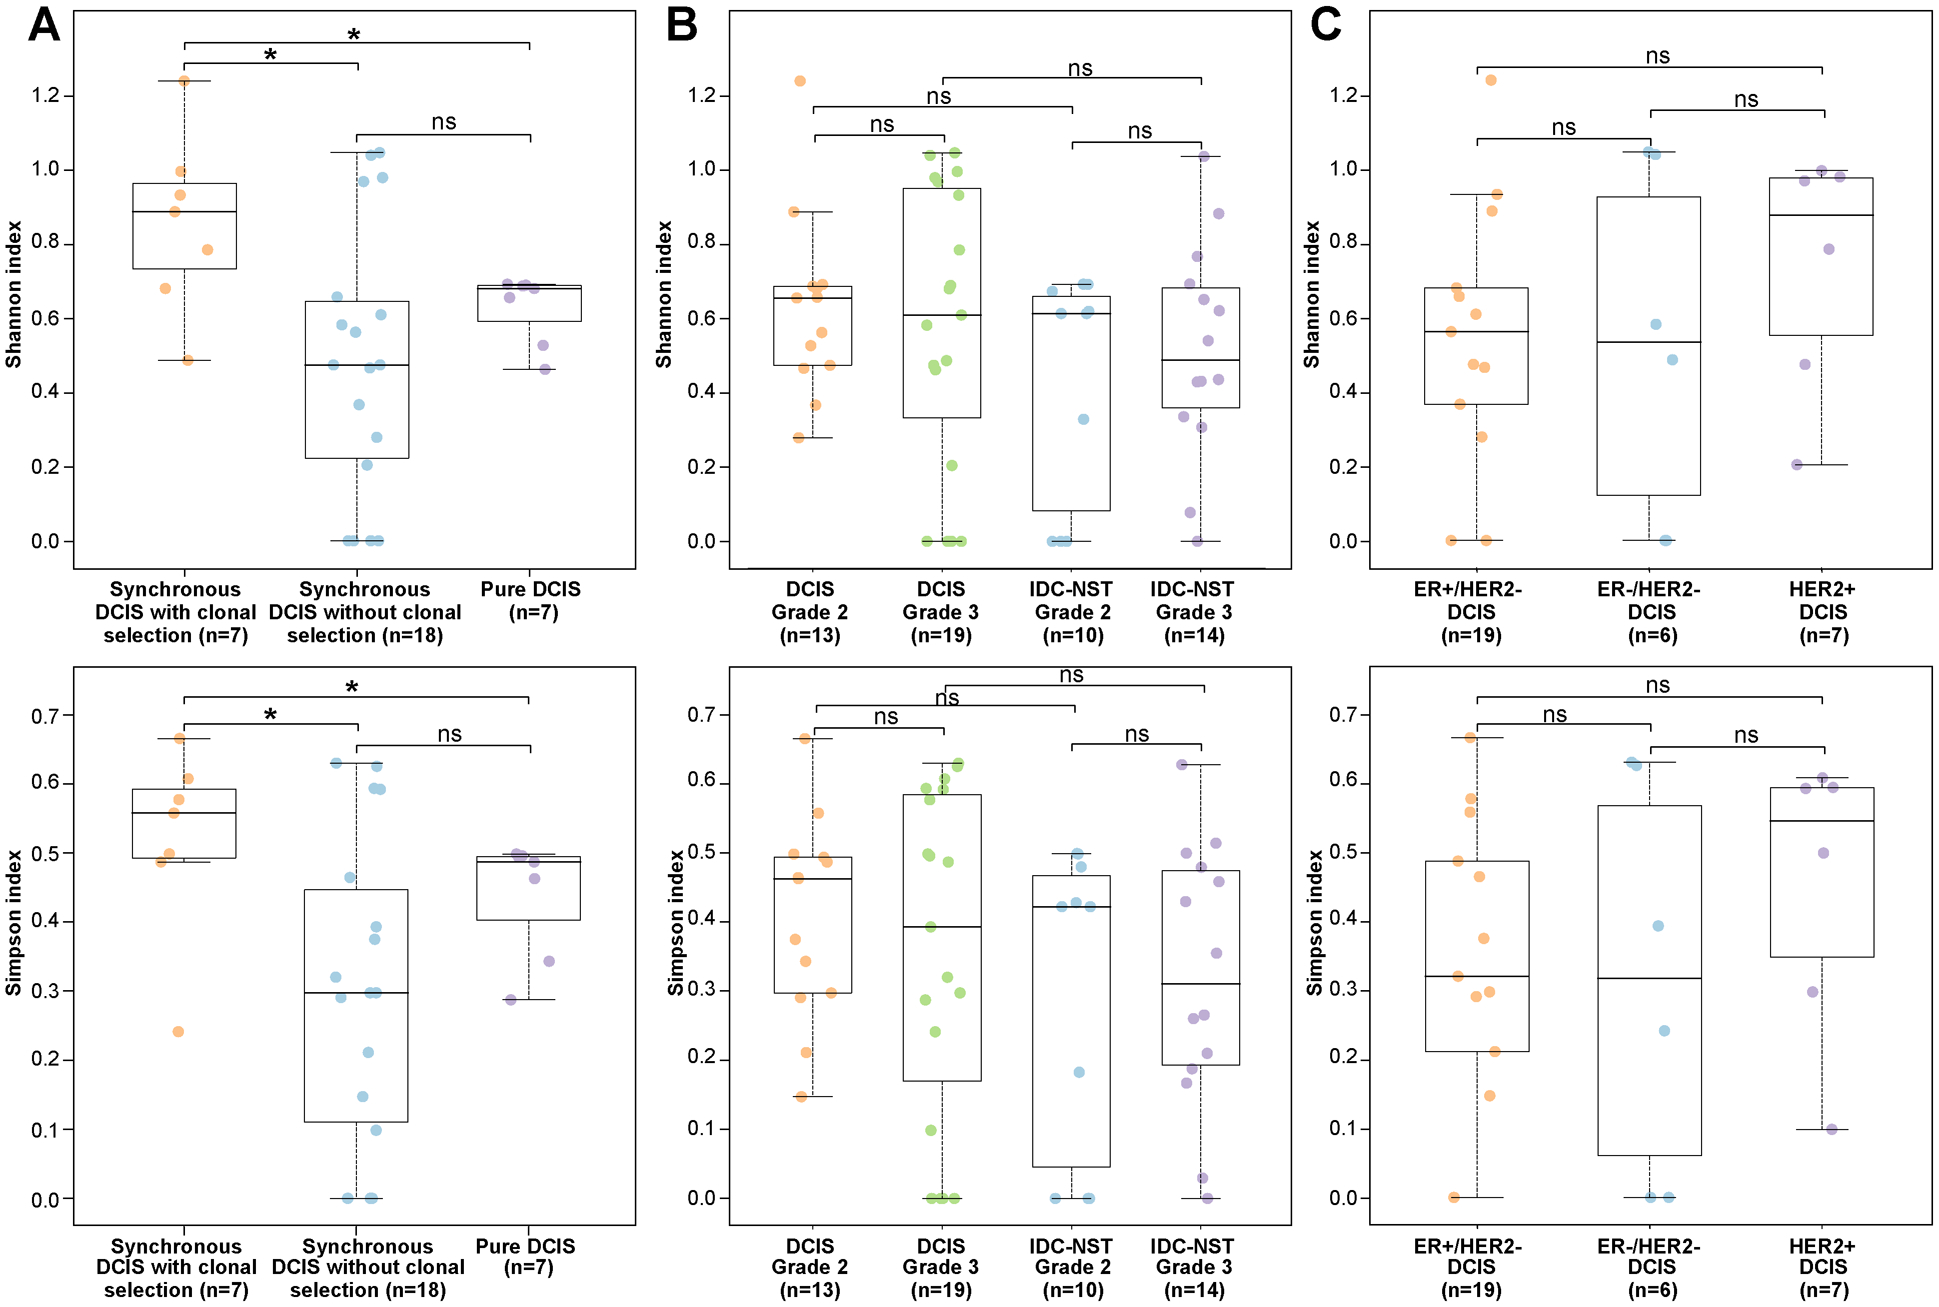
Results: DCIS revealed genetic alterations similar to those of synchronously diagnosed IDC-NSTs and of non-related IDC-NSTs from The Cancer Genome Atlas (TCGA), whereas pure DCIS lacked PIK3CA mutations. Clonal decomposition and phylogenetic analyses based on somatic mutations and copy number alterations revealed that the mechanisms of progression of DCIS to invasive carcinoma are diverse, and that clonal selection might have constituted the mechanism of progression from DCIS to invasive disease in 28% (7/25) of patients. DCIS displaying a pattern of clonal selection in the progression to invasive cancer harbored higher levels of intralesion genetic heterogeneity than DCIS where no clonal selection was observed.

Conclusions: Intralesion genetic heterogeneity is a common feature in DCIS synchronously diagnosed with IDC-NST. DCIS is a nonobligate precursor of IDC-NST, whose mechanisms of progression to invasive breast cancer are diverse and vary from case to case.


Conflict of interest statement

CONFLICTS OF INTEREST

JSR-F reports personal/consultancy fees from VolitionRx, Page.AI, Goldman Sachs, Grail, REPARE Therapeutics, Ventana Medical Systems, InVicro, Roche Diagnostics and Genentech, outside the scope of the submitted work. All other authors declare no conflicts of interest.

Figures

Figure 1.
Figure 1.. Repertoire of non-synonymous somatic mutations in ductal carcinoma in situ, synchronously diagnosed invasive ductal carcinomas of no special type and pure ductal carcinoma in situ, and comparison with invasive carcinomas from The Cancer Genome Atlas breast cancer study.
(A) Recurrent (n≥2) non-synonymous somatic mutations affecting cancer genes identified in synchronously diagnosed ductal carcinoma in situ (DCIS, n=27), their corresponding invasive ductal carcinomas of no special type (IDC-NST, n=26) and pure DCIS (n=7) by whole-exome sequencing or targeted capture massive parallel sequencing using MSK-IMPACT. Cases are shown in columns and genes in rows. Clinicopathologic characteristics are shown on the top. Mutations are color coded according to the legend. (B-D) Comparison of the most frequently mutated cancer genes identified in (B) DCIS synchronously diagnosed with invasive carcinoma (n=27), their corresponding IDC-NSTs (n=26) and non-related IDC-NSTs from The Cancer Genome Atlas (TCGA) matched according to age, menopausal status and ER/HER2 receptor status (n=81). (C) DCIS synchronously diagnosed with invasive carcinoma (n=27) and pure DCIS (n=7), (D) Grade 2 DCIS (n=14) and grade 3 DCIS (n=20). Two-sided Fisher’s exact test following multiple testing correction. ***, P<0.001. ER, estrogen receptor; DCIS, ductal carcinoma in situ; IDC-NST, invasive ductal carcinoma of no special type; indel, insertion and deletion; SNV, single nucleotide variant; WES, whole-exome sequencing.
Figure 2:
Figure 2:. Clonal relatedness, clonal decomposition and phylogenetic analysis of synchronously diagnosed ductal carcinoma in situ and invasive breast cancers.
(A) Pairwise comparison of the clonality index (CI) based on somatic mutations identified in synchronous ductal carcinoma in situ (DCIS) and invasive ductal carcinoma of no special type (IDC-NST) by whole exome sequencing (WES). (B-C) Clonal decomposition and phylogenetic analysis of Case 6 (B) and Case 7 (C). Clonal frequency heatmaps of mutations in the DCIS and synchronous IDC-NST of a given case are shown (top), grouped by their clonal/subclonal structure (clusters) as inferred by PyClone. Cancer cell fractions are color-coded according to the legend. Shannon index of intratumor heterogeneity is shown in parentheses to the left. PyClone parallel coordinates plots (top right) are shown. Copy number plots depicting segmented Log2 ratios (y-axis) according to genomic position (x-axis) of DCIS and IDC-NSTs are depicted (bottom left). PyClone-derived phylogenetic trees of synchronous DCIS and IDC-NST are shown (middle right). Trunk and branches are colored according to clusters as per PyClone, and the number of somatic mutations that result in the divergence of a clone/subclone from its ancestor is shown. Hotspot mutations (orange) that define a given clone are depicted. Phylogenetic trees based on copy number alterations are shown (bottom right). The numbers alongside the branches represent the number of copy number alterations. Gains and losses are shown in parentheses and genes included in amplifications are shown in red. WGD, whole genome duplication.
Figure 3:
Figure 3:. Clonal decomposition and phylogenetic analysis of synchronously identified multifocal ductal carcinoma in situ and invasive ductal carcinoma of no special type of Case 2.
Schematic representation of the anatomic location (breast quadrants) of the different samples analyzed (top left). Clonal frequency heatmap of mutations in the two foci of ductal carcinoma in situ (DCIS), 2DCISA and 2DCISB, and the two synchronously diagnosed foci of invasive ductal carcinoma of no special type (IDC-NST), 2IDCA and 2IDCB (top), grouped according to their clonal/subclonal structure (clusters) as inferred by PyClone. Cancer cell fractions are color-coded according to the legend. Shannon index of intratumor heterogeneity is shown in parentheses to the left. Parallel coordinates plots generated by PyClone are shown (top center). Copy number plots depicting segmented Log2 ratios (y-axis) plotted according to genomic position (x-axis) of DCIS and IDC-NSTs are depicted (bottom left). PyClone-derived phylogenetic trees of synchronous DCIS and IDC-NST are shown (middle center). Trunk and branches are colored according to clusters as per PyClone, and the number of somatic mutations that result in the divergence of a clone/subclone from its ancestor is shown. Cancer genes (blue) and hotspot mutations (orange) that define a given clone are depicted. A phylogenetic tree based on copy number alterations is shown (bottom right). The numbers alongside the branches represent the total number of copy number alterations. Gains and losses are shown in parentheses.
Figure 4:
Figure 4:. Clonal decomposition and phylogenetic analysis of synchronously identified multifocal ductal carcinoma in situ and invasive ductal carcinoma of no special type of Case 5.
Schematic representation of the anatomic location (breast quadrants) of the different samples analyzed (top left). Clonal frequency heatmap of mutations in the two foci of ductal carcinoma in situ (DCIS), 5DCISA and 5DCISB, and a synchronously diagnosed focus of invasive ductal carcinoma of no special type (IDC-NST), 5IDC, grouped by their clonal/subclonal structure (clusters) as inferred by PyClone (top). Cancer cell fractions are color-coded according to the legend. Shannon index of intratumor heterogeneity is shown in parentheses to the left. Parallel coordinates plots generated by PyClone are shown (middle center). Copy number plots depicting segmented Log2 ratios (y-axis) plotted according to their genomic positions (x-axis) of the DCIS and IDC-NSTs are depicted (bottom left). Genes included in amplifications are shown in red. PyClone-derived phylogenetic tree of synchronous DCIS and IDC-NST is shown (bottom right). Trunk and branches are colored according to clusters as per PyClone results, and the number of somatic mutations that result in the divergence of a clone/subclone from its ancestor are shown. Cancer genes (blue) that define a given clone are illustrated alongside the branches.
Figure 5:
Figure 5:. Intratumor genetic heterogeneity of ductal carcinoma in situ.
Boxplots depicting the Shannon diversity index (top) and the Gini-Simpson diversity index (bottom) (A) in ductal carcinoma in situ (DCIS) synchronously diagnosed with invasive carcinoma displaying a clonal selection evolutionary pattern (n=7), synchronous DCIS lacking evidence of clonal selection (n=18), and in pure DCIS (n=7), (B) in grade 2 (n=13) and grade 3 (n=19) DCIS, and grade 2 (n=10) and grade 3 (n=14) IDC-NST, (C) in ER-positive/HER2-negative DCIS (n=19), ER-negative/HER2-negative DCIS (n=6) and HER2-positive DCIS (n=7) subjected to whole-exome sequencing (WES). The median value of the Shannon diversity index and the Gini-Simpson diversity index, and the 75th and 25th percentiles are displayed at the top and bottom of the boxes, respectively. Each dot corresponds to the Shannon or Gini-Simpson diversity index of one case. Mann-Whitney U test two-sided P values. *, P<0.05

References

    1. Allred DC. Ductal carcinoma in situ: terminology, classification, and natural history. J Natl Cancer Inst Monogr 2010;2010(41):134–8. - PMC - PubMed
    1. D’Orsi CJ. Imaging for the diagnosis and management of ductal carcinoma in situ. J Natl Cancer Inst Monogr 2010;2010(41):214–7. - PMC - PubMed
    1. Lopez-Garcia MA, Geyer FC, Lacroix-Triki M, Marchio C, Reis-Filho JS. Breast cancer precursors revisited: molecular features and progression pathways. Histopathology 2010;57(2):171–92. - PubMed
    1. Hernandez L, Wilkerson PM, Lambros MB, Campion-Flora A, Rodrigues DN, Gauthier A, et al. Genomic and mutational profiling of ductal carcinomas in situ and matched adjacent invasive breast cancers reveals intra-tumour genetic heterogeneity and clonal selection. J Pathol 2012;227(1):42–52. - PMC - PubMed
    1. Vincent-Salomon A, Lucchesi C, Gruel N, Raynal V, Pierron G, Goudefroye R, et al. Integrated genomic and transcriptomic analysis of ductal carcinoma in situ of the breast. Clin Cancer Res 2008;14(7):1956–65. - PubMed

Publication types

MeSH terms

Substances