. 2020 Jul 1;26(13):3307-3318.
doi: 10.1158/1078-0432.CCR-19-3519. Epub 2020 Mar 27.

Constitutive Activation of RAS/MAPK Pathway Cooperates with Trisomy 21 and Is Therapeutically Exploitable in Down Syndrome B-cell Leukemia

Affiliations

Constitutive Activation of RAS/MAPK Pathway Cooperates with Trisomy 21 and Is Therapeutically Exploitable in Down Syndrome B-cell Leukemia

Anouchka P Laurent et al. Clin Cancer Res. .

Abstract

Purpose: Children with Down syndrome (constitutive trisomy 21) that develop acute lymphoblastic leukemia (DS-ALL) have a 3-fold increased likelihood of treatment-related mortality coupled with a higher cumulative incidence of relapse, compared with other children with B-cell acute lymphoblastic leukemia (B-ALL). This highlights the lack of suitable treatment for Down syndrome children with B-ALL.

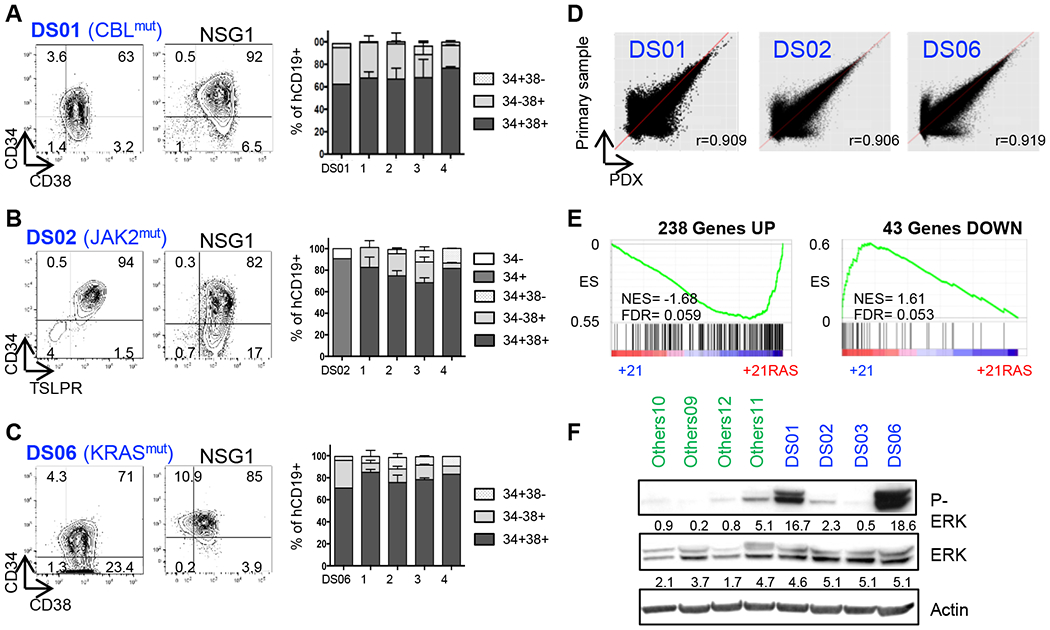
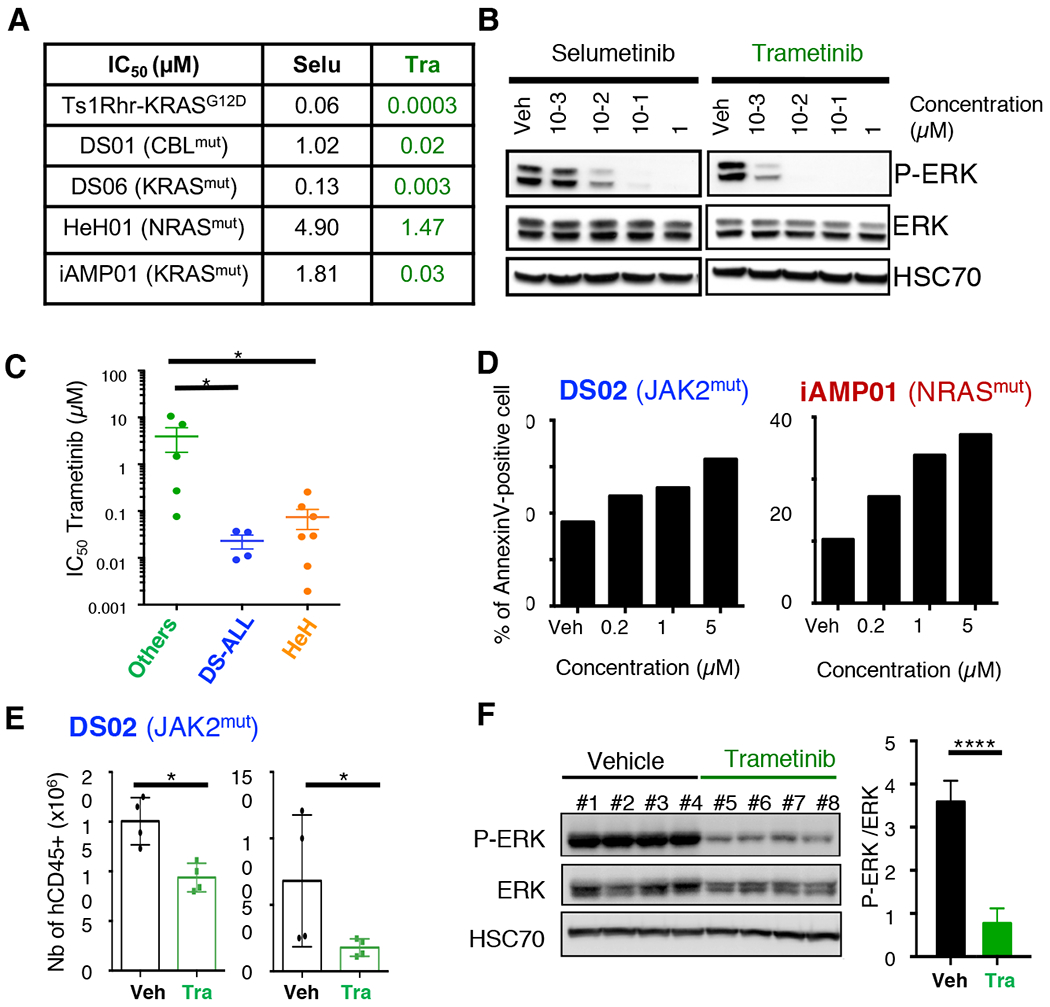
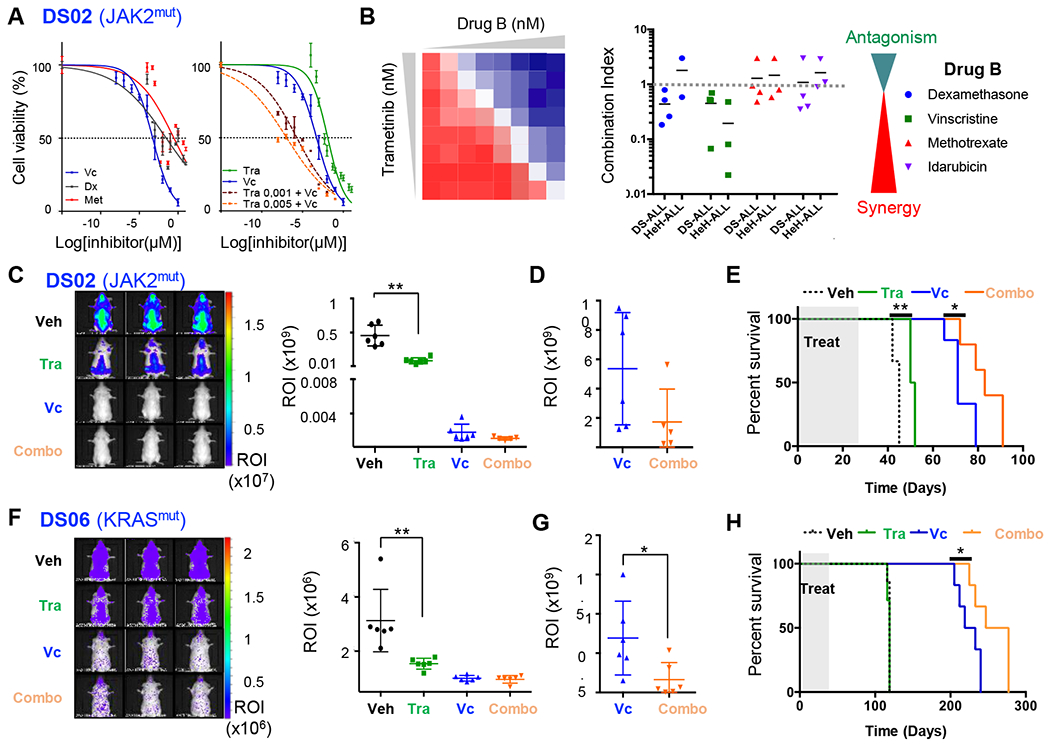
Experimental design: To facilitate the translation of new therapeutic agents into clinical trials, we built the first preclinical cohort of patient-derived xenograft (PDX) models of DS-ALL, comprehensively characterized at the genetic and transcriptomic levels, and have proven its suitability for preclinical studies by assessing the efficacy of drug combination between the MEK inhibitor trametinib and conventional chemotherapy agents.

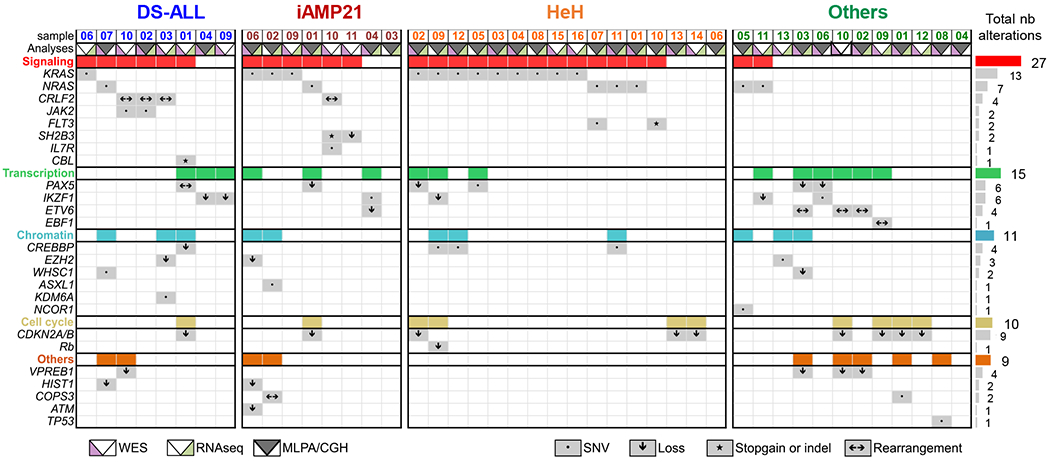
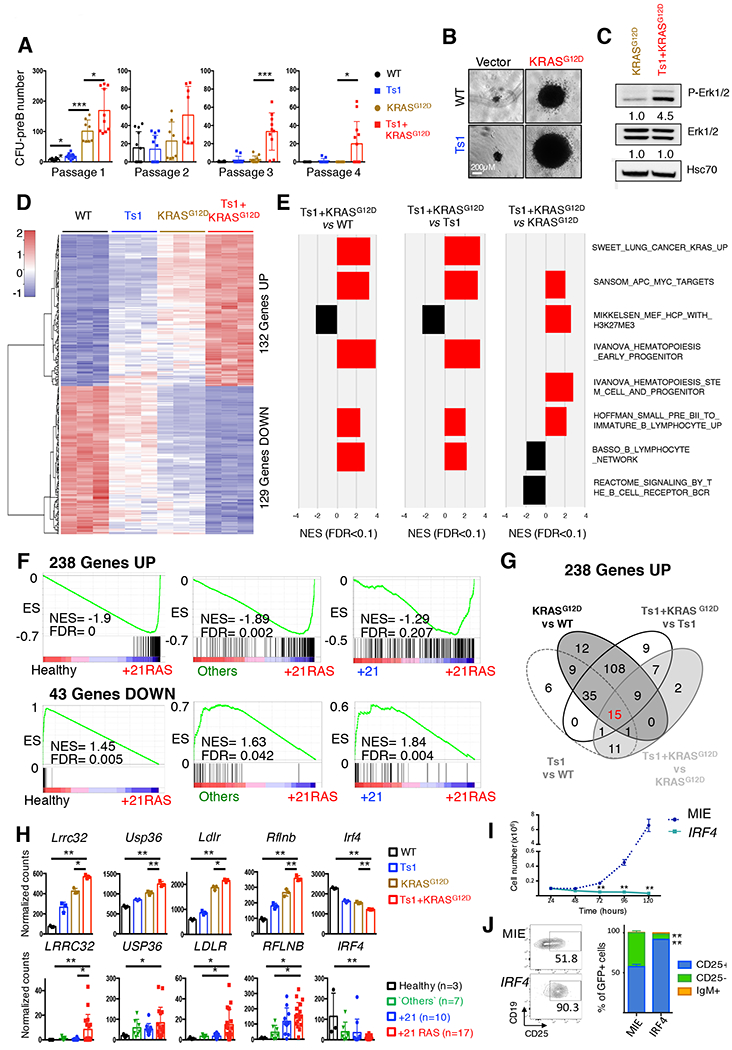
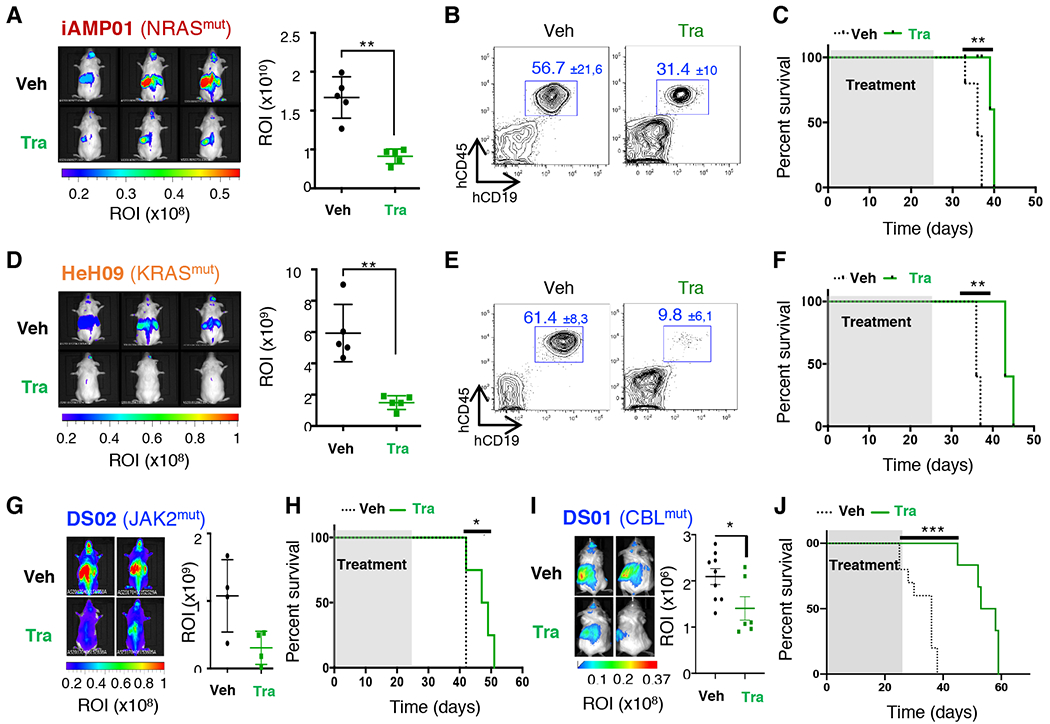
Results: Whole-exome and RNA-sequencing experiments revealed a high incidence of somatic alterations leading to RAS/MAPK pathway activation in our cohort of DS-ALL, as well as in other pediatric B-ALL presenting somatic gain of the chromosome 21 (B-ALL+21). In murine and human B-cell precursors, activated KRASG12D functionally cooperates with trisomy 21 to deregulate transcriptional networks that promote increased proliferation and self renewal, as well as B-cell differentiation blockade. Moreover, we revealed that inhibition of RAS/MAPK pathway activation using the MEK1/2 inhibitor trametinib decreased leukemia burden in several PDX models of B-ALL+21, and enhanced survival of DS-ALL PDX in combination with conventional chemotherapy agents such as vincristine.

Conclusions: Altogether, using novel and suitable PDX models, this study indicates that RAS/MAPK pathway inhibition represents a promising strategy to improve the outcome of Down syndrome children with B-cell precursor leukemia.


Conflict of interest statement

Conflict of Interest

JDC receives research support from Forma Therapeutics and Scholar Rock, is a consultant for Sierra Oncology, and the Scientific Advisor of the MPN Research Foundation. The other authors declare no conflict of interest.

Figures

Figure 1:
Figure 1:. Mutational landscape of B-cell Acute Lymphoblastic Leukemia with gain of chromosome 21 (B-ALL+21).
A. Table summarizing selected somatic ‘driver’ alterations obtained from WES, RNAseq and MLPA/CGH assays in our B-ALL cohort: Down syndrome (DS-ALL, n=8), intrachromosomal amplification of the chromosome 21 (iAMP21, n=8), high hyperdiploid (HeH, n=16) and the ‘Others’ subgroup (n=12), see also Supplemental Table 1. Grey boxes represent the presence of a somatic alteration and the symbols specify the type of alteration (SNVs, gains, losses, Indels or rearrangements). The colored boxes (red, green, blue, yellow and orange) integrate all alterations found within the functional subgroups: signaling, transcription, chromatin, cell cycle and others.
Figure 2:
Figure 2:. Functional cooperation between constitutive trisomy 21 and KRASG12D.
A. Number of CFU-preB colonies obtained per genotype (wild-type: WT and Ts1Rhr: Ts1) transduced with retroviral particles encoding KRASG12D or empty vector across four passages (n=8–10 replicates from 3 independent experiments; *p<0.05, **p<0.01 and ***p<0.001). B. Representative picture of the CFU-preB colonies observed at passage 1 in WT, Ts1, KRASG12D and Ts1-KRASG12D (scale bars, 0.2 mm). C. Western blot assessing the constitutive phosphorylation of Erk1/2 in starved WT-KRASG12D and Ts1Rhr-KRASG12D cells. Quantifications of the band relative intensities are indicated. D. Heatmap representing the expression of the 261 genes commonly deregulated in the WT, Ts1, KRASG12D and Ts1+KRASG12D murine B cell progenitors CFU-preB (132 Upregulated and 129 downregulated genes), n= 3 replicates per condition. E. Gene set enrichment analyses (GSEA) of selected enriched datasets; all FDR < 0.1, see also Supplemental Figure 4 and Table 6. F. GSEA of the 238 upregulated and 43 downregulated genes across subgroups of human B-ALL contained in our cohort: Others, +21 (gain of chromosome 21, no RAS alterations) and +21RAS (gain of chromosome 21 with N/KRAS mutations). G. Venn diagram assessing the association of the 238 upregulated genes among the murine paired comparisons Ts1 vs WT, KRASG12D vs WT, Ts1+KRASG12D vs Ts1 and Ts1+KRASG12D vs KRASG12D. The same analysis was performed with the 43 downregulated genes, leading to the identification of 18 ‘cooperative’ genes (see Supplemental Table 7). H. Normalized expression of five selected ‘cooperative’ genes, commonly deregulated in murine CFU-preB colonies (WT, Ts1, KRASG12D, Ts1+KRASG12D, upper panel) and in human primary B-ALL samples (lower panel). *p<0.05 and **p<0.001. I. Growth of sorted GFP-positive Ts1+KRASG12D ectopically expressing IRF4 compared to empty vector (MIE). **p<0.001. J. Representative dot plots (left panel) and associated bar graphs (right panel, n=3) showing acquisition of CD25 surface marker in IRF4-overexpressing Ts1+KRASG12D cells (at 48h). **p<0.001.
Figure 3:
Figure 3:. Establishment of a comprehensive cohort of PDX B-ALL+21.
A-C. Left panel Representative flow cytometry analyses of the phenotypes of primary DS-ALL samples (DS01, DS02 and DS06) at diagnosis based on CD34, CD38, TSLPR and CD19 surface markers expression, and corresponding phenotypes from initial to NSG4 (right panel). D. Transcriptome correlation between primary DS01, DS02 and DS06 samples (Y-axis) and their corresponding PDXs (X-axis); r = Pearson correlation coefficient. E. GSEA assessing the enrichment of the 238 upregulated and 43 downregulated genes in B-ALL PDXs. F. Constitutive ERK1/2-phosphorylation assessed by Western blot of freshly harvested B-ALL PDX blasts starved overnight prior to protein extraction.
Figure 4:
Figure 4:. RAS/MAPK pathway inhibition decreases viability of B-ALL cells in vitro and leukemia burden in vivo.
A. Table comparing the IC50 values (μM) of Selumetinib (Selu) and Trametinib (Tra) in Ts1Rhr-KRASG12D cells and in four different B-ALL+21 PDX cells with constitutive RAS/MAPK pathway activation. B. Representative western blots assessing the efficacy of Selumetinib and Trametinib on ERK1/2 phosphorylation (P-ERK) on HeH02 PDX cells after 6h of treatment in vitro. C. Averaged IC50 values obtained in Others (n=5), DS-ALL (n=4) and HeH (n=7) PDX samples. *p=0.05. Regression curves used to calculate these IC50 values from several NSG recipients are represented in Supplemental Figure 6D. D. Histogram plots representing the percentage of Annexin-V positive DS02 and iAMP01 cells at 48h. E. Absolute number of human CD45-positive cells detected by flow cytometry in the bone marrow (left panel) and spleen (right panel) of DS02 recipient mice, at the end of a 4 weeks treatment with Trametinib (Tra, 1.5mg/kg, oral gavage). *p=0.05. F. Effect of Trametinib on ERK1/2 phosphorylation assessed by Western blot in flow sorted CD45/CD19 human DS02 cells at the end of the 4-weeks in vivo treatment (left panel); Intensities were normalized using HSC70 and ERK total protein (right panel). ****p<0.0001.
Figure 5:
Figure 5:. Trametinib treatment decreases leukemia progression in vivo.
A. Left panel: Whole-body bioluminescence images after 4 weeks of treatment of iAMP01 PDX model. Right Panel: Absolute quantification of ROI (photons/second/surface [p/s/cm2]) between both groups (n=5 mice per group). **p=0.008. B. Proportion of human CD45+CD19+ cells in the peripheral blood at the end of treatment (average percentages ± SD are indicated). C. Survival curves of the iAMP01 PDX model treated with vehicle (black) or Trametinib (1.5 mg/kg, green), (n=5 mice per group), **p=0.003. D-F. Efficacy of Trametinib in the HeH09 PDX model (n=5 mice per group), **p=0.0008 (in D), **p=0.002 (in F). G-H. Efficacy of Trametinib in the DS02 model (n=4 mice per group), *p=0.04. (in H). I-J. Efficacy of Trametinib in the DS01 model (n=6–9 mice per group), *p=0.04 (in I), ***p=0.0003 (in J).
Figure 6:
Figure 6:. Trametinib synergizes with Vincristine to increase survival of DS-ALL PDX.
A. Left panel: Dose-response curves of single agent treatment for Vincristine (Vc, blue), Dexamethasone (Dx, purple) and Methotrexate (Met, red) on DS02 PDX cells for 72h; Right panel: Dose-response curves assessing the combination of Vincristine with Trametinib (Tra) at 2 doses: 1 nM (brown) and 5 nM (orange), compared to Vc and Tra alone. B. Drug combination studies of Trametinib with Dexamethasone, Vincristine, Methotrexate and Idarubicin performed on DS-ALL (n=3–4 PDX) and HeH (n=2–3 PDX). Combination indices (CI) were calculated according to (34) and represented in the right panel with CI<1 = synergy and CI>1 = antagonism. C and F. Left panels: Representative whole-body bioluminescence images of luciferase-positive DS02 and DS06 PDXs at the end of the treatment with Trametinib (1.5 mg/kg) and/or Vincristine (0.5mg/kg). Right panels: Absolute quantification of bioluminescence in ROI (photons/second/surface [p/s/cm2]) during the last week of treatment (Day 24), *p<0.05; **p<0.01. D and G. End point measurement of ROI in DS02 (D, day 64) and DS06 (G, day 205). E and H. Survival curves obtained for DS02 (E) and DS06 (G) PDXs (n=5 to 7 mice per arm). *p<0.05; **p<0.01.

References

    1. Hasle H, Friedman JM, Olsen JH, Rasmussen SA. Low risk of solid tumors in persons with Down syndrome. Genet Med. 2016;18(11):1151–7. - PubMed
    1. Buitenkamp TD, Izraeli S, Zimmermann M, Forestier E, Heerema NA, van den Heuvel-Eibrink MM, et al. Acute lymphoblastic leukemia in children with Down syndrome: a retrospective analysis from the Ponte di Legno study group. Blood. 2014;123(1):70–7. - PMC - PubMed
    1. Ceppi F, Stephens D, den Hollander BS, Krueger J, Whitlock J, Sung L, et al. Clinical presentation and risk factors of serious infections in children with Down syndrome treated for acute lymphoblastic leukemia. Pediatr Blood Cancer. 2016;63(11):1949–53. - PubMed
    1. Forestier E, Izraeli S, Beverloo B, Haas O, Pession A, Michalova K, et al. Cytogenetic features of acute lymphoblastic and myeloid leukemias in pediatric patients with Down syndrome: an iBFM-SG study. Blood. 2008;111(3):1575–83. - PubMed
    1. Russell LJ, Capasso M, Vater I, Akasaka T, Bernard OA, Calasanz MJ, et al. Deregulated expression of cytokine receptor gene, CRLF2, is involved in lymphoid transformation in B-cell precursor acute lymphoblastic leukemia. Blood. 2009;114(13):2688–98. - PubMed

Publication types

MeSH terms