. 2020 Apr 7;117(14):8177-8186.
doi: 10.1073/pnas.1920632117. Epub 2020 Mar 27.

Myosin filament-based regulation of the dynamics of contraction in heart muscle

Affiliations

Myosin filament-based regulation of the dynamics of contraction in heart muscle

Elisabetta Brunello et al. Proc Natl Acad Sci U S A. .

Abstract

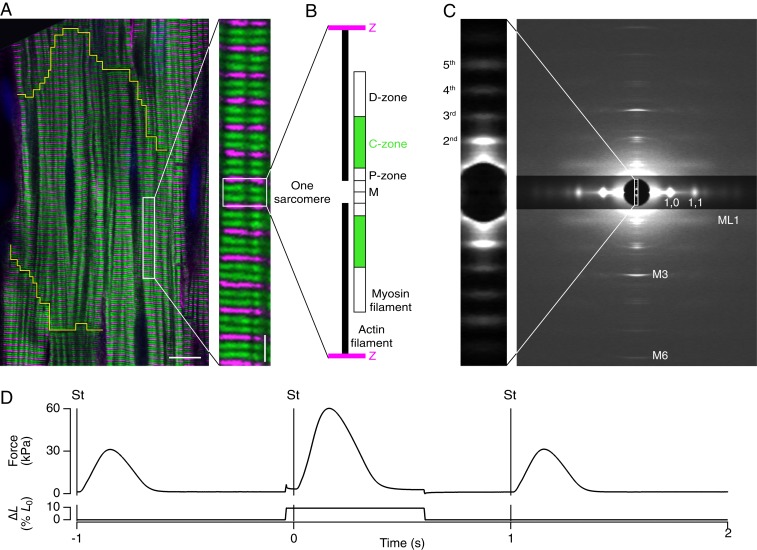
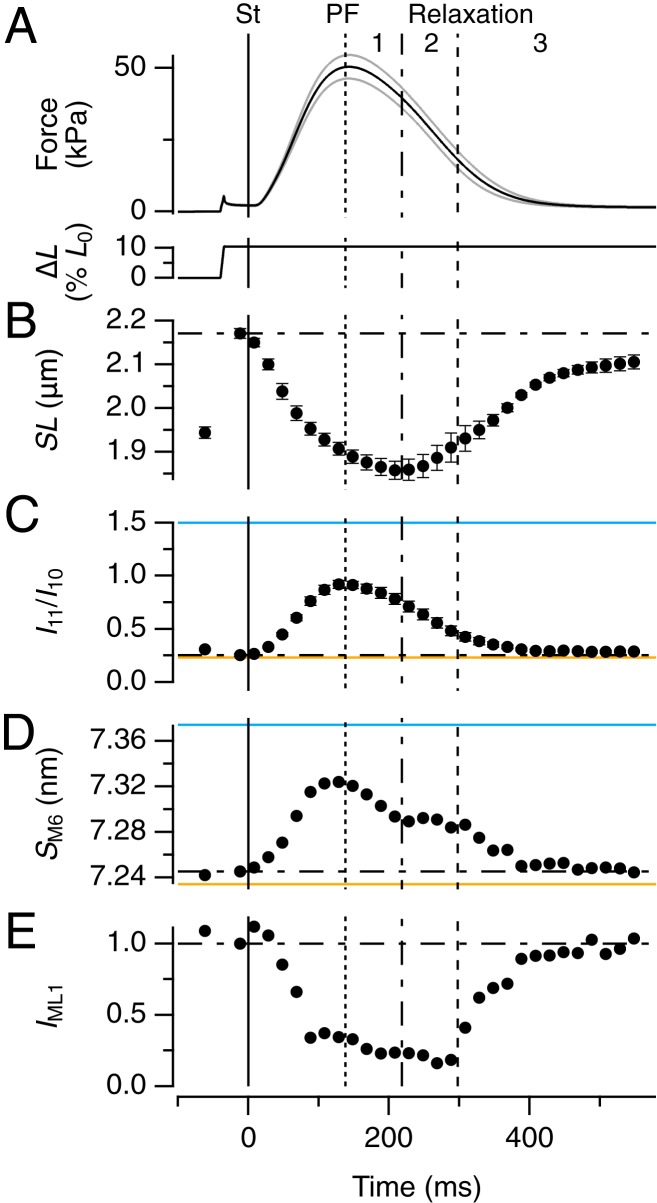
Myosin-based mechanisms are increasingly recognized as supplementing their better-known actin-based counterparts to control the strength and time course of contraction in both skeletal and heart muscle. Here we use synchrotron small-angle X-ray diffraction to determine the structural dynamics of local domains of the myosin filament during contraction of heart muscle. We show that, although myosin motors throughout the filament contribute to force development, only about 10% of the motors in each filament bear the peak force, and these are confined to the filament domain containing myosin binding protein-C, the "C-zone." Myosin motors in domains further from the filament midpoint are likely to be activated and inactivated first in each contraction. Inactivated myosin motors are folded against the filament core, and a subset of folded motors lie on the helical tracks described previously. These helically ordered motors are also likely to be confined to the C-zone, and the associated motor conformation reforms only slowly during relaxation. Myosin filament stress-sensing determines the strength and time course of contraction in conjunction with actin-based regulation. These results establish the fundamental roles of myosin filament domains and the associated motor conformations in controlling the strength and dynamics of contraction in heart muscle, enabling those structures to be targeted to develop new therapies for heart disease.

Keywords: heart muscle; muscle regulation; myosin motor; myosin-binding protein C.


Conflict of interest statement

The authors declare no competing interest.

Figures

Fig. 1.
Fig. 1.
Structural organization and X-ray diffraction from myosin filaments in beating cardiac trabeculae. (A) Confocal micrograph of a rat cardiac trabecula stained with anti–α-actinin (magenta) and anti–MyBP-C (green); cardiomyocyte boundary outlined in yellow. (Scale bar 10 μm; Inset, 2 μm.) (B) Organization of actin (black) and myosin filaments in one sarcomere repeat, indicating the MyBP-C–containing C-zone (green) and the proximal P- and distal D-zones (white); myosin filament midpoint, M; Z-band, Z (magenta). (C) Small-angle X-ray diffraction pattern from demembranated trabeculae in relaxing solution at SL 2.15 µm, 27 °C, showing meridional myosin-based reflections M1 to M6, the first myosin layer line (ML1), and the 1,0 and 1,1 equatorial reflections (digitally attenuated). Data added from four trabeculae; total exposure time, 160 ms; detector distance, 1.6 m. (Inset) Ultrasmall angle X-ray pattern showing the second-fifth order reflections from the sarcomere repeat; total exposure time, 60 ms; detector distance, 31 m. (D) Time course of force and length change as percentage of initial length (% L0). Trabeculae were stimulated (vertical line, St) continuously at 1 Hz at SL 1.95 µm, 27 °C. Once per minute trabeculae were stretched by 10% L0 in 5 ms, starting 40 ms before the stimulus. The original length was restored 600 ms after the stimulus.
Fig. 2.
Fig. 2.
Structural dynamics of myosin motors and filaments during the heartbeat. (A) Force and trabecular length change (ΔL, expressed as a percentage of initial length [L0]); vertical continuous line at t = 0 indicates the electrical stimulus (St). Vertical dotted, dot-dashed, and dashed lines indicate PF and the end of phase 1 and 2 of relaxation, respectively. Gray traces show ± SEM for force; n = 6 trabeculae. (BE) Changes in SL (B), ratio of equatorial intensities (I11/I10, C), spacing of M6 reflection (SM6, D) and intensity of ML1 reflection (IML1, E). Error bars in B and C are SEM for n = 6 trabeculae; data in D and E added from the same 6 trabeculae. Spatial calibration described in Materials and Methods. Horizontal dot-dashed lines indicate the value of each parameter before the stimulus. Horizontal continuous lines in C and D from two demembranated trabeculae in relaxation at [Ca2+] = 1 nM (orange) and during active isometric contraction at [Ca2+] = 20 µM (blue), force 95 kPa.
Fig. 3.
Fig. 3.
Fraction of myosin motors attached to actin at peak force. (A) Axial profiles of the first layer line from demembranated trabeculae in relaxing (pCa 7.0; magenta) and rigor (pCa 9.0, no ATP; orange) conditions. Data added from four trabeculae. FReLoN detector with sample-to-detector distance, 1.6 m. Total exposure time, 160 ms. Temperature, 27 °C. Black and red continuous lines, double-Gaussian global fits to the axial layer-line profiles, with positions of myosin-layer 1 (ML1) and actin-layer 1 (AL1) as common parameters (continuous vertical gray lines). Dot-dashed lines and dashed lines are Gaussian components of the global fits for ML1 and AL1, respectively. (B) Axial profiles of the first layer line from intact trabeculae in diastole (green) and at PF (blue). Data added from four time-frames in diastole and around PF. Pilatus detector, sample-to-detector distance, 3.2 m. Total exposure time, 230 ms. Temperature, 26.4 °C. Black and red continuous lines, double-Gaussian fits to the axial profiles with positions of ML1 and AL1 constrained to the vertical gray lines from fits in A. Dot-dashed lines and dashed lines as in A.
Fig. 4.
Fig. 4.
ATP hydrolysis per half-filament during force development and up to peak shortening. Force (black) and the number of ATPs hydrolyzed per half-filament (red), calculated as described in the main text from thermodynamic efficiency (red continuous line) or from the assumption that motors remain attached to actin over a 6-nm stroke (red dashed line), plotted against filament sliding (A) or time (B).
Fig. 5.
Fig. 5.
Determining the location of diffracting motors in the myosin filament by X-ray interference. The Left column (A, D, and G) shows the (red) ordered layers of myosin motors in each half-thick filament in the sarcomere that contribute to the M3 X-ray reflection and the (light gray) disordered layers that do not. Only one of every three layers of motors is shown for simplicity. The center-to-center distance between the ordered layers is the interference distance (ID, blue). The C-zones are shaded dark gray. The Center column (B, E, and H) shows the intensity distribution of the M3 reflection that would be produced by a single array of ordered motors in each half filament (red), the fringes (blue) produced by interference between the two arrays in each filament, and the product of the red and blue functions, the resulting M3 profile (black) for the parameter set specified in SI Appendix. The Right column (C, F, and I) shows corresponding experimental M3 profiles (black) fitted by multiple Gaussian functions for the lower (LA, orange), middle (MA, magenta), and higher (HA, green) angle peaks. Data in C and F added from six trabeculae, in I from two. The Top row (AC) is for intact trabeculae in diastole, the Middle row (DF) for intact trabeculae at peak force, and the Lower row (GI) for demembranated trabeculae at full calcium activation. Note that the calculated profiles (Center column) do not include the broadening due to the point-spread function of the camera/detector system in the experimental profiles (Right column), but this difference is avoided in the analysis presented in the text by Gaussian fitting both experimental and calculated profiles.
Fig. 6.
Fig. 6.
Determining the number of motors in standard conformations by X-ray interference. (A) Standard motor conformations: folded (F, purple), actin-attached (A, green), partner of an attached motor (P, yellow), and isotropic (I, gray). Toward filament midpoint, M; Z-band, Z. (BE) Time courses of M3 intensity (IM3, B) and spacing (SM3, C), and the fractional intensity (D) and spacing (E) of its three component peaks with color code as in Fig. 5C. Data added from six trabeculae. St, stimulus. Vertical lines as in Fig. 2. (Right Inset) Values from demembranated trabeculae in relaxation (triangles) and full activation (diamonds); note that the HA peak cannot be measured at pCa 4.7. Cyan lines denote results from the calculations described in the text for the following parameters: (F) Spacing of the myosin motors in the C-zone (SM3c). (G) Diffracting layers of myosin motors (red vertical bars) and their position in the myosin half-filament as shown in the Inset at Right. (H) Number of motors folded, actin-attached and isotropic per half-filament; color code as in A. (I) The folded motors in H resolved into the maximum number in the helical array (FH, dark pink) and the remainder nonhelical motors (FNH, light pink). (J) Force and trabecular length change reproduced from Fig. 2A for reference.
Fig. 7.
Fig. 7.
Myosin motor conformations and regulatory states of myosin filament zones during contraction. (Left) Motor conformations in the half-sarcomere in diastole: Folded and helically ordered (FH, dark pink), folded nonhelical (FNH, light pink), and isotropic (I, gray). MyBP-C (blue) may link to actin filaments or be associated with helical motors. (Right) Magnification of C- and D-zones at the times indicated by the circles on the force trace. St, stimulus. Actin-attached motors (A, green); partners of A motors (P, yellow). Regulatory state of the myosin filament backbone indicated as pink (more off) through orange to bright yellow (more on).

References

    1. Bers D. M., Cardiac excitation-contraction coupling. Nature 415, 198–205 (2002). - PubMed
    1. Reconditi M., et al. , Myosin filament activation in the heart is tuned to the mechanical task. Proc. Natl. Acad. Sci. U.S.A. 114, 3240–3245 (2017). - PMC - PubMed
    1. Solaro R. J., Multiplex kinase signaling modifies cardiac function at the level of sarcomeric proteins. J. Biol. Chem. 283, 26829–26833 (2008). - PMC - PubMed
    1. Stehle R., Iorga B., Kinetics of cardiac sarcomeric processes and rate-limiting steps in contraction and relaxation. J. Mol. Cell. Cardiol. 48, 843–850 (2010). - PubMed
    1. Fusi L., Brunello E., Yan Z., Irving M., Thick filament mechano-sensing is a calcium-independent regulatory mechanism in skeletal muscle. Nat. Commun. 7, 13281 (2016). - PMC - PubMed

Publication types