. 2020 Jul:60:56-65.
doi: 10.1016/j.ymben.2020.03.007. Epub 2020 Mar 25.

Systematic identification and elimination of flux bottlenecks in the aldehyde production pathway of Synechococcus elongatus PCC 7942

Affiliations

Systematic identification and elimination of flux bottlenecks in the aldehyde production pathway of Synechococcus elongatus PCC 7942

Yi Ern Cheah et al. Metab Eng. 2020 Jul.

Abstract

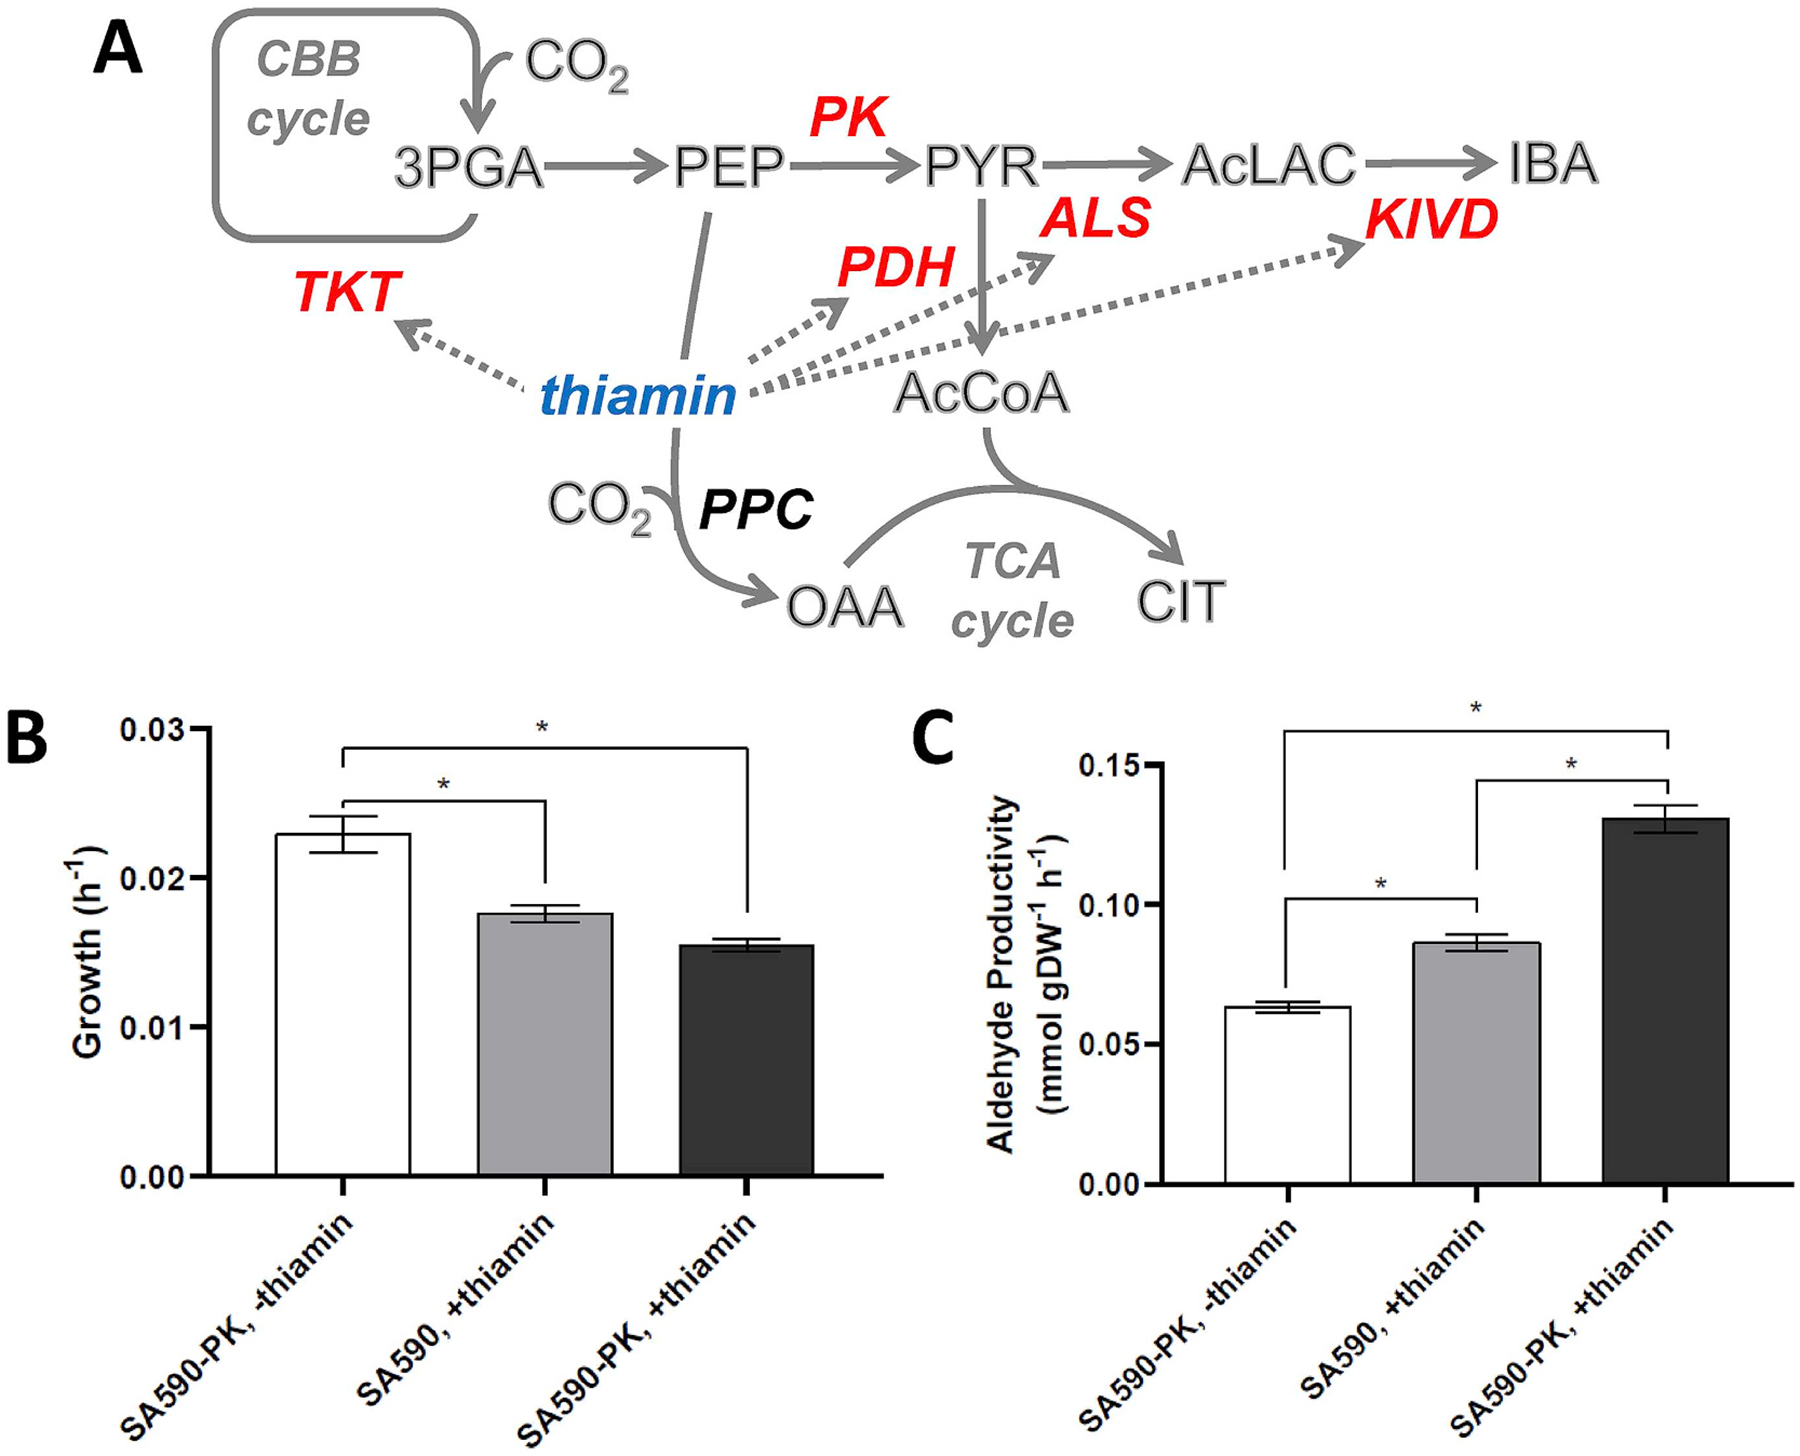
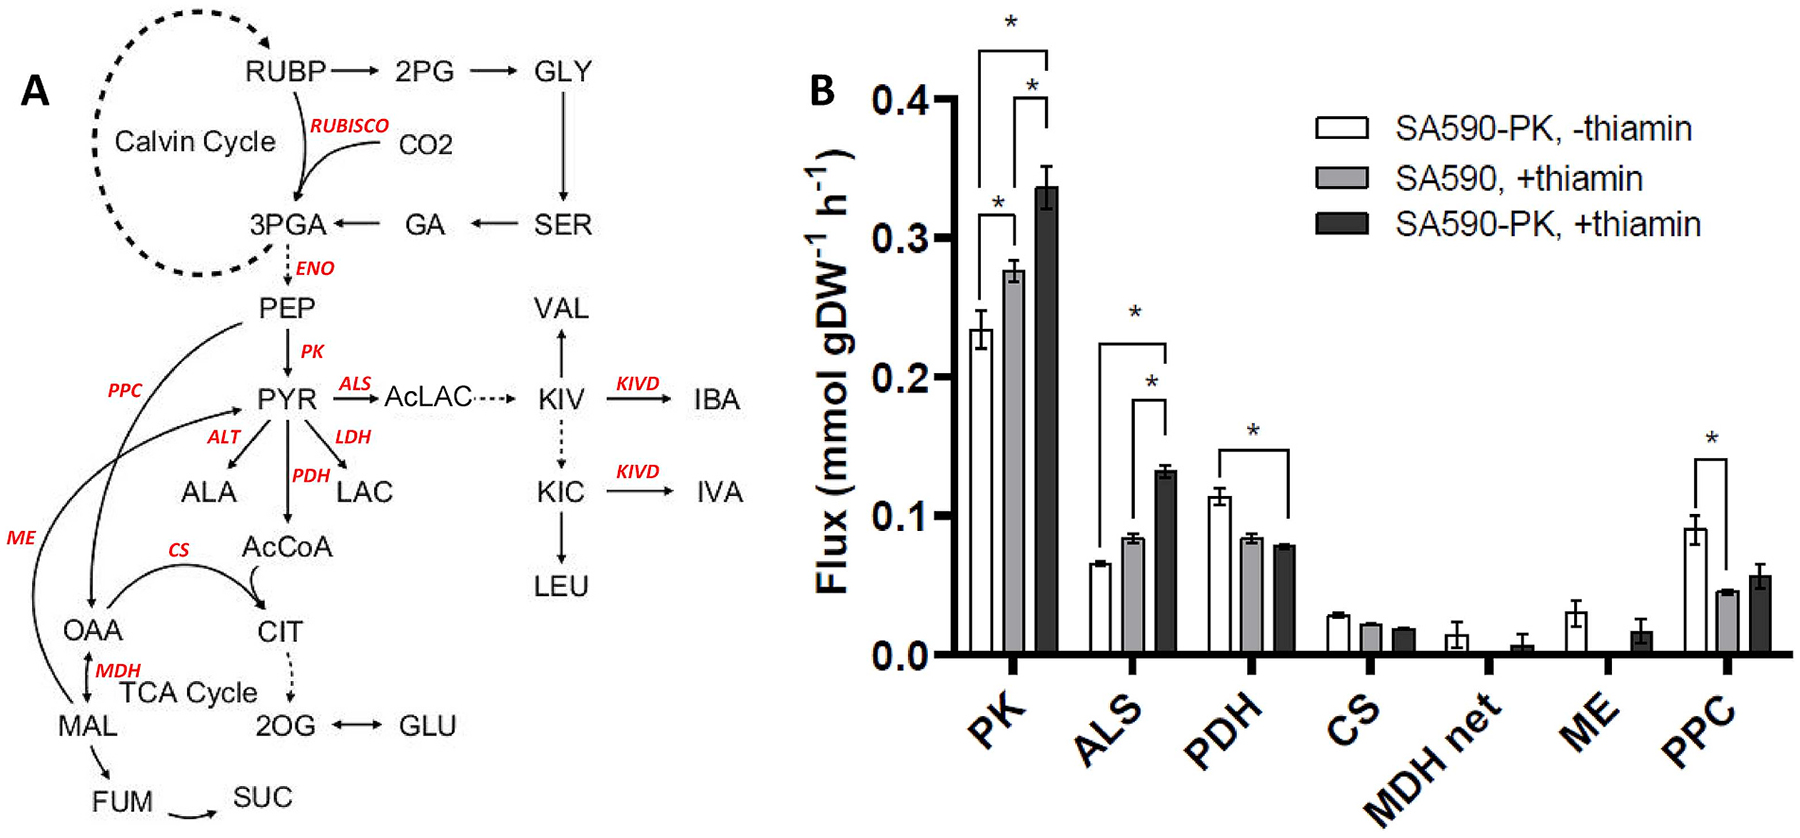
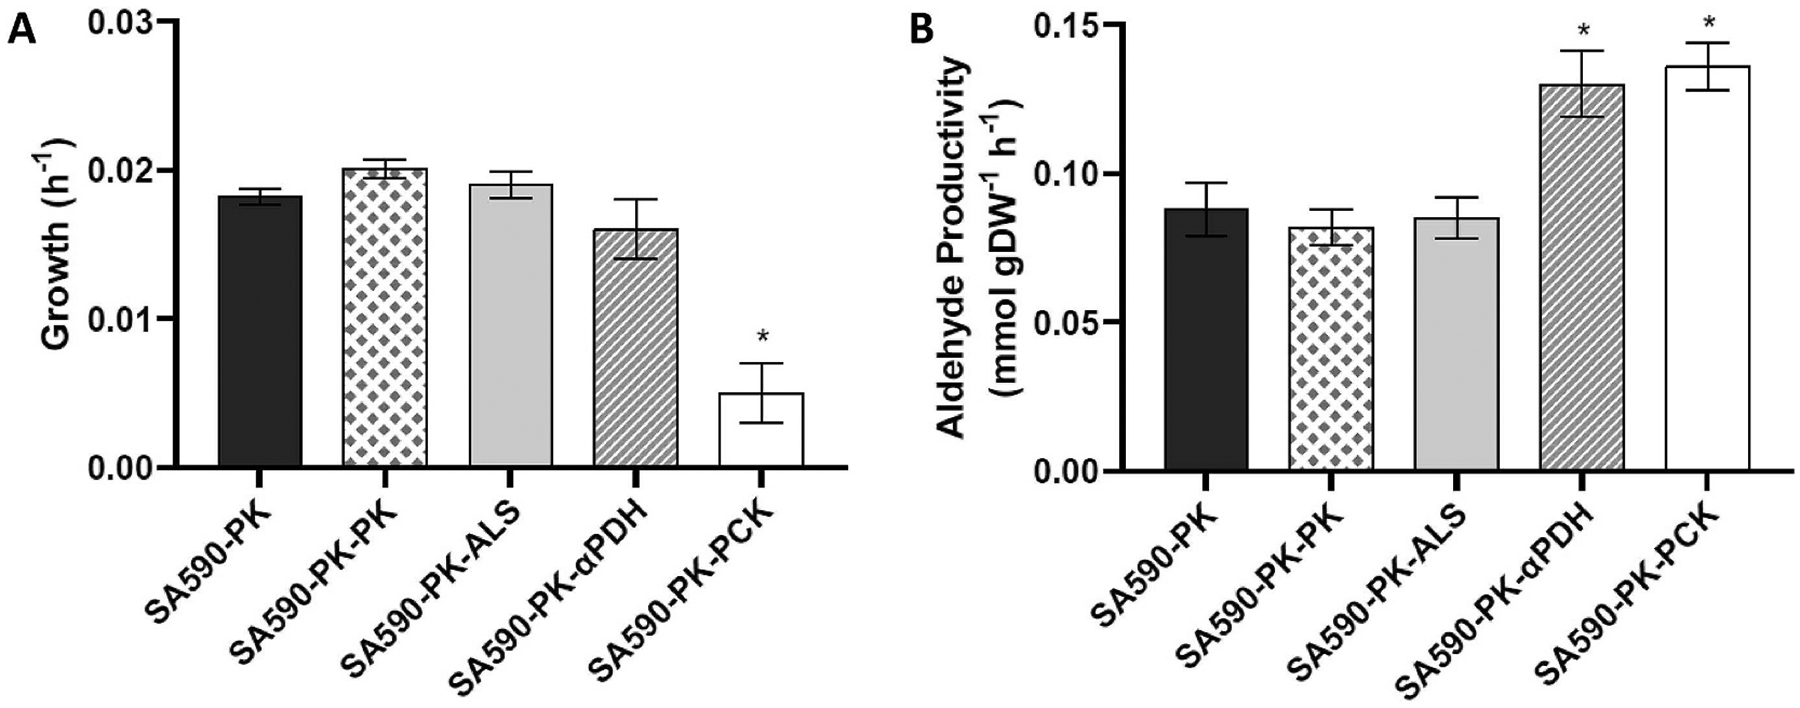
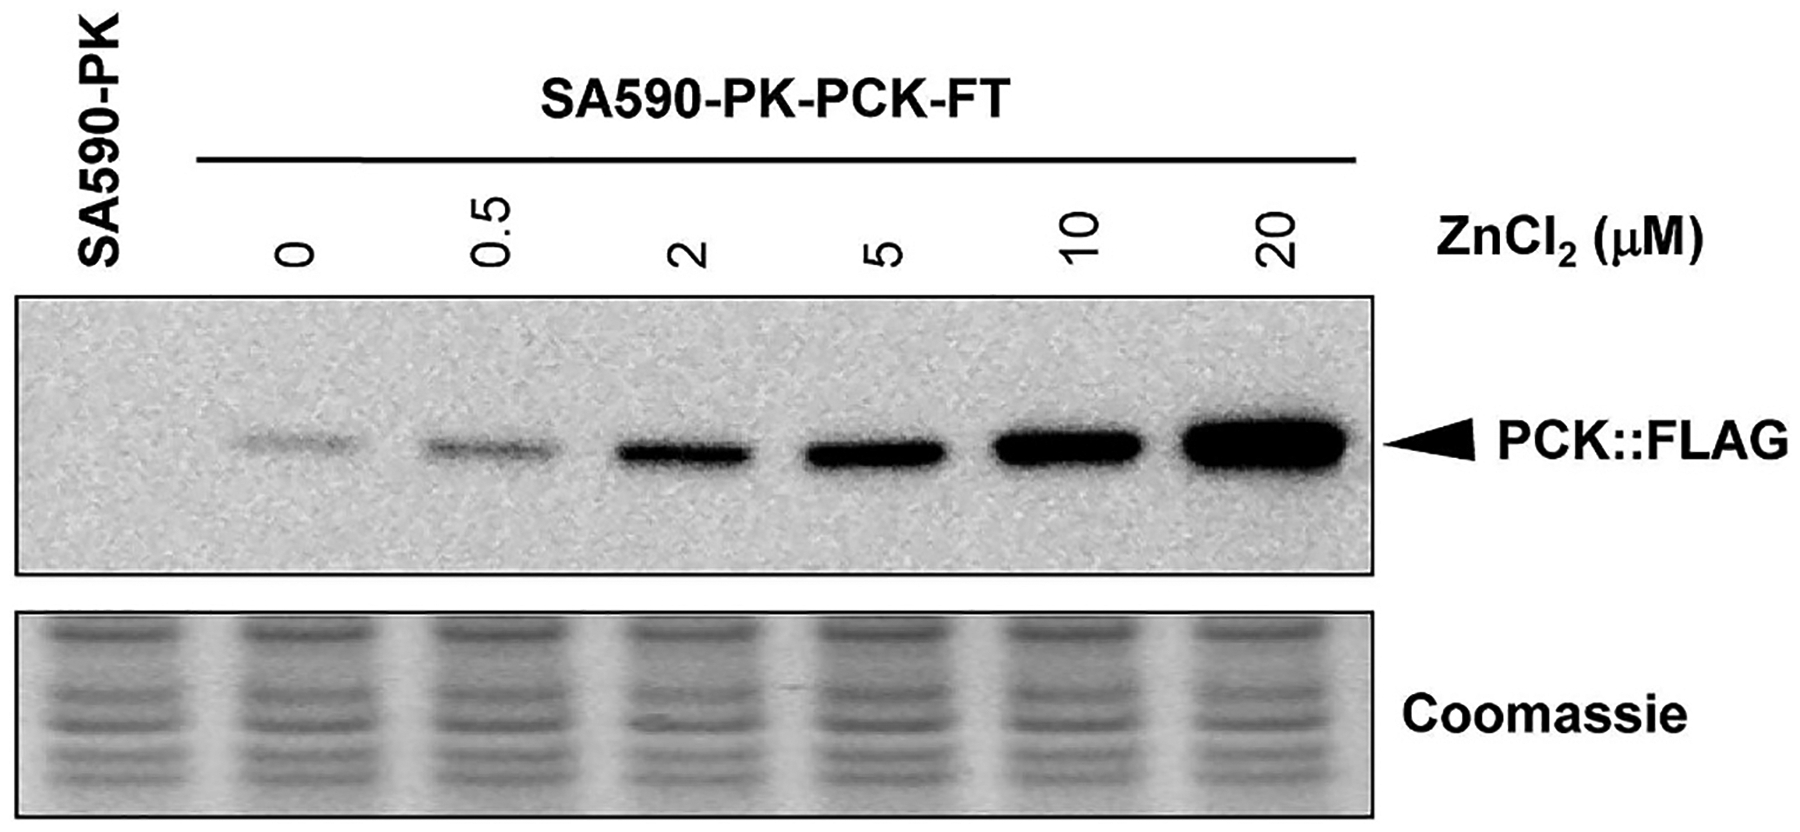
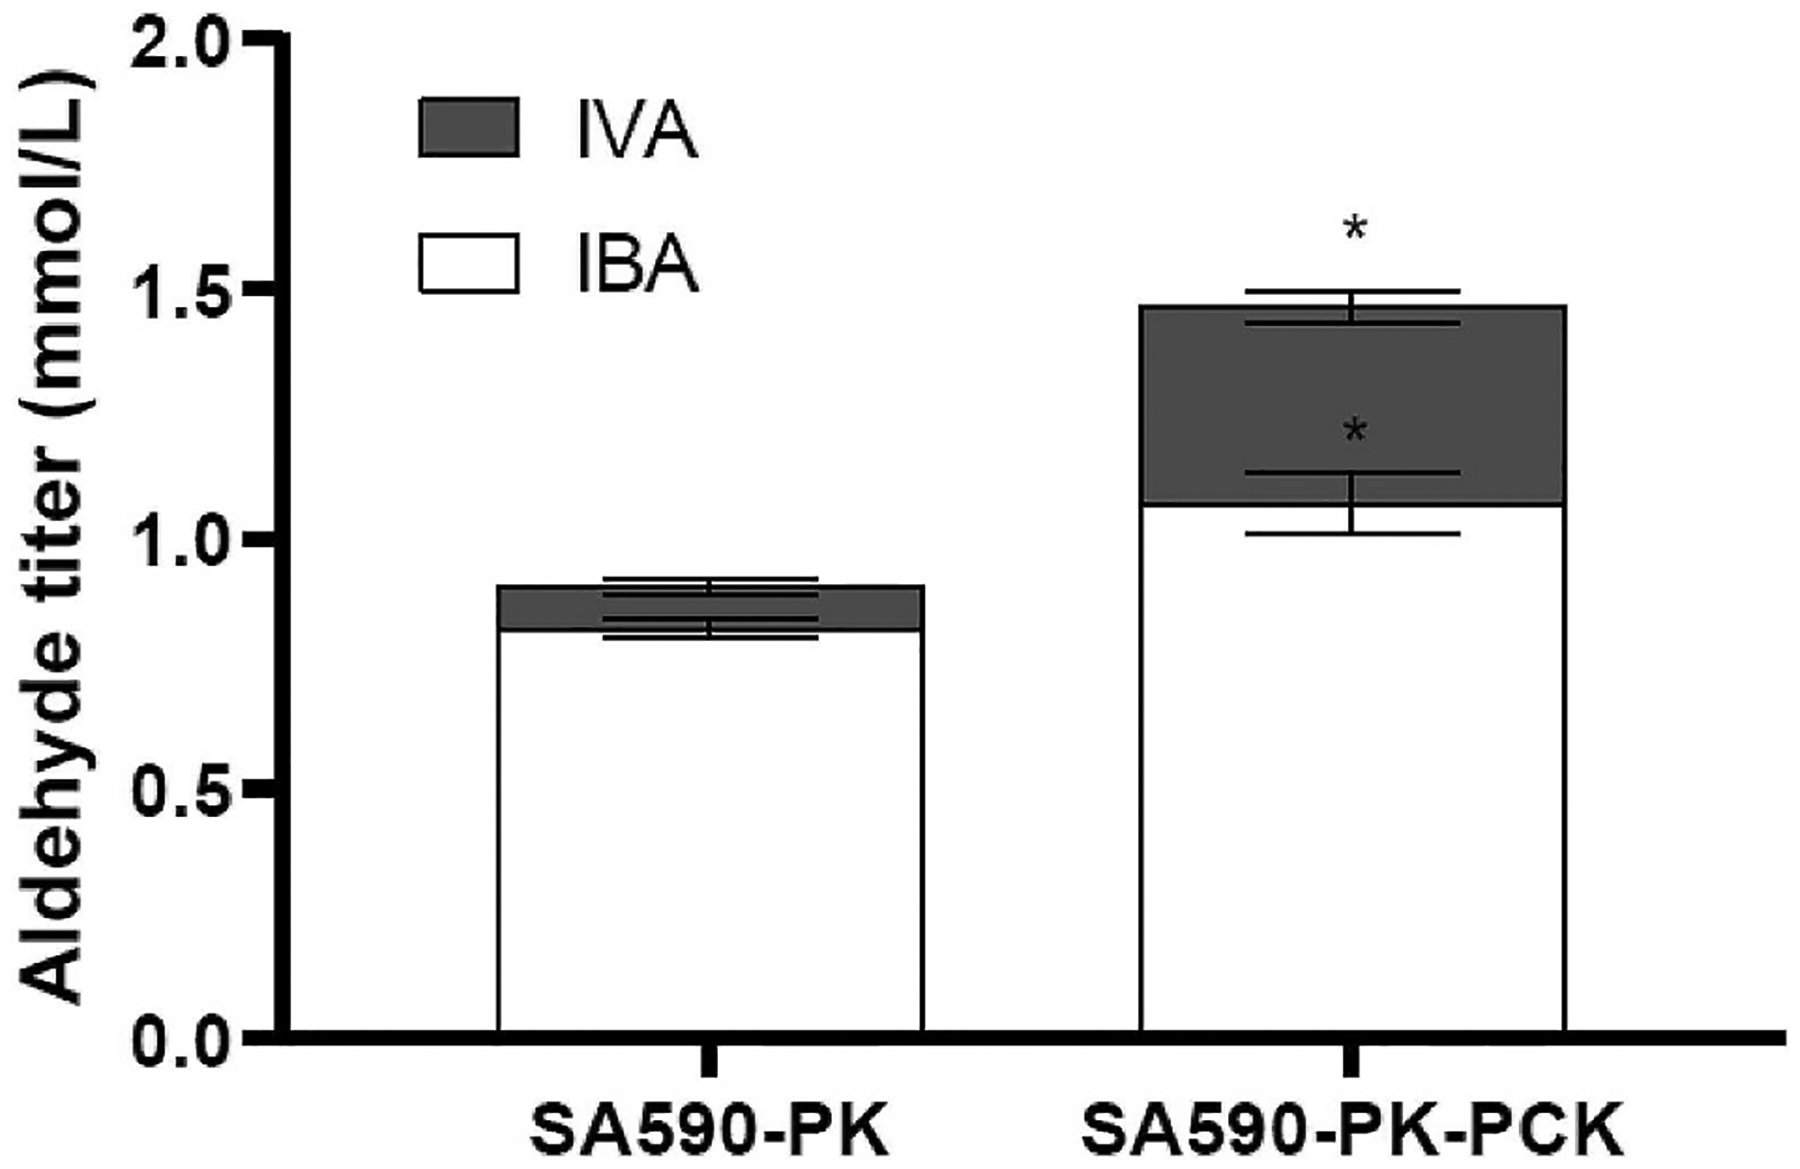
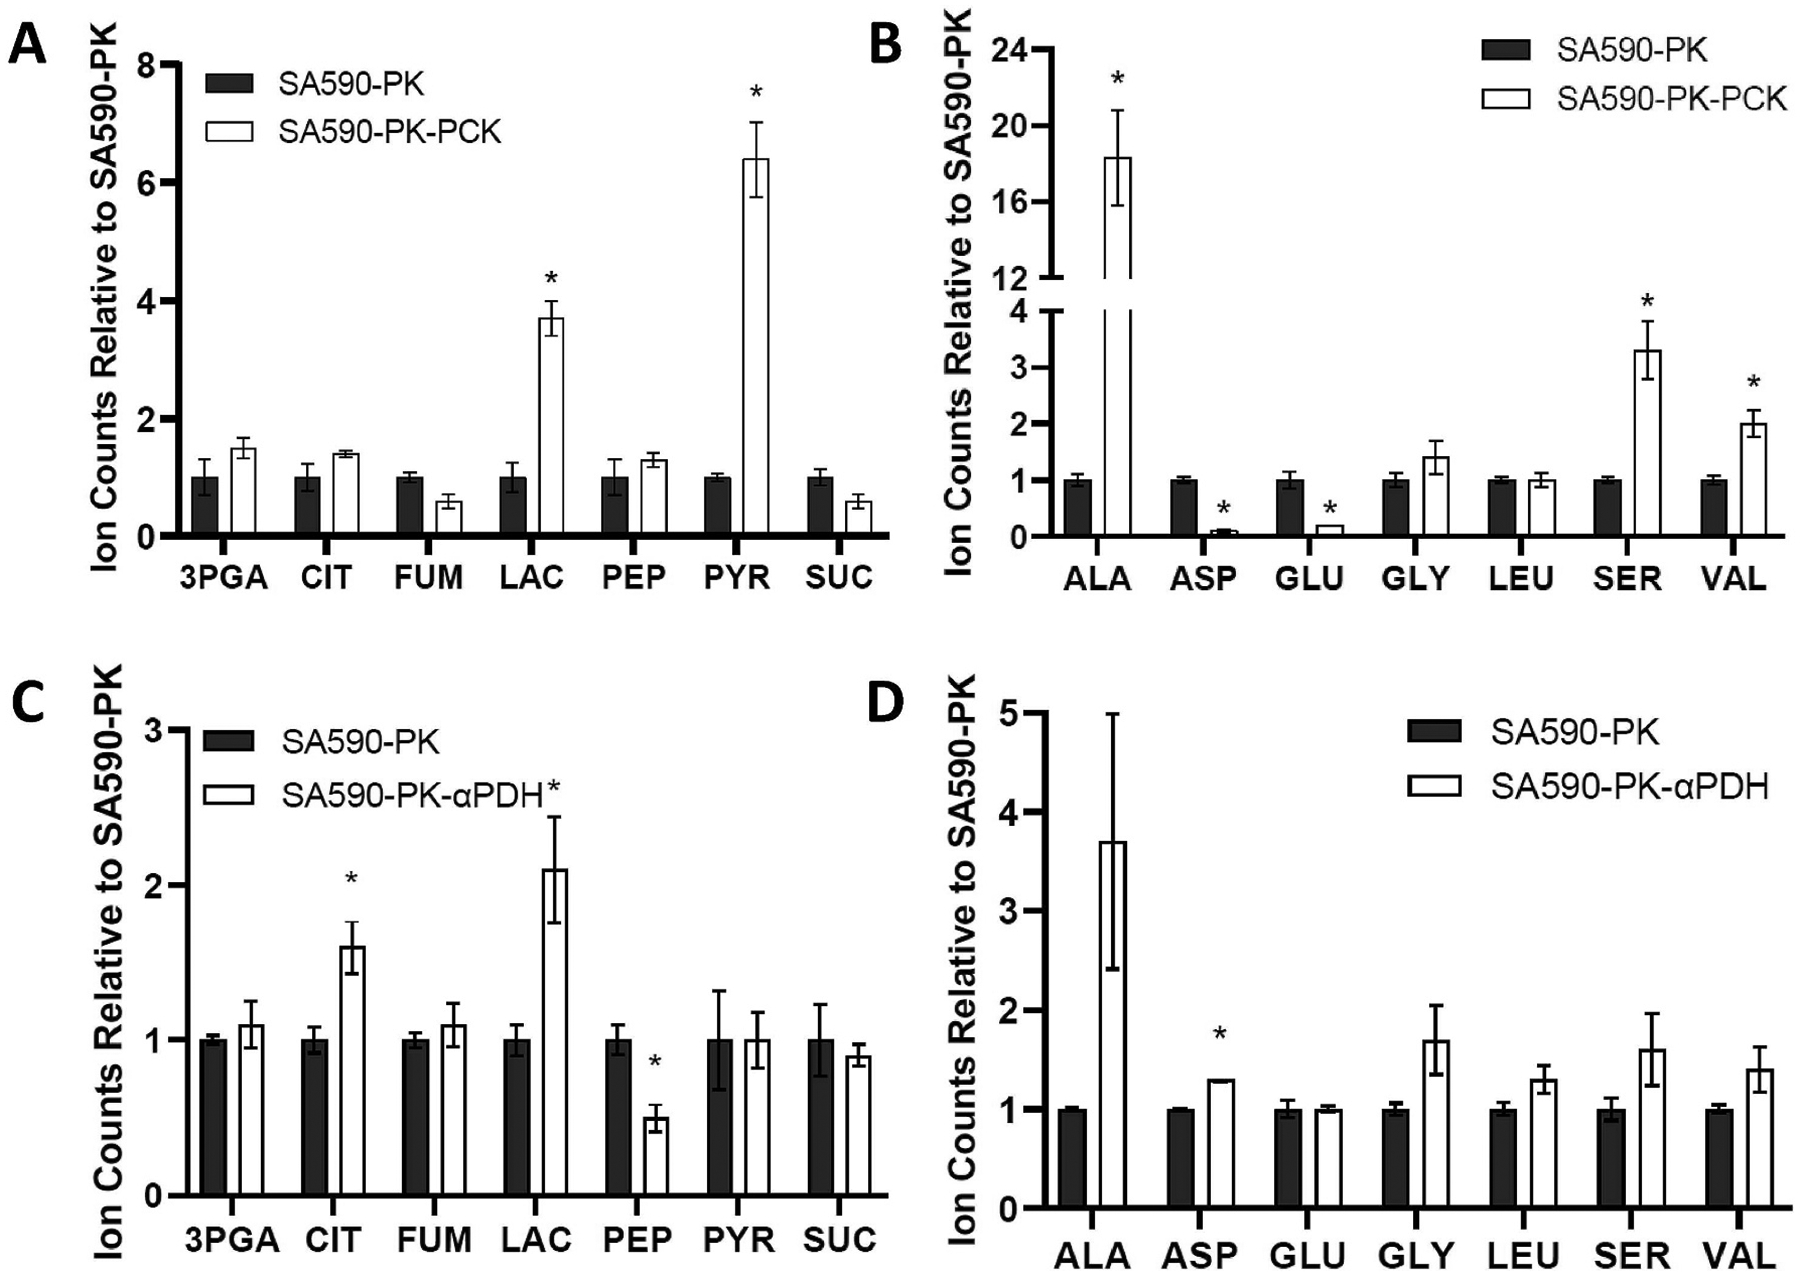
Isotopically nonstationary metabolic flux analysis (INST-MFA) provides a versatile platform to quantitatively assess in vivo metabolic activities of autotrophic systems. By applying INST-MFA to recombinant aldehyde-producing cyanobacteria, we identified metabolic alterations that correlated with increased strain performance in order to guide rational metabolic engineering. We identified four reactions adjacent to the pyruvate node that varied significantly with increasing aldehyde production: pyruvate kinase (PK) and acetolactate synthase (ALS) fluxes were directly correlated with product formation, while pyruvate dehydrogenase (PDH) and phosphoenolpyruvate carboxylase (PPC) fluxes were inversely correlated. Overexpression of enzymes for PK or ALS did not result in further improvements to the previous best-performing strain, while downregulation of PDH expression (through antisense RNA expression) or PPC flux (through expression of the reverse reaction, phosphoenolpyruvate carboxykinase) provided significant improvements. These results illustrate the potential of INST-MFA to enable a systematic approach for iterative identification and removal of pathway bottlenecks in autotrophic host cells.

Keywords: Cyanobacteria; Isobutyraldehyde; Metabolic flux analysis; Phosphoenolpyruvate; Photoautotrophic metabolism; Pyruvate; Stable isotope.


Figures

Fig. 1.
Fig. 1.. Thiamin supplementation and PK overexpression increase aldehyde productivity.
(A) Pathway diagram indicating targeted enzymatic steps (shown in red). Thiamin is a required cofactor for transketolase (TKT), ALS, KIVD, and PDH enzymes. Comparison of growth (B) and specific aldehyde productivity (C) in strains SA590 and SA590-PK with (+) or without (−) thiamin supplementation. Data ± SEM; n = 3. *p < 0.05. (For interpretation of the references to colour in this figure legend, the reader is referred to the Web version of this article.)
Fig. 2.
Fig. 2.. 13C enrichment time courses of intracellular metabolites following addition of NaH13CO3 tracer to cultures of SA590-PK.
(A) Glycolytic/CBB cycle metabolites and (B) photorespiration/TCA cycle metabolites are shown for SA590-PK grown in the absence of supplemental thiamin. Data ± SEM; n = 3. Results have been corrected for natural abundance of stable isotopes (Fernandez et al., 1996).
Fig. 3.
Fig. 3.. Pyruvate-associated fluxes under three experimental conditions arranged according to increasing aldehyde productivity.
(A) Network diagram indicating key reactions and metabolites included in the INST-MFA model. (B) Fluxes estimated by INST-MFA. Abbreviations: ALS, acetolactate synthase; PK, pyruvate kinase; PDH, pyruvate dehydrogenase; CS, citrate synthase; MDH net, malate dehydrogenase (net flux from oxaloacetate to malate); ME, malic enzyme; PPC, PEP carboxylase. Data ± SEM, where SEM was calculated from the upper (UB) and lower bounds (LB) of the 95% flux confidence intervals (Table S1) using the formula SEM = (UB-LB)/3.92. n = 3. *p < 0.05.
Fig. 4.
Fig. 4.. Effects of manipulating target genes on growth and product formation in SA590-PK.
(A) Specific growth rate and (B) specific aldehyde productivity over 24 h (estimated from 6 to 30h time points in Fig. S5). Abbreviations indicate genes overexpressed in the control SA590-PK strain: ALS, acetolactate synthase (L. lactis); PK, pyruvate kinase (S. elongatus); αPDH, antisense RNA targeted to pyruvate dehydrogenase subunit B (S. elongatus); PCK, PEP carboxykinase (E. coli). Data ± SEM; n = 6 for SA590-PK, SA590-PK-αPDH, SA590-PK-PCK; n = 3 for SA590-PK-PK and SA590-PK-ALS. *p < 0.05 relative to control SA590-PK strain.
Fig. 5.
Fig. 5.. Zn2+ dosage-dependent overexpression of the PsmtA::PCK::3×FLAG protein in strain SA590-PK-PCK.
Expression of the PsmtA::PCK::3×FLAG protein was induced for 6 h with different concentrations of Zn2+ and assessed by Western blot. Seven micrograms of cell extract was loaded in each lane, and equal loading was confirmed by Coomassie blue staining. Extracts from strain SA590-PK grown in LL were included as a negative control.
Fig. 6.
Fig. 6.. PCK expression alters aldehyde product composition in SA590-PK.
Medium concentrations of isobutyraldehyde (IBA) and isovaleraldehyde (IVA) at t = 30h of culture. *p < 0.05 relative to control SA590-PK strain.
Fig. 7.
Fig. 7.. Relative abundance of intracellular metabolites in SA590-PK-PCK and SA590-PK-αPDH.
(A) CBB cycle and TCA cycle metabolites, and (B) amino acids in SA590-PK-PCK relative to SA590-PK. (C) CBB cycle and TCA cycle metabolites, and (D) amino acids in SA590-PK-αPDH relative to SA590-PK. Data shown are GC-MS ion counts normalized to an internal standard, L-norvaline, and also normalized to cell density at the time of sample collection. The normalized ion counts for both strains were then expressed relative to SA590-PK, which adjusts all relative counts for SA590-PK to unity. Data ± SEM; n = 3. *p < 0.05 relative to control SA590-PK strain.

References

    1. Abernathy MH, Czajka JJ, Allen DK, Hill NC, Cameron JC, Tang YJ, 2019. Cyanobacterial carboxysome mutant analysis reveals the influence of enzyme compartmentalization on cellular metabolism and metabolic network rigidity. Metab. Eng 54, 222–231. - PMC - PubMed
    1. Abernathy MH, Yu J, Ma F, Liberton M, Ungerer J, Hollinshead WD, Gopalakrishnan S, He L, Maranas CD, Pakrasi HB, Allen DK, Tang YJ, 2017. Deciphering cyanobacterial phenotypes for fast photoautotrophic growth via isotopically nonstationary metabolic flux analysis. Biotechnol. Biofuels 10, 273. - PMC - PubMed
    1. Adebiyi AO, Jazmin LJ, Young JD, 2015. 13C flux analysis of cyanobacterial metabolism. Photosynth. Res 126, 19–32. - PubMed
    1. Angermayr SA, Gorchs Rovira A, Hellingwerf KJ, 2015. Metabolic engineering of cyanobacteria for the synthesis of commodity products. Trends Biotechnol 33, 352–361. - PubMed
    1. Antoniewicz MR, 2013. 13C metabolic flux analysis: optimal design of isotopic labeling experiments. Curr. Opin. Biotechnol 24, 1116–1121. - PubMed

Publication types

MeSH terms

Supplementary concepts

LinkOut - more resources