. 2020 Aug;50(8):1187-1194.
doi: 10.1002/eji.201948473. Epub 2020 May 4.

Malaria exposure drives both cognate and bystander human B cells to adopt an atypical phenotype

Affiliations

Malaria exposure drives both cognate and bystander human B cells to adopt an atypical phenotype

Racheal Aye et al. Eur J Immunol. 2020 Aug.

Abstract

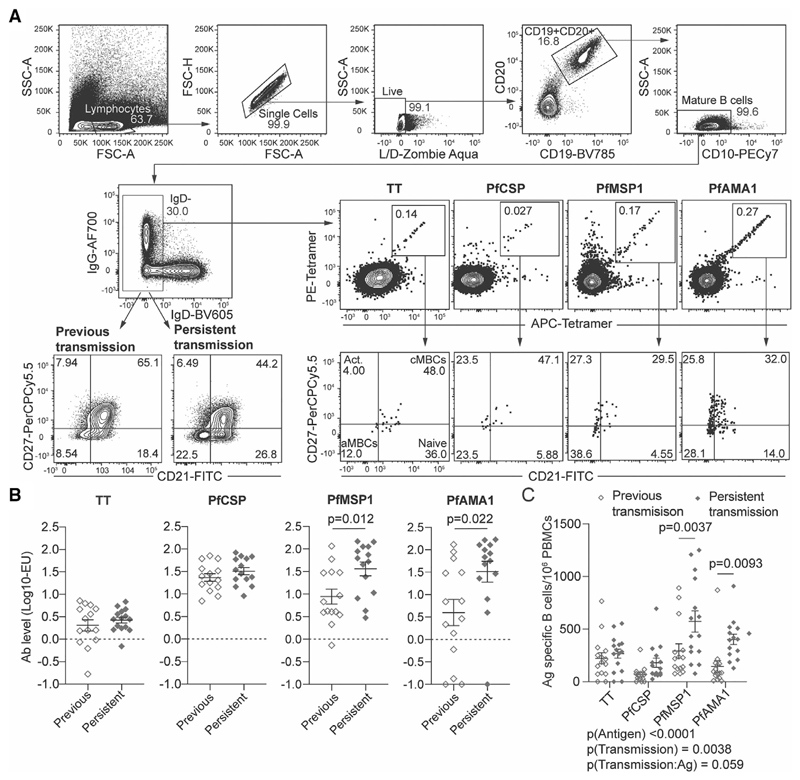
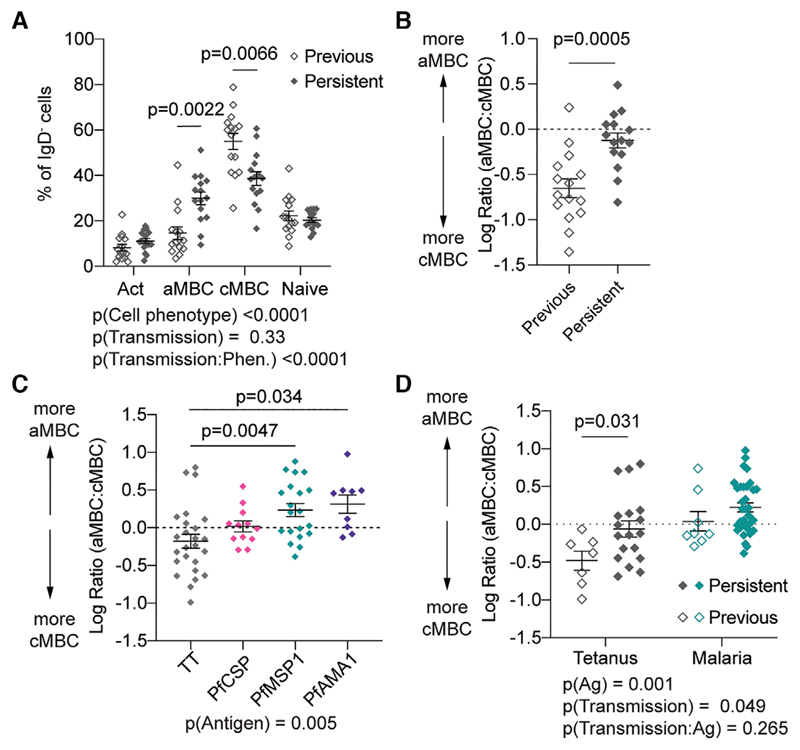
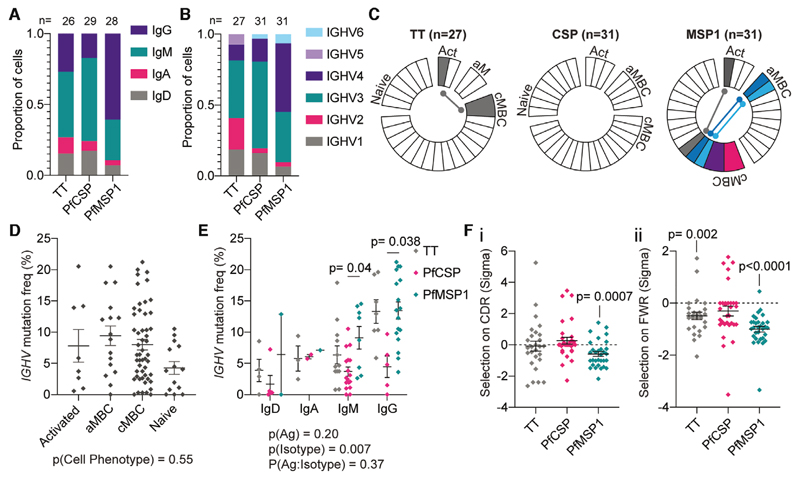
Atypical memory B cells (aMBCs) are found in elevated numbers in individuals exposed to malaria. A key question is whether malaria induces aMBCs as a result of exposure to Ag, or non-Ag-specific mechanisms. We identified Plasmodium and bystander tetanus toxoid (TT) specific B cells in individuals from areas of previous and persistent exposure to malaria using tetramers. Malaria-specific B cells were more likely to be aMBCs than TT-specific B cells. However, TT-specific B cells from individuals with continuous exposure to malaria were more likely to be aMBCs than TT-specific B cells in individuals from areas where transmission has ceased. Finally, sequences of BCRs specific for a blood stage malaria-Ag were more highly mutated than sequences from TT-specific BCRs and under strong negative selection, indicative of ongoing antigenic pressure. Our data suggest both persistent Ag exposure and the inflammatory environment shape the B-cell response to malaria and bystander Ags.

Keywords: B-cell memory; Plasmodium; immunological memory; malaria; tetanus toxoid.


Conflict of interest statement

Conflict of interest: The authors declare no financial or commercial conflict of interest.

Figures

Figure 1
Figure 1
Individuals in areas of persistent transmission have high numbers of circulating B cells specific for blood stage Ags. PBMCs from 30 individuals (15 previously exposed; 15 persistently exposed in one experiment) were analysed to determine the frequency of Ag-specific MBCs and Ab titers to TT and a panel of malaria Ags. (A) General gating strategy for the identification of Ag-specific B cells and determination of B-cell phenotype. Data from a representative individual who had detectable levels of Ag-specific B cells for all Ags studied shown. (B) Quantitation of levels of circulating antibodies to TT, PfCSP, PfMSP1 and PfAMA1, among individuals exposed to moderate or low levels of malaria transmission. Units are international units for TT and arbitrary ELISA units for the Plasmodium Ags; mean ± SEM shown, data analysed by Students t-test for each Ag. (C) The number of tetramer+ IgD- B cells per million PBMCs specific for each of the Ags studied; mean ± SEM shown; analysis was via two-way ANOVA controlling for subject as a random effect; details of the model are given below the graph.
Figure 2
Figure 2
Ag exposure and malaria transmission drive the atypical phenotype in B cells. PBMCs from the 30 individuals (15 previously exposed; 15 persistently exposed in one experiment) described in Fig. 1 were analysed for the phenotype of bulk and Ag-specific B cells. (A) Percentages of bulk IgD B cells that have the cMBC, aMBC, activated and naïve phenotypes in individuals exposed to moderate and low levels of malaria transmission; mean ± SEM shown; analysis was via two-way ANOVA with Tukey post-test controlling for subject as a random effect; details of the model are given below the graph. (B) Log ratio of aMBC to cMBCs among bulk IgD B cells in individuals exposed to low and moderate levels of malaria transmission. Mean ± SEM shown; analysis via Student’s t-test. (C) Log ratio of aMBC to cMBCs among Ag-specific B cells pooled from all donors, regardless of transmission status who had detectable levels of circulating Ag-specific B cells. Data are presented as mean ± SEM with analysis via one-way ANOVA with Tukey post-test controlling for subject as a random factor with pairwise comparisons made to the TT (control) group; n = 66 observations, observations were only included if there were >10 Ag-specific cells/sample. (D) Log ratio of aMBC to cMBCs among malaria-specific (pooled from PfCSP, PfMSPl and PfAMAl) and TT-specific B cells segregated by the levels of malaria exposure; mean ± SEM shown and analysed via two-way ANOVA with Tukey post-test controlling for subject as a random effect, details of the model are given below the graph.
Figure 3
Figure 3
Diversity of Ab responses to TT and Plasmodium Ags. B cells specific for TT (n = 27 cells from 2 donors), PfCSP (n = 31 cells from three donors) and PfMSP1 (n = 31 cells from three donors, one sort per donor) were sorted after tetramer staining and rearranged Ig V(D)J sequences and constant regions determined by RNA-seq. Analysis of (A) Ig isotype and (B) IGHV gene use by Ag-specific B cells; note for some cells it was not possible to determine the isotype used. (C) Analysis of clonal relationships between B cells specific for each Ag; each wedge constitutes a unique clone, clones with multiple representatives are coloured and if a clone spans two phenotypes the link is indicated. (D) Analysis of mutation frequency by cell phenotype; bars show mean ± SEM; analysis was by one-way ANOVA with Tukey post-test controlling for subject as a random effect. (E) Association of mutation frequency with Ag and Ab isotype; analysis by two-way ANOVA controlling for subject as a random factor with Tukey post-test, bars show mean ± SEM details of the model are given below the graph, significant pairwise comparisons indicated. (F) Results of BASELINe analysis of selective pressure (sigma) on Ig gene sequences in (i) CDRs and (ii) FWRs; mean ± SEM shown for each Ag, analysis by single sample ANOVA to determine if the selective pressure is significantly different from zero.

References

    1. World Health Organization, World Malaria Report 2019. World Health Organization. Geneva: 2019.
    1. Langhorne J, Ndungu FM, Sponaas AM, Marsh K. Immunity to malaria: more questions than answers. Nat Immunol. 2008;9:725–732. - PubMed
    1. Tran TM, Li S, Doumbo S, Doumtabe D, Huang CY, Dia S, Bathily A, et al. An intensive longitudinal cohort study of Malian children and adults reveals no evidence of acquired immunity to Plasmodium falciparum infection. Clin Infect Dis. 2013;57:40–47. - PMC - PubMed
    1. Chan JA, Fowkes FJ, Beeson JG. Surface antigens of Plasmodium falciparum-infected erythrocytes as immune targets and malaria vaccine candidates. Cell Mol Life Sci. 2014;71:3633–3657. - PMC - PubMed
    1. Fowkes FJ, Richards JS, Simpson JA, Beeson JG. The relationship between anti-merozoite antibodies and incidence of Plasmodium falciparum malaria: A systematic review and meta-analysis. PLoS Med. 2010;7:e1000218. - PMC - PubMed

Publication types