. 2020 Mar 30:9:e52946.
doi: 10.7554/eLife.52946.

Identification of drug modifiers for RYR1-related myopathy using a multi-species discovery pipeline

Affiliations

Identification of drug modifiers for RYR1-related myopathy using a multi-species discovery pipeline

Jonathan R Volpatti et al. Elife. .

Abstract

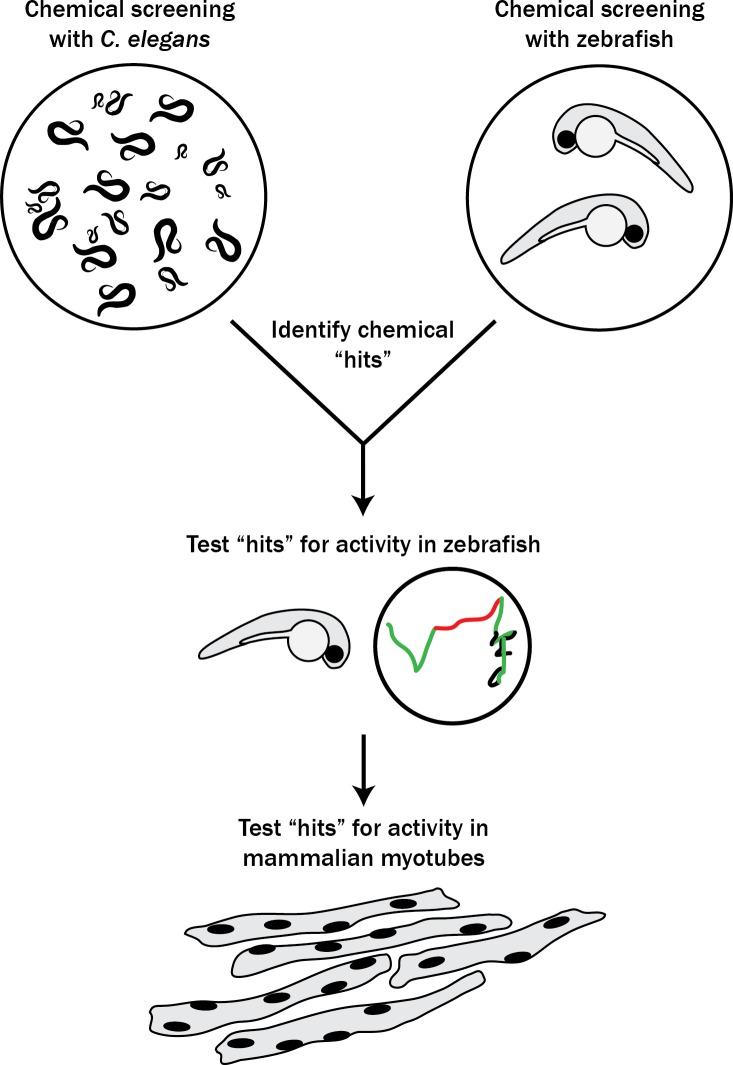
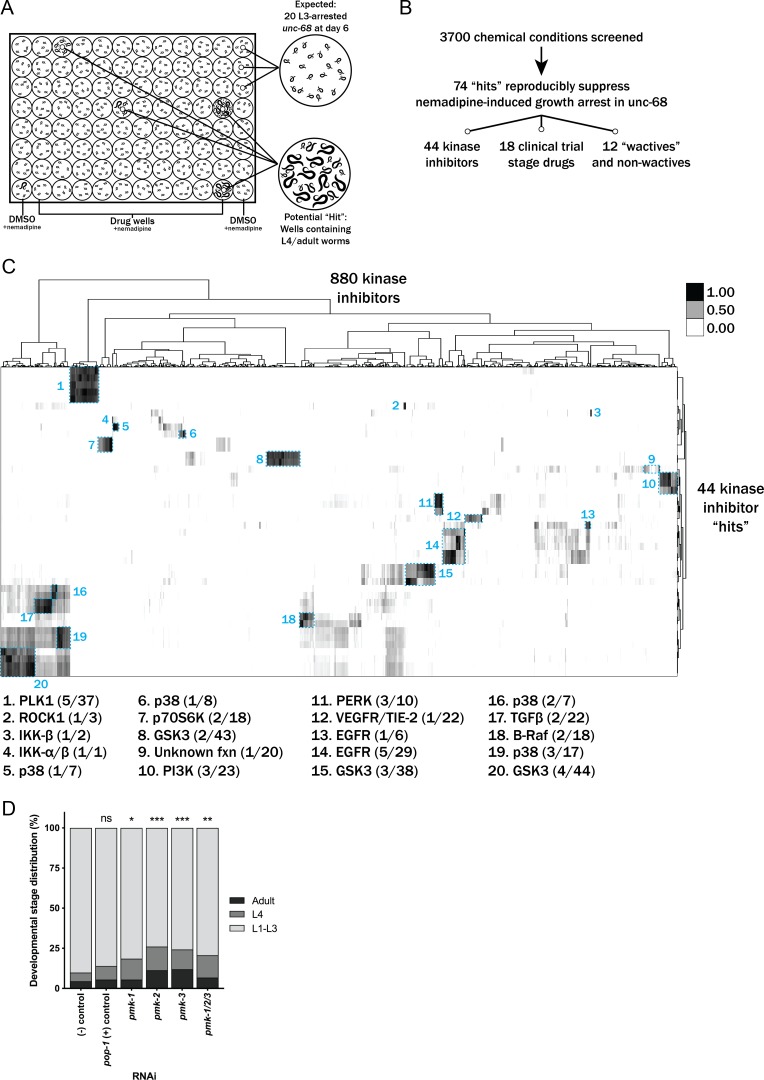
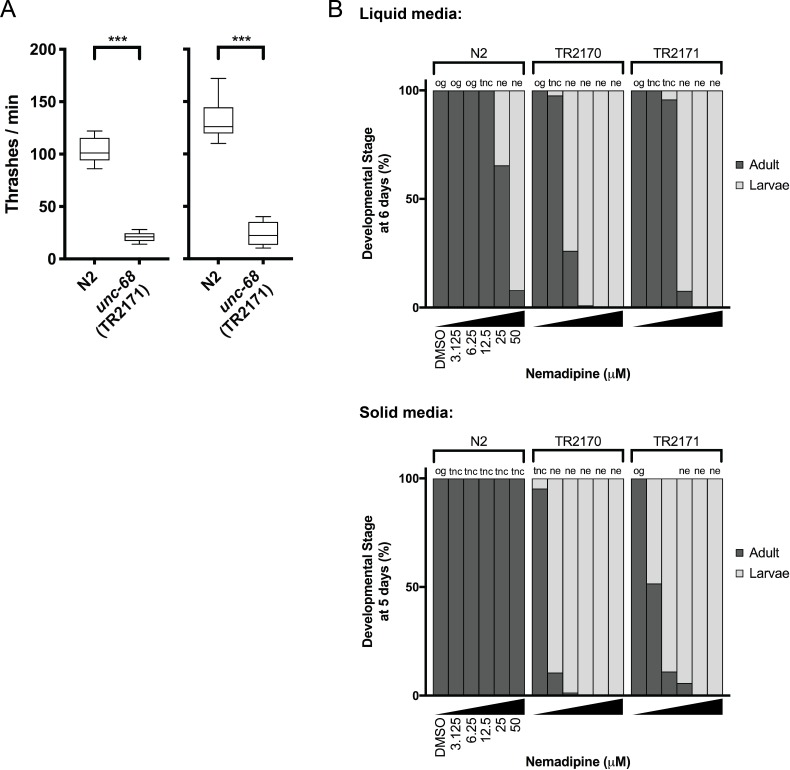
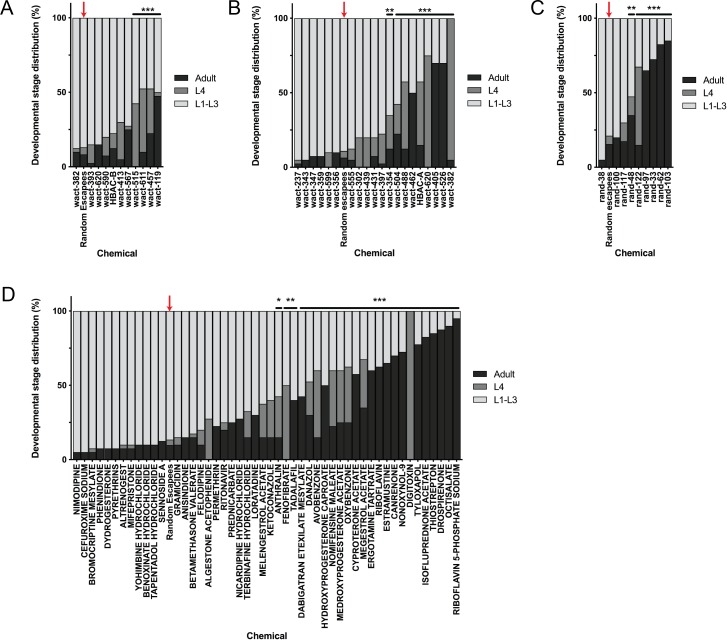
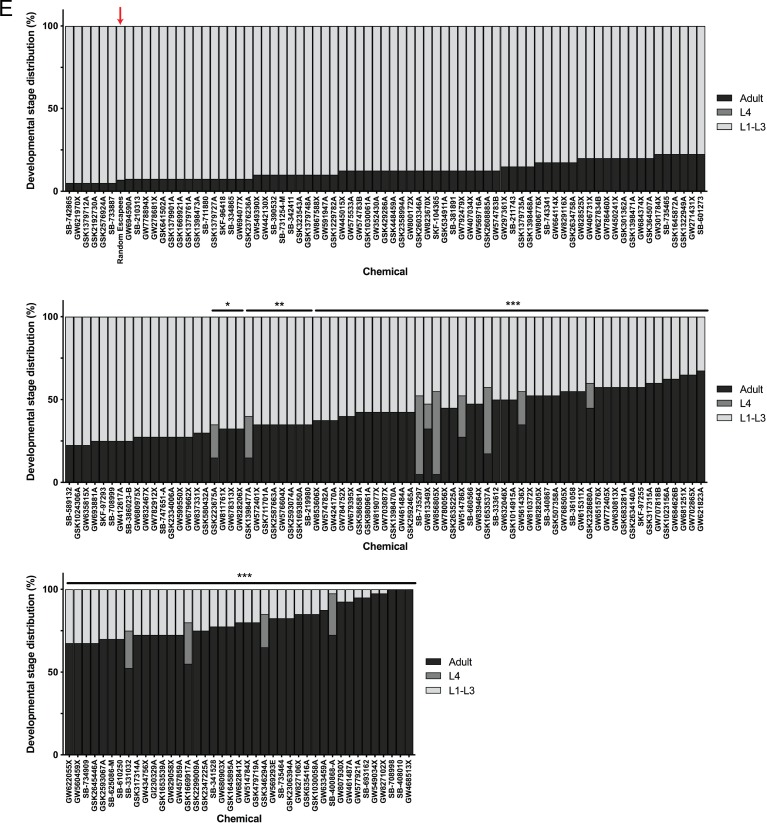
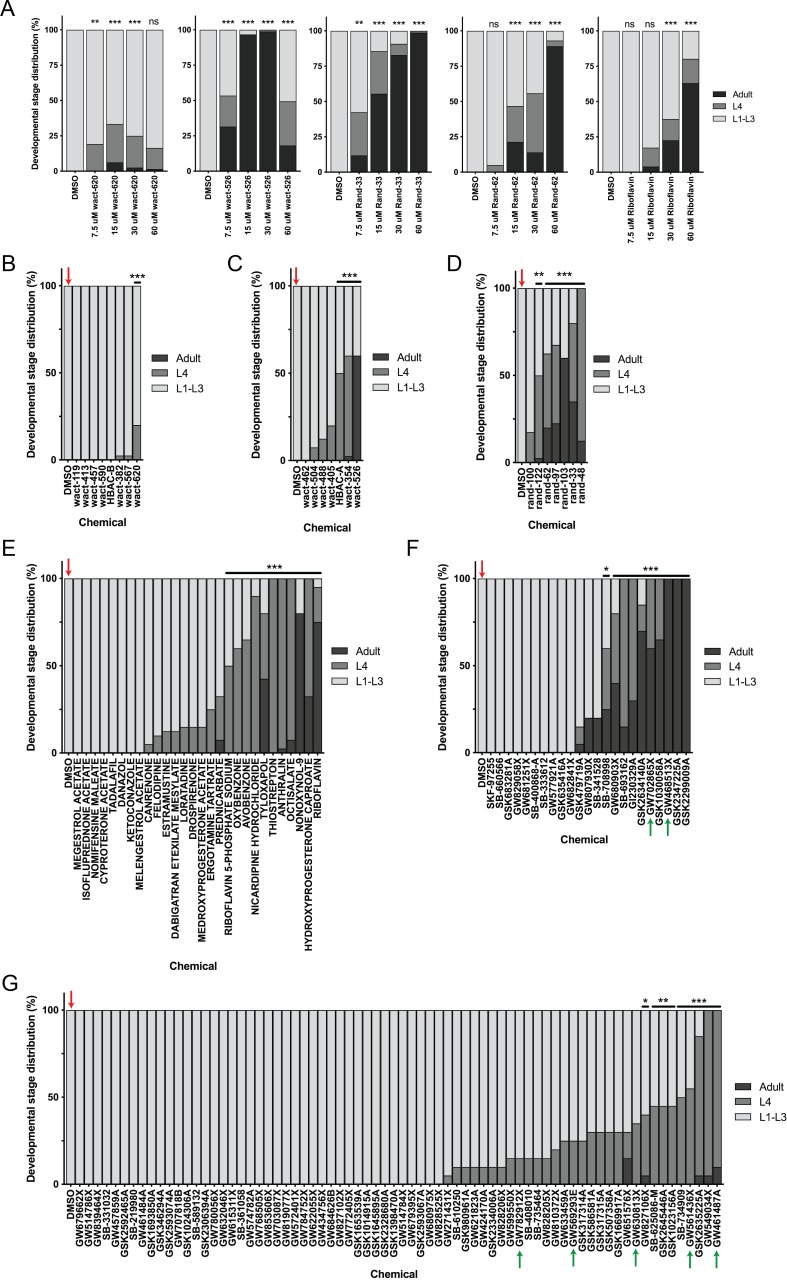
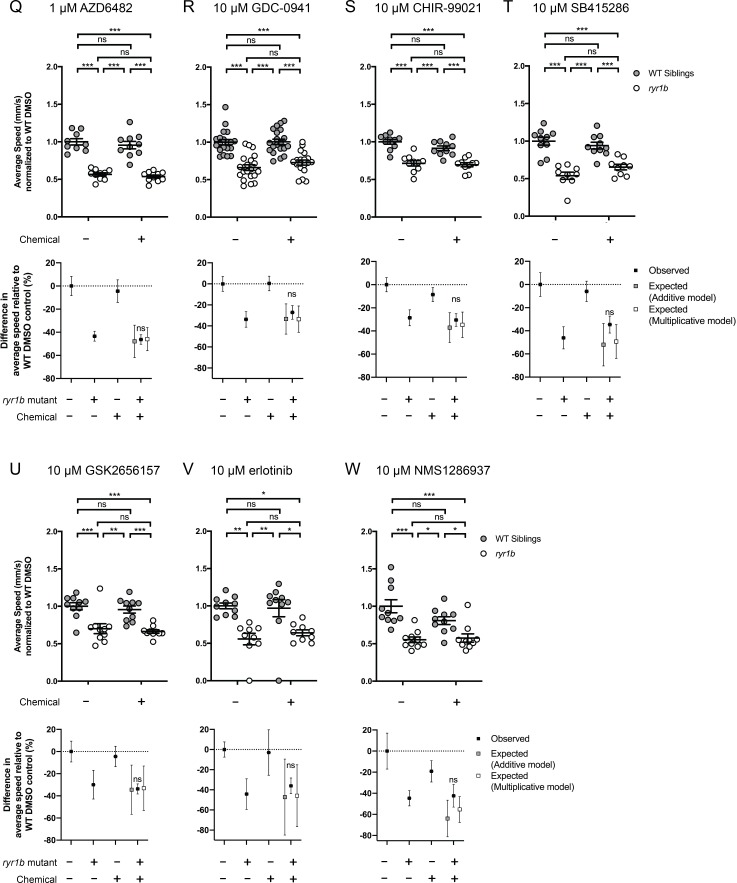
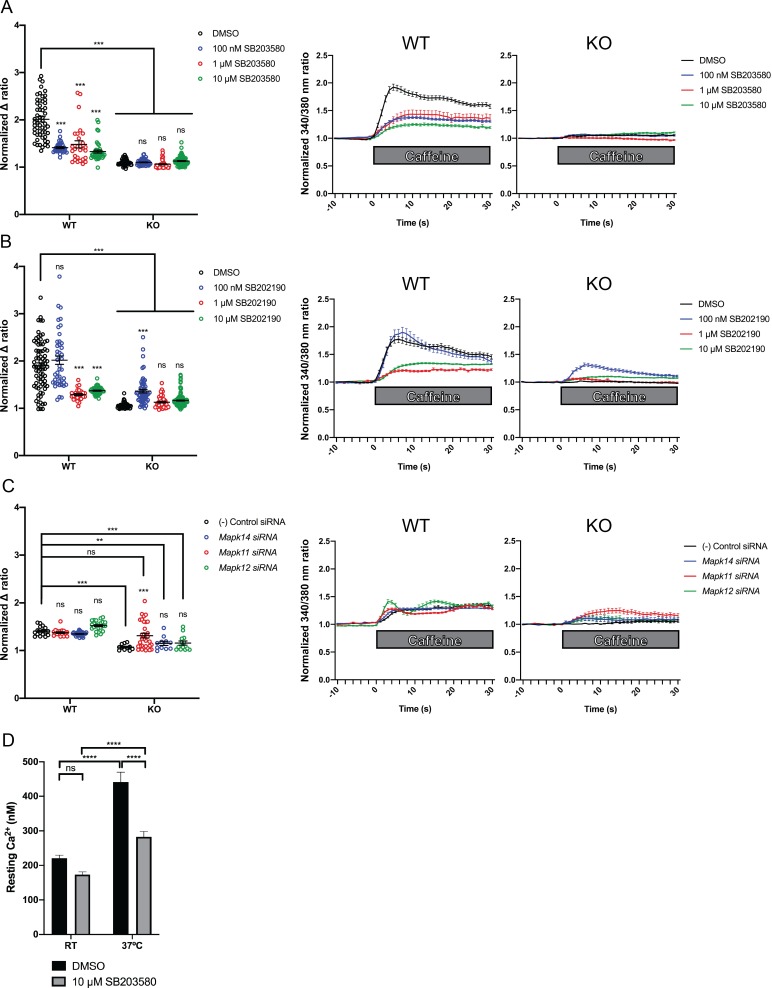
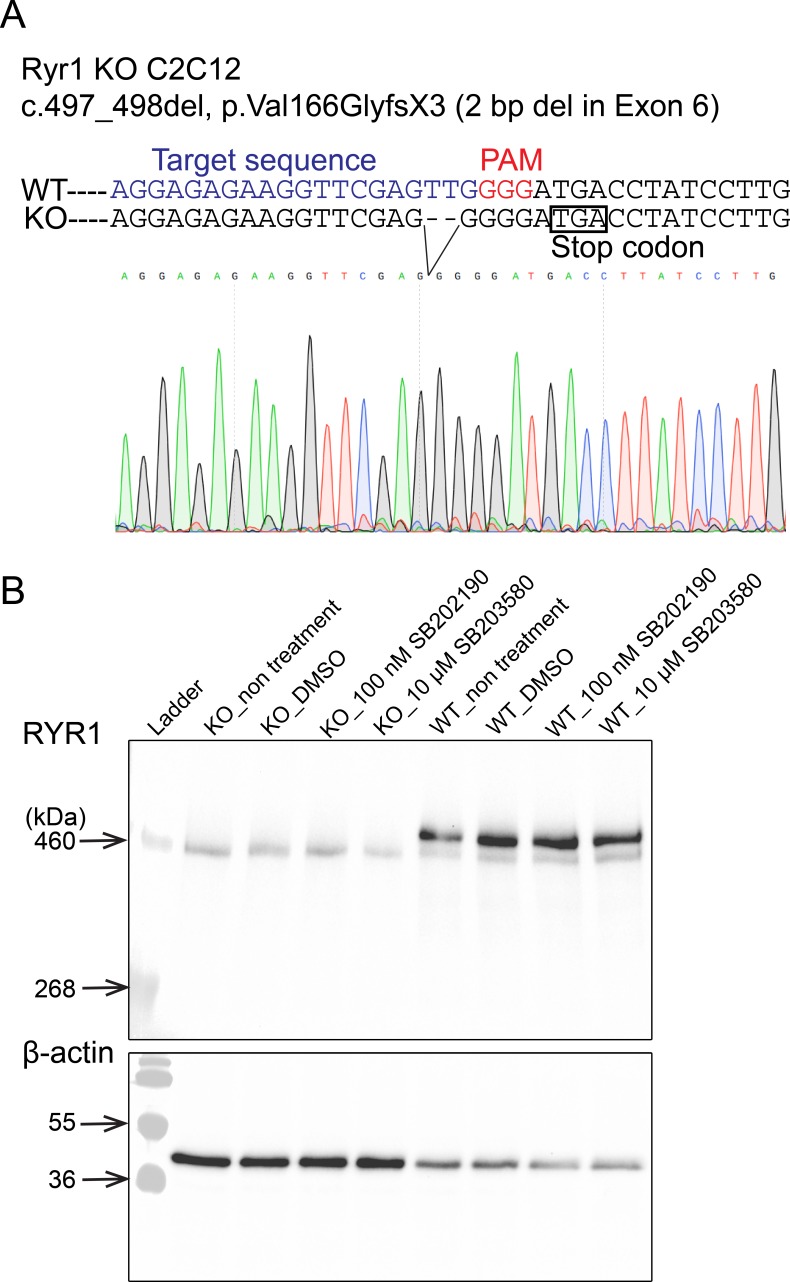
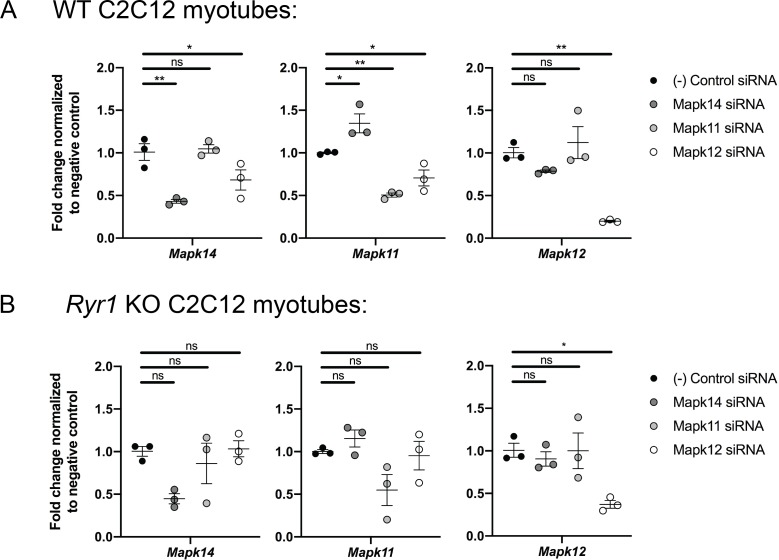
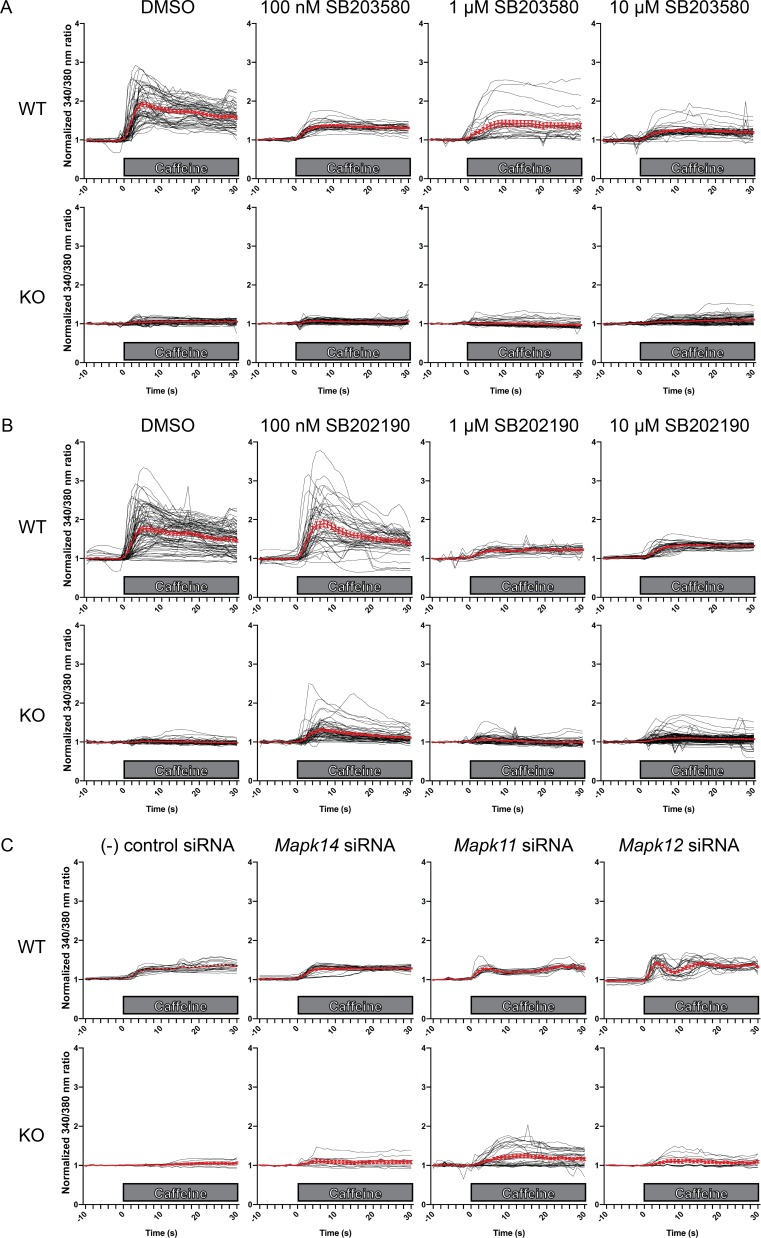
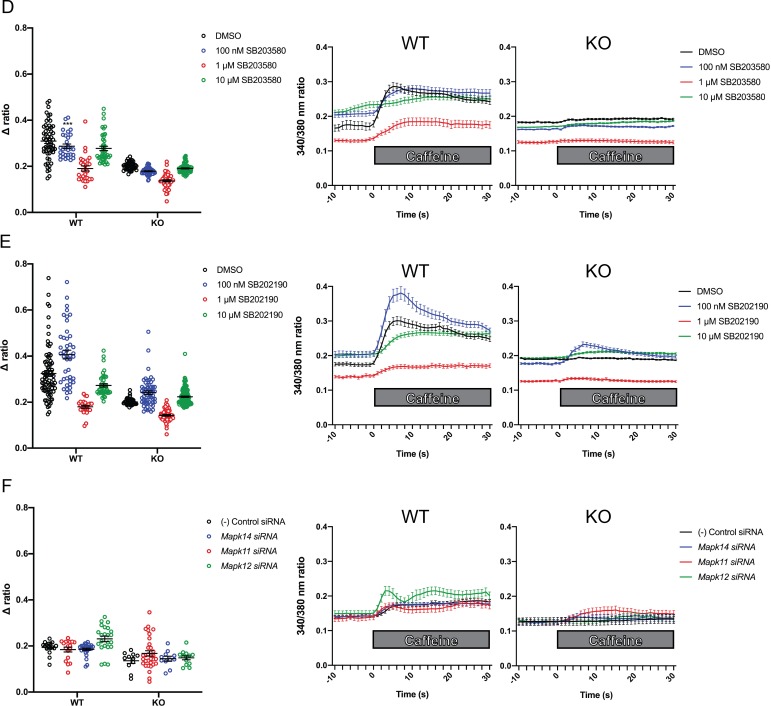
Ryanodine receptor type I-related myopathies (RYR1-RMs) are a common group of childhood muscle diseases associated with severe disabilities and early mortality for which there are no available treatments. The goal of this study is to identify new therapeutic targets for RYR1-RMs. To accomplish this, we developed a discovery pipeline using nematode, zebrafish, and mammalian cell models. We first performed large-scale drug screens in C. elegans which uncovered 74 hits. Targeted testing in zebrafish yielded positive results for two p38 inhibitors. Using mouse myotubes, we found that either pharmacological inhibition or siRNA silencing of p38 impaired caffeine-induced Ca2+ release from wild type cells while promoting intracellular Ca2+ release in Ryr1 knockout cells. Lastly, we demonstrated that p38 inhibition blunts the aberrant temperature-dependent increase in resting Ca2+ in myotubes from an RYR1-RM mouse model. This unique platform for RYR1-RM therapy development is potentially applicable to a broad range of neuromuscular disorders.

Keywords: C. elegans; RYR1; animal models; drug screen; excitation contraction coupling; human biology; medicine; mouse; myopathy; zebrafish.

Plain language summary

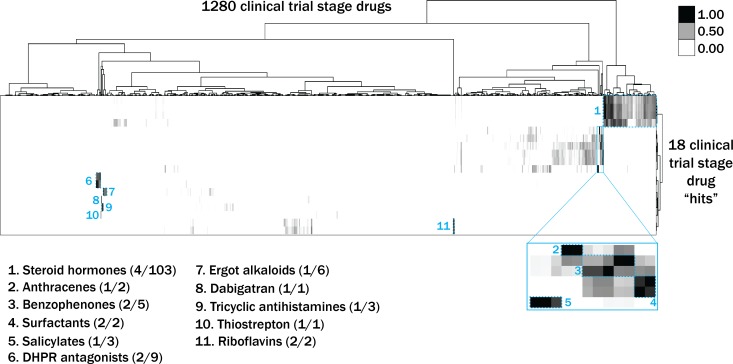
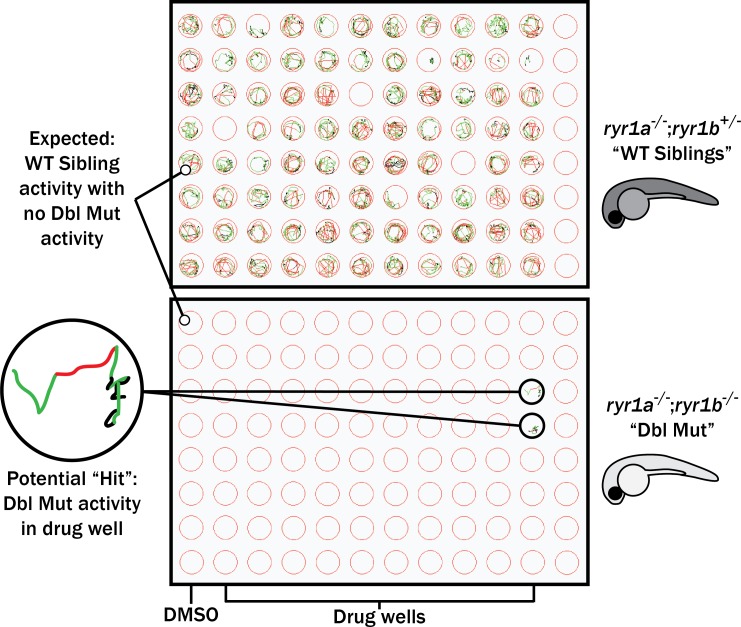
Muscle cells have storage compartments stuffed full of calcium, which they release to trigger a contraction. This process depends on a channel-shaped protein called the ryanodine receptor, or RYR1 for short. When RYR1 is activated, it releases calcium from storage, which floods the muscle cell. Mutations in the gene that codes for RYR1 in humans cause a group of rare diseases called RYR1-related myopathies. The mutations change calcium release in muscle cells, which can make movement difficult, and make it hard for people to breathe. At the moment, RYR1 myopathies have no treatment. It is possible that repurposing existing drugs could benefit people with RYR1-related myopathies, but trialing treatments takes time. The fastest and cheapest way to test whether compounds might be effective is to try them on very simple animals, like nematode worms. But even though worms and humans share certain genes, treatments that work for worms do not always work for humans. Luckily, it is sometimes possible to test whether compounds might be effective by trying them out on complex mammals, like mice. Unfortunately, these experiments are slow and expensive. A compromise involves testing on animals such as zebrafish. So far, none of these methods has been successful in discovering treatments for RYR1-related myopathies. To maximize the strengths of each animal model, Volpatti et al. combined them, developing a fast and powerful way to test new drugs. The first step is an automated screening process that trials thousands of chemicals on nematode worms. This takes just two weeks. The second step is to group the best treatments according to their chemical similarities and test them again in zebrafish. This takes a month. The third and final stage is to test promising chemicals from the zebrafish in mouse muscle cells. Of the thousands of compounds tested here, one group of chemicals stood out – treatments that block the activity of a protein called p38. Volpatti et al. found that blocking the p38 protein, either with drugs or by inactivating the gene that codes for it, changed muscle calcium release. This suggests p38 blockers may have potential as a treatment for RYR1-related myopathies in mammals. Using three types of animal to test new drugs maximizes the benefits of each model. This type of pipeline could identify new treatments, not just for RYR1-related myopathies, but for other diseases that involve genes or proteins that are similar across species. For RYR1-related myopathies specifically, the next step is to test p38 blocking treatments in mice. This could reveal whether the treatments have the potential to improve symptoms.


Conflict of interest statement

JV, YE, JK, LG, SB, RN, WZ, PR, RD, JD No competing interests declared

Figures

Figure 1.
Figure 1.. Schematic of our multi-species translational pipeline aimed at identifying potential therapeutic targets for RYR1-RM.
The pipeline involved screening C. elegans and zebrafish with thousands of compounds for suppressors of RYR1 mutant phenotypes, followed by further characterization in zebrafish and evaluation in mammalian cell lines.
Figure 2.
Figure 2.. Chemical screen finds that p38 MAPK inhibition suppresses the nemadipine-A growth arrest of unc-68 mutants.
(A) Schematic of our screen methodology showing the expected growth arrest phenotype of unc-68 worms exposed to 25 μM nemadipine after 6 days of exposure and the expected phenotype of a chemical that suppresses this growth arrest. (B) Summary of the 74 ‘hits’ from this screen that reproducibly suppressed nemadipine-induced growth arrest of unc-68 mutants. (C) Heat map visualization of Tanimoto scores from the ‘hit’ compounds (y-axis) screened from the 880 compounds in the GlaxoSmithKline Published Kinase Inhibitor set (x-axis). Tanimoto scores were calculated for each pair of compounds as a measure of structural similarity and similar clusters were identified via hierarchical clustering of Tanimoto scores (legend indicates the Tanimoto score). As shown, chemicals with similar molecular fingerprints are associated with similar annotated functions/targets. Fisher’s exact test was used to determine enrichment based on the number of structurally similar members in each cluster that were either hits or not hits out of the total number of the compounds in the library. (D) RNA interference targeting either pmk-1, pmk-2, pmk-3, or a combination of the three shows that p38 MAPK gene knockdown allows a greater proportion of individual unc-68 worms to escape nemadipine-A-induced growth arrest compared to an empty vector control. Statistical analysis by Kruskal-Wallis test, followed by Dunn's post-test; ns p=0.7360, *p=0.0246, **p=0.0031, ***p<0.001; left-right: n = 406, 364, 308, 292, 276, 266.
Figure 2—figure supplement 1.
Figure 2—figure supplement 1.. Phenotypes of unc-68 mutants considered for chemical screening.
(A) The ‘thrashing assay’ is performed by counting the waveforms propagated by individual C. elegans in one minute (Maryon et al., 1996). Consistent with previous reports (Maryon et al., 1996; Maryon et al., 1998), we found that unc-68 mutants thrash at a significantly lower rate than N2 (wild type) in two independent assays (n = 10 per genotype; Student’s T-test: ***p<0.001). (B) In both liquid and solid media, the DHPR inhibitor nemadipine-A (Kwok et al., 2006) induces concentration-dependent developmental growth arrest in unc-68(r1161) (strain TR2170) and unc-68(r1162) (strain TR2171) mutants. L1 larvae were plated in chemical at Day 0 (n = 20/well liquid 96-well plate; n = 50/well solid 24-well plate) and developmental stage was measured at Day 6 (liquid) and Day 5 (solid). Abbreviations: og = overgrown with larvae/eggs and food source depleted; tnc = larvae and eggs were too numerous to count, but food source not depleted; ne: no eggs have been laid (this phenotype is consistent with inhibition of egg-laying defective protein EGL-19, a DHPR, by nemadipine-A).
Figure 2—figure supplement 2.
Figure 2—figure supplement 2.. Post-hoc statistical analysis showing that 142 chemicals out of the 278 chemicals identified from the primary screen produced developmental stage distributions that were significantly different from random escapee wells (red arrows).
It is important to note that this was performed with the assumption that 20 worms were in each well as a means of estimating the proportion of actual L4 and adult counts in each well. In other words, we assumed #L1-L3 larvae = 20 – (#L4 + #adult). Plots shown are from independent screens of (A) 7.5 μM wactives, (B) 60 μM wactives, (C) 60 μM ‘random’ non-wactives, and (D) 60 μM US Drug Collection. Statistical analysis by Kruskal-Wallis test with Dunn’s multiple comparisons post-test where *p<0.05, **p<0.01, ***p<0.001.
Figure 2—figure supplement 3.
Figure 2—figure supplement 3.. Post-hoc statistical analysis showing that 142 chemicals out of the 278 chemicals identified from the primary screen produced developmental stage distributions that were significantly different from random escapee wells (red arrows).
It is important to note that this was performed with the assumption that 20 worms were in each well as a means of estimating the proportion of actual L4 and adult counts in each well. In other words, we assumed #L1-L3 larvae = 20 – (#L4 + #adult). Plots shown are from independent screens of (E) 60 μM GlaxoSmithKline Published Kinase Inhibitor set. Statistical analysis by Kruskal-Wallis test with Dunn’s multiple comparisons post-test where *p<0.05, **p<0.01, ***p<0.001.
Figure 2—figure supplement 4.
Figure 2—figure supplement 4.. Follow-up testing for compounds identified in the primary screen.
(A) Chemical dose-response re-testing of five compounds shows consistent ability to suppress nemadipine-A-induced growth arrest of unc-68 mutants. Note: wact-526 precipitated at 30 and 60 μM and rand-62 precipitated at 60 μM. (B–G) Post-hoc statistical analysis showing the developmental stage distributions of the 145 re-tested molecules from the primary screen, and identifying those that were significantly different from DMSO wells (red arrows). Again, it is important to note that this was performed while assuming that 20 worms were in each well as a means of estimating the proportion of actual L4 and adult counts in each well. In other words, we assumed #L1-L3 larvae = 20 – (#L4 + #adult). Plots shown are from independent screens of (B) 7.5 μM wactives, (C) 60 μM wactives, (D) 60 μM ‘random’ non-wactives, (E) 60 μM US Drug Collection and (F-G) 60 μM GlaxoSmithKline Published Kinase Inhibitor (PKI) set. In the PKI set, p38 inhibitors that suppressed growth arrest are highlighted by green arrows. Statistical analysis by Kruskal-Wallis test with Dunn’s multiple comparisons post-test where *p<0.05, **p<0.01, ***p<0.001.
Figure 2—figure supplement 5.
Figure 2—figure supplement 5.. Heat map visualization of Tanimoto scores from the ‘hit’ compounds (y-axis) screened from the 1280 compounds in the US Drug Collection library (x-axis).
Tanimoto scores were calculated for each pair of compounds as a measure of structural similarity and similar clusters were identified via hierarchical clustering of Tanimoto scores (legend indicates the Tanimoto score). As shown, chemicals with similar molecular fingerprints are associated with similar annotated functions/targets. Fisher’s exact test was used to determine enrichment based on the number of structurally similar members in each cluster that were either hits or not hits out of the total number of the compounds in the library.
Figure 3.
Figure 3.. Schematic of our zebrafish screen methodology showing the expected motility of unaffected siblings (‘WT Siblings’) and double mutants (‘Dbl Mut’) and expected motility of immotile double mutants if a chemical suppressed the phenotype.
We did not identify any suppressors of the double mutant phenotype.
Figure 3—figure supplement 1.
Figure 3—figure supplement 1.. Phenotypes of zebrafish ryr1 mutants considered for chemical screening.
(A) ryr1a;ryr1b double mutants exhibit complete lack of movement as shown by optovin-6b8 induced swimming (n = 24 per genotype; Student’s T-test: ***p<0.001). They do not respond to touch stimuli either data not shown; independently shown by Chagovetz et al. (2019). (B) The ryr1a;ryr1b double mutants exhibit early larval lethality with a median survival of 5 days and maximum survival of 7 days (n = 58 per group; Mantel-Cox: ***p<0.001). (C) The ryr1b mutants show significantly reduced movement speed (n = 48; 5.42 ± 0.1327 mm/s) at four dpf by optovin-6b8 induced swimming versus WT siblings (n = 47; 8.598 ± 0.2728 mm/s) (Student’s t-test: ***p<0.001). However, there is sufficient overlap with WT siblings to preclude large-scale screening.
Figure 4.
Figure 4.. Positive chemical-genetic interactions between p38 inhibitors and ryr1b mutants were observed using zebrafish larval movement speed as a readout.
Compared to the average speed of DMSO WT controls, treatment with (A) SB239063 and (B) PH-797804 reduced the average speed of WT siblings while the expected decrease in movement speed in treated ryr1b was not observed. The difference in average speed of ryr1b+p38 inhibitor compared to WT controls (i.e. WT siblings+DMSO vehicle) is higher than expected given the effects of genotype and chemical alone, indicative of a positive chemical-genetic interaction. Chemical-genetic interactions were not observed for p38 inhibitors (C) SB203580 and (D) SB202190. Data are presented as mean ± SEM movement speed (mm/s) normalized to DMSO-treated WT siblings for n = 2 independent experiments. Statistical analysis by two-way ANOVA followed by Tukey’s multiple comparisons post-test. *p<0.05, **p<0.01, ***p<0.001; Sample size n = 19 or 20 for each treatment group in a set.
Figure 4—figure supplement 1.
Figure 4—figure supplement 1.. Chemical-genetic interactions were tested using zebrafish larval movement speed as a readout.
Compared to the average speed of DMSO WT controls, treatment with (A) wact-405, (B) wact-488, (C) wact-526, (D) PI3K inhibitor PI-103, and (E) anthralin reduced the average speed of WT siblings while the expected decrease in movement speed in treated ryr1b was not observed. The difference in average speed of ryr1b+p38 inhibitor compared to WT controls (i.e. WT siblings+DMSO vehicle) is higher than expected given the effects of genotype and chemical alone, indicative of a positive chemical-genetic interaction. Chemical-genetic interactions were not observed for the remaining 18 hits from the C. elegans screen when tested in this assay (Figure 4—figure supplement 2–3F–W). Data are presented as mean ± SEM movement speed (mm/s) normalized to DMSO-treated WT siblings for n = 2 independent experiments for (A–E), (G), (H), (K), (L), and R), where sample size n = 19 or 20 for each treatment group in a set and n = 1 experiment and sample size n = 9 or 10 for the remainder. Statistical analysis by two-way ANOVA followed by Tukey’s multiple comparisons post-test. *p<0.05, **p<0.01, ***p<0.001.
Figure 4—figure supplement 2.
Figure 4—figure supplement 2.. Chemical-genetic interactions were tested using zebrafish larval movement speed as a readout.
Compared to the average speed of DMSO WT controls, chemical-genetic interactions were not observed for 18 hits from the C. elegans screen when tested in this assay (Figure 4—figure supplement 2–3F–W). Data are presented as mean ± SEM movement speed (mm/s) normalized to DMSO-treated WT siblings for n = 2 independent experiments for (A–E), (G), (H), (K), (L), and (R), where sample size n = 19 or 20 for each treatment group in a set and n = 1 experiment and sample size n = 9 or 10 for the remainder. Statistical analysis by two-way ANOVA followed by Tukey’s multiple comparisons post-test. *p<0.05, **p<0.01, ***p<0.001.
Figure 4—figure supplement 3.
Figure 4—figure supplement 3.. Chemical-genetic interactions were tested using zebrafish larval movement speed as a readout.
Compared to the average speed of DMSO WT controls, chemical-genetic interactions were not observed for 18 hits from the C. elegans screen when tested in this assay (Figure 4—figure supplement 2–3F–W). Data are presented as mean ± SEM movement speed (mm/s) normalized to DMSO-treated WT siblings for n = 2 independent experiments for (A–E), (G), (H), (K), (L), and (R), where sample size n = 19 or 20 for each treatment group in a set and n = 1 experiment and sample size n = 9 or 10 for the remainder. Statistical analysis by two-way ANOVA followed by Tukey’s multiple comparisons post-test. *p<0.05, **p<0.01, ***p<0.001.
Figure 5.
Figure 5.. Intracellular calcium measurement in C2C12 myotubes.
Ratiometric fura-2 imaging with 10 mM caffeine induction after treatment with p38 inhibitors (A) SB203580 (# of myotubes from left-right: n = 56, 30, 28, 43, 45, 57, 46, 79) and (B) SB202190 (n = 78, 44, 25, 45, 50, 58, 50, 142) or after (C) siRNA targeting p38α (Mapk14), p38β (Mapk11), and p38γ (Mapk12) (n = 17, 27,18, 23, 11, 11, 33, 13). Panels on the left show the peak change in calcium concentration within 30 s of adding caffeine normalized to the average of 10 s of baseline resting free Ca2+ concentration ([Ca2+]i), that is normalized Δ ratio, while plots on the right show calcium levels normalized to [Ca2+]i after addition of caffeine. This data shows that p38 inhibition or knockdown impairs Ca2+ release in wild type myotubes while promoting some Ca2+ release in Ryr1 knockout cells. Note: labels directly above each group indicate the statistical significance compared to DMSO control within the same genotype. Data are presented as mean ± SEM derived from Ca2+ measurements of individual myotubes (Figure 5—figure supplement 3A–C). Corresponding plots showing [Ca2+]i levels without normalization are also provided (Figure 5—figure supplement 4D–F). Statistical analysis by two-way ANOVA followed by Tukey’s multiple comparisons post-test where *p<0.05, **p<0.01, ***p<0.001. (D) Overnight treatment of myotubes from Y522S mutant mice with 10 μM SB203580 significantly reduced a temperature-dependent increase in resting Ca2+ concentration.
Figure 5—figure supplement 1.
Figure 5—figure supplement 1.. Characterization of Ryr1 knockout (KO) C2C12 cells.
(A) DNA sequence of Ryr1 KO showing frameshift mutation and premature stop codon. (B) Western blotting analysis of RyR1 in C2C12 myotubes at after 5 days of differentiation.
Figure 5—figure supplement 2.
Figure 5—figure supplement 2.. Quantitative PCR analysis was performed to validate the efficiency of siRNA knockdown of three p38 MAPK genes in both WT and Ryr1 KO myotubes.
As shown, the siRNAs reduce target gene expression by >50% in WT cells (A) while the degree of knockdown achieved in Ryr1 KO myotubes (B) was more variable. Data are presented as mean ± SEM fold change for n = 3 independent myotube cultures. Statistical analysis by one-way ANOVA followed by Holm-Sidak’s multiple comparisons post-test to compare each group to the negative control siRNA. *p<0.05, **p<0.01, ***p<0.001.
Figure 5—figure supplement 3.
Figure 5—figure supplement 3.. Intracellular calcium measurement in C2C12 myotubes.
Ratiometric fura-2 imaging with 10 mM caffeine induction after treatment with A) SB203580, (B) SB202190, and C) p38 MAPK siRNAs. Black lines indicate individual myofibers while red lines present the mean ± SEM as show in Figure 5. Ratiometric 340/380 data were normalized to the average of 10 s of baseline resting free Ca2+ concentration ([Ca2+]i), that is normalized Δ ratio.
Figure 5—figure supplement 4.
Figure 5—figure supplement 4.. Intracellular calcium measurement in C2C12 myotubes.
Ratiometric fura-2 imaging with 10 mM caffeine induction after treatment with D) SB203580, (E) SB202190, and F) p38 MAPK siRNAs. Panels on the left show the peak change in calcium concentration from [Ca2+]i within 30 s of adding caffeine without normalization (i.e. Δ ratio), while plots on the right show [Ca2+]i followed by changes in fura-2 340/380 nm ratio after addition of caffeine.

Comment in

  • From worms to fish to mice.
    Benian GM, Choo HJ. Benian GM, et al. Elife. 2020 May 6;9:e57481. doi: 10.7554/eLife.57481. Elife. 2020. PMID: 32372758 Free PMC article.

References

    1. Amburgey K, Bailey A, Hwang JH, Tarnopolsky MA, Bonnemann CG, Medne L, Mathews KD, Collins J, Daube JR, Wellman GP, Callaghan B, Clarke NF, Dowling JJ. Genotype-phenotype correlations in recessive RYR1-related myopathies. Orphanet Journal of Rare Diseases. 2013;8:117. doi: 10.1186/1750-1172-8-117. - DOI - PMC - PubMed
    1. Andersson DC, Betzenhauser MJ, Reiken S, Meli AC, Umanskaya A, Xie W, Shiomi T, Zalk R, Lacampagne A, Marks AR. Ryanodine receptor oxidation causes intracellular calcium leak and muscle weakness in aging. Cell Metabolism. 2011;14:196–207. doi: 10.1016/j.cmet.2011.05.014. - DOI - PMC - PubMed
    1. Avila G, Dirksen RT. Functional impact of the ryanodine receptor on the skeletal muscle L-type ca(2+) channel. Journal of General Physiology. 2000;115:467–480. doi: 10.1085/jgp.115.4.467. - DOI - PMC - PubMed
    1. Baines KN, Ferreira C, Hopkins PM, Shaw M-A, Hope IA. Aging Effects of Caenorhabditis elegans Ryanodine Receptor Variants Corresponding to Human Myopathic Mutations. G3: Genes|Genomes|Genetics. 2017;7:1451–1461. doi: 10.1534/g3.117.040535. - DOI - PMC - PubMed
    1. Baryshnikova A, Costanzo M, Myers CL, Andrews B, Boone C. Genetic interaction networks: toward an understanding of heritability. Annual Review of Genomics and Human Genetics. 2013;14:111–133. doi: 10.1146/annurev-genom-082509-141730. - DOI - PubMed

Publication types

MeSH terms

Substances

Grants and funding