. 2020 Mar 29;12(6):5516-5538.
doi: 10.18632/aging.102985. Epub 2020 Mar 29.

Microarray analysis of verbenalin-treated human amniotic epithelial cells reveals therapeutic potential for Alzheimer's Disease

Affiliations

Microarray analysis of verbenalin-treated human amniotic epithelial cells reveals therapeutic potential for Alzheimer's Disease

Farhana Ferdousi et al. Aging (Albany NY). .

Abstract

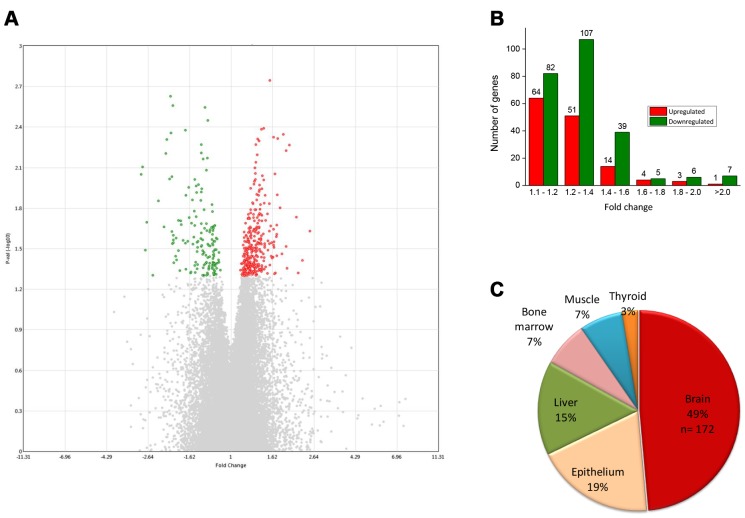
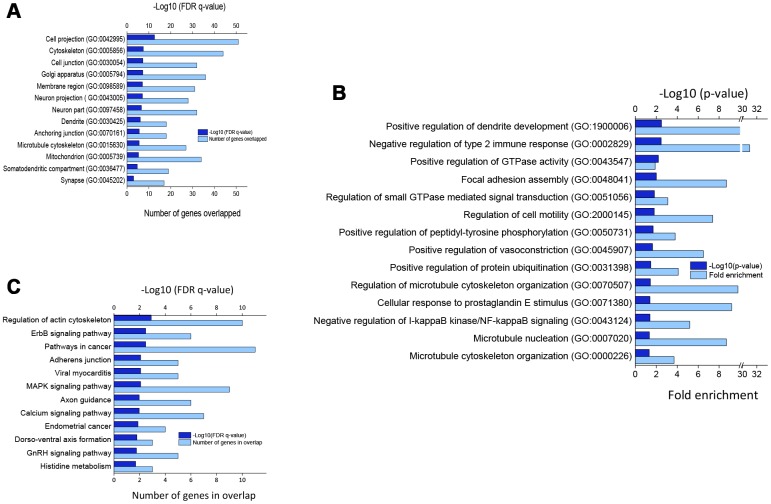
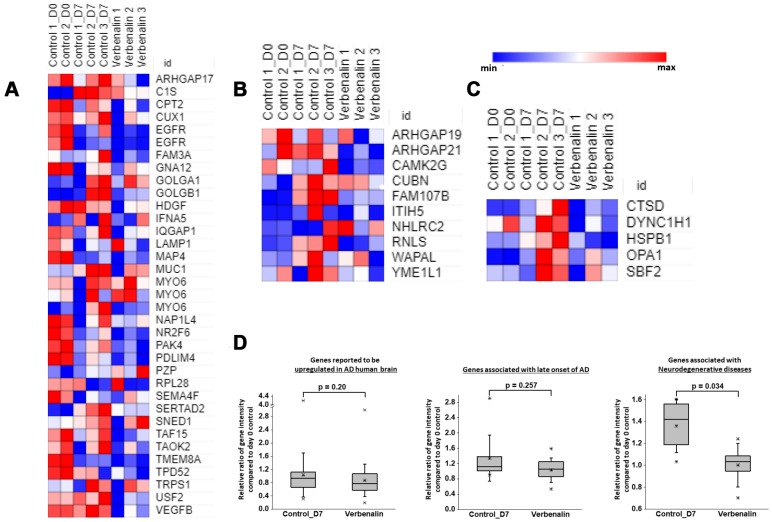
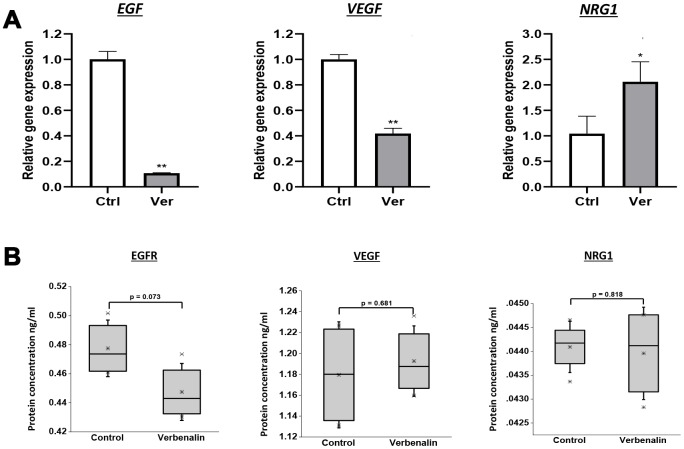
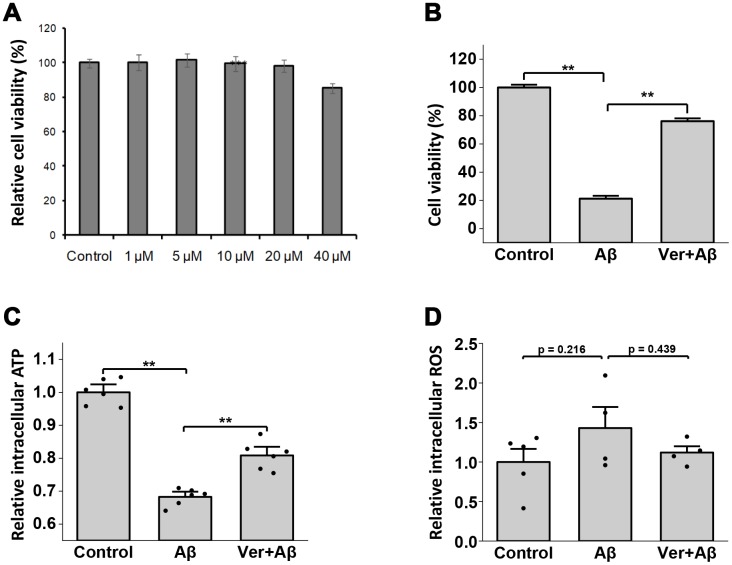
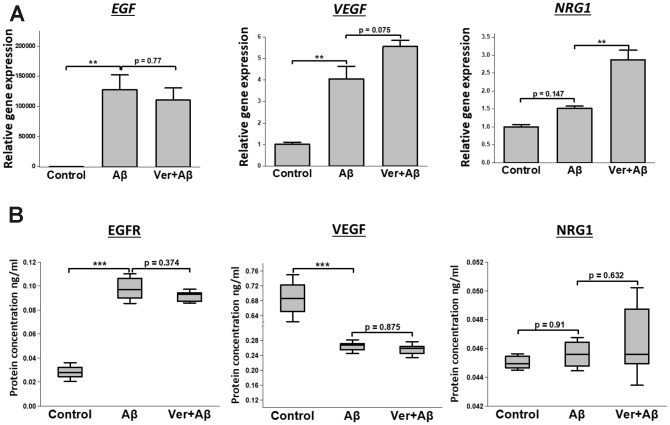
Alzheimer's disease (AD) has become a major world health problem as the population ages. There is still no available treatment that can stop or reverse the progression of AD. Human amnion epithelial cells (hAECs), an alternative source for stem cells, have shown neuroprotective and neurorestorative potentials when transplanted in vivo. Besides, studies have suggested that stem cell priming with plant-derived bioactive compounds can enhance stem cell proliferation and differentiation and improve the disease-treating capability of stem cells. Verbenalin is an iridoid glucoside found in medicinal herbs of Verbenaceae family. In the present study, we have conducted microarray gene expression profiling of verbenalin-treated hAECs to explore its therapeutic potential for AD. Gene set enrichment analysis revealed verbenalin treatment significantly enriched AD-associated gene sets. Genes associated with lysosomal dysfunction, pathologic angiogenesis, pathologic protein aggregation, circadian rhythm, age-related neurometabolism, and neurogenesis were differentially expressed in the verbenalin-treated hAECs compared to control cells. Additionally, the neuroprotective effect of verbenalin was confirmed against amyloid beta-induced neurotoxicity in human neuroblastoma SH-SY5Y cells. Our present study is the first to report the therapeutic potential of verbenalin for AD; however, further in-depth research in the in vitro and in vivo models are required to confirm our preliminary findings.

Keywords: Alzheimer’s disease; human amnion epithelial cell; microarray analysis; natural compound; verbenalin.


Conflict of interest statement

CONFLICTS OF INTEREST: The authors declare no conflicts of interest.

Figures

Figure 1
Figure 1
(A) Volcano plot displaying DEGs between verbenalin-treated and untreated-control hAECs on day 7 (performed in Transcriptome Analysis Console version 4 software). The vertical axis (y-axis) corresponds to -log10 p-value of the ANOVA p-values, and the horizontal axis (x-axis) displays linear fold change. The red dots represent the up-regulated genes; the green dots represent the downregulated genes. (B) Distribution of fold changes in mRNA expression levels in verbenalin-treated hAECs (C) Pie chart showing the enriched (p < 0.05) tissue expressions by the DEGs between verbenalin-treated and untreated-control hAECs on day 7 (analyzed by DAVID online tool).
Figure 2
Figure 2
(A) Significantly enriched cellular components for DEGs. (B) Top biological processes as per p-value (modified Fisher’s exact) by DEGs. (C) Significantly enriched KEGG pathways by DEGs (p < 0.05; modified Fisher’s exact test). All the gene ontology enrichment analyses were performed using DAVID online tool.
Figure 3
Figure 3
Heat maps showing relative expression intensity of genes reported to be (A) upregulated in AD human brain, (B) strongly associated with late-onset of AD, (C) associated with neurodegenerative diseases in untreated control hAECs on day 0 and day 7, and in verbenalin-treated hAECs on day 7. (D) Boxplots for the relative ratios of gene intensity (genes presented in the heat maps) in day 7 control (Control_D7) and verbenalin-treated hAECs compared with day 0 control. Box ranges from 25th to 75th percentile, the line in the middle represents the median value, the whiskers represent the min, max, and mean values, and the error bar represents the SD. Significance was computed by One-way ANOVA for linear distribution and Mann-Whitney U test for nonlinear distribution. Heat maps were generated using Morpheus online tool.
Figure 4
Figure 4
Effect of verbenalin treatment on the expressions of EGF, VEGF, and NRG1. The hAECs were treated with 20 μM of verbenalin (Ver) for 7 days, while the control cells were maintained in the placental basal medium. (A) Gene expressions were evaluated by real-time PCR. Each value represents the mean ± SD (n = 3). Asterisks refer to statistical significance (*p < 0.05, **p < 0.01) by One-way ANOVA as compared with control (Ctrl). (B) Boxplots of protein concentration (ng/ml) obtained by ELISA (n = 4). Box ranges from 25th to 75th percentile, the line in the middle represents the median value, the whiskers represent the min, max, and mean values, and the error bar represents the SD. The difference in protein concentration between treatment and control group was measured using One-way ANOVA for linear distribution.
Figure 5
Figure 5
Neuroprotective effects of verbenalin (Ver) on amyloid beta (Aβ)-induced toxicity in human neuroblastoma SH-SY5Y cells. (A) Cells were exposed to verbenalin at concentrations of 1, 5, 10, 20, and 40 μM for 72 h. The control cells were not treated. Cell viability was measured by the MTT assay and was calculated as a percentage of that in the control group (100%). The results are expressed as the means ± standard error of the mean (SEM) of independent experiments (n = 6, 96-well plate). ***p < 0.001 as compared to control. Cells were pre-treated with 20 μM verbenalin for 24 h and then exposed to 5 μM Aβ for 72 h. The results are expressed as the means ± standard error of the mean (SEM) of independent experiments (n = 6, 96-well plate). p < 0.1, *p < 0.05, **p < 0.01 compared with the group exposed to Aβ only (ANOVA followed by Dunnett’s multiple comparisons test). (B) Cell viability was measured by the MTT assay and was calculated as a percentage of that in the control group (100%). (C) A bioluminescence assay was used to measure cellular ATP levels, and the results are shown as relative intracellular ATP levels. (D) Levels of intracellular reactive oxygen species (ROS) were measured using a fluorescence cell-based assay, and results are shown as relative intracellular ROS (n=4).
Figure 6
Figure 6
Effect of verbenalin treatment on the expressions of EGF, VEGF, and NRG1 in Aβ-induced human neuroblastoma SH-SY5Y cells. (A) Gene expressions were evaluated by real-time PCR. Each value represents the mean ± SD (n = 4). (B) Boxplots of protein concentration (ng/ml) obtained by ELISA (n = 4). Box ranges from 25th to 75th percentile; the line in the middle represents the median value; the error bar represents the SD. Asterisks refer to statistical significance (*p < 0.05, **p < 0.01, ***p < 0.001) by One-way ANOVA followed by Dunnett’s multiple comparisons test (for linear distribution) as compared with only Aβ-treated group.

References

    1. McKhann G, Drachman D, Folstein M, Katzman R, Price D, Stadlan EM. Clinical diagnosis of Alzheimer’s disease: report of the NINCDS-ADRDA Work Group under the auspices of Department of Health and Human Services Task Force on Alzheimer’s Disease. Neurology. 1984; 34:939–44. 10.1212/WNL.34.7.939 - DOI - PubMed
    1. Kumar A, Singh A, Ekavali. A review on Alzheimer’s disease pathophysiology and its management: an update. Pharmacol Rep. 2015; 67:195–203. 10.1016/j.pharep.2014.09.004 - DOI - PubMed
    1. Thies W, Bleiler L. Alzheimer’s disease facts and figures. Alzheimers Dement. 2011; 2011:7. - PubMed
    1. Lane RF, Dacks PA, Shineman DW, Fillit HM. Diverse therapeutic targets and biomarkers for Alzheimer’s disease and related dementias: report on the Alzheimer’s Drug Discovery Foundation 2012 International Conference on Alzheimer’s Drug Discovery. Alzheimers Res Ther. 2013; 5:5. 10.1186/alzrt159 - DOI - PMC - PubMed
    1. Felsenstein KM, Candelario KM, Steindler DA, Borchelt DR. Regenerative medicine in Alzheimer’s disease. Transl Res. 2014; 163:432–38. 10.1016/j.trsl.2013.11.001 - DOI - PMC - PubMed

Publication types

MeSH terms