. 2020 Mar 26;12(4):792.
doi: 10.3390/cancers12040792.

Analysis of HPV-Positive and HPV-Negative Head and Neck Squamous Cell Carcinomas and Paired Normal Mucosae Reveals Cyclin D1 Deregulation and Compensatory Effect of Cyclin D2

Affiliations

Analysis of HPV-Positive and HPV-Negative Head and Neck Squamous Cell Carcinomas and Paired Normal Mucosae Reveals Cyclin D1 Deregulation and Compensatory Effect of Cyclin D2

Jiří Novotný et al. Cancers (Basel). .

Abstract

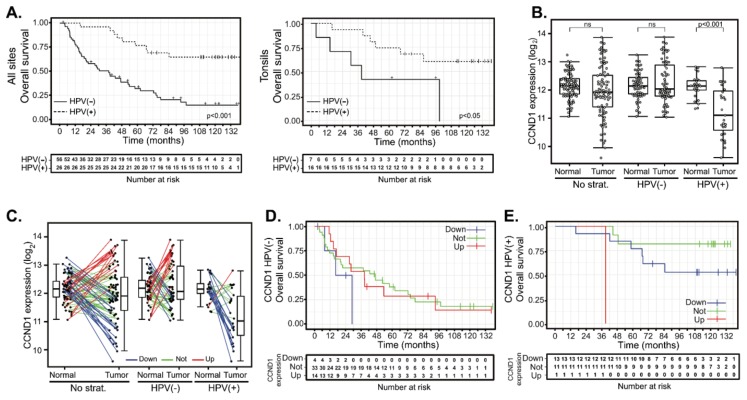
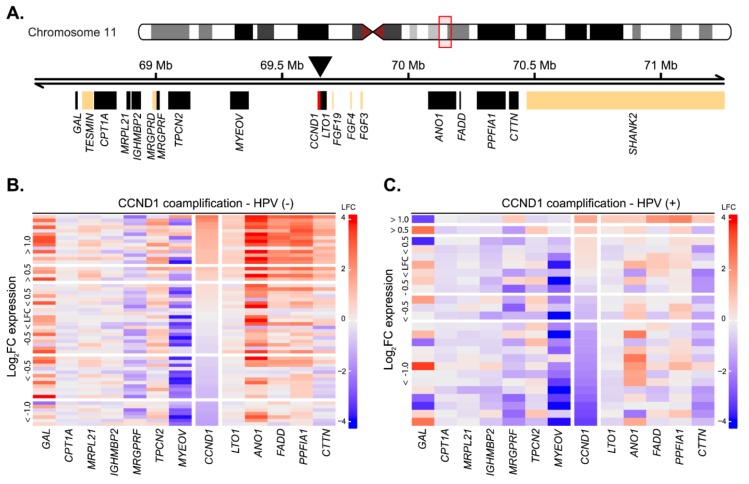
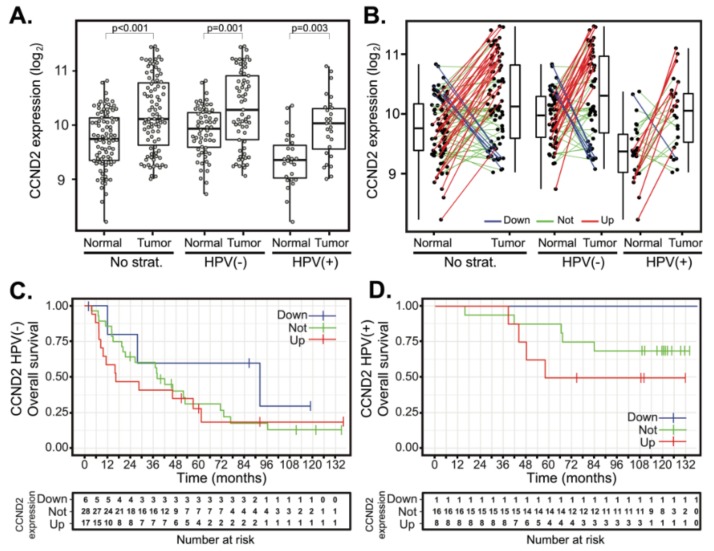
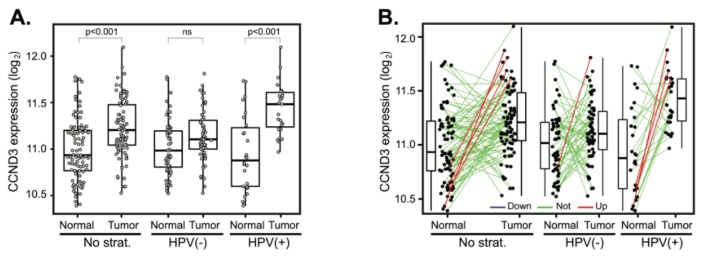
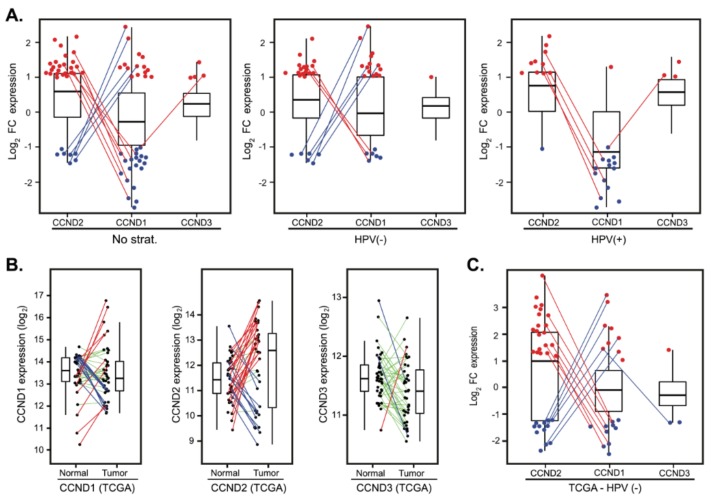
Aberrant regulation of the cell cycle is a typical feature of all forms of cancer. In head and neck squamous cell carcinoma (HNSCC), it is often associated with the overexpression of cyclin D1 (CCND1). However, it remains unclear how CCND1 expression changes between tumor and normal tissues and whether human papillomavirus (HPV) affects differential CCND1 expression. Here, we evaluated the expression of D-type cyclins in a cohort of 94 HNSCC patients of which 82 were subjected to whole genome expression profiling of primary tumors and paired normal mucosa. Comparative analysis of paired samples showed that CCND1 was upregulated in 18% of HNSCC tumors. Counterintuitively, CCND1 was downregulated in 23% of carcinomas, more frequently in HPV-positive samples. There was no correlation between the change in D-type cyclin expression and patient survival. Intriguingly, among the tumors with downregulated CCND1, one-third showed an increase in cyclin D2 (CCND2) expression. On the other hand, one-third of tumors with upregulated CCND1 showed a decrease in CCND2. Collectively, we have shown that CCND1 was frequently downregulated in HNSCC tumors. Furthermore, regardless of the HPV status, our data suggested that a change in CCND1 expression was alleviated by a compensatory change in CCND2 expression.

Keywords: 11q13 amplification; CCND1; CCND2; CCND3; D-type cyclins; cell cycle; head and neck squamous cell carcinoma; human papillomavirus; paired tumor-normal samples; patient survival.


Conflict of interest statement

The authors declare no conflicts of interest. The funders had no role in the design of the study; in the collection, analyses or interpretation of data; in the writing of the manuscript or in the decision to publish the results.

Figures

Figure 1
Figure 1
CCND1 gene expression changes between tumor and normal tissues and patient survival in human papillomavirus (HPV) (+) and HPV(−) groups. (A) Kaplan-Meier plots of overall survival (OS) for HPV(−) and HPV(+) groups: entire cohort (left panel, n = 82) and tonsillar carcinoma (right panel, n = 23). (B) CCND1 gene expression in a cohort of 94 patients (left panel) and stratified according to the HPV status (middle and right panel). The boxplot displays interquartile range with the whiskers indicating the greatest and smallest observations, excluding outliers. (C) CCND1 deregulation between paired tumor and normal tissues. Paired samples are connected by the lines color-coded according to the change of CCND1 expression (red—CCND1 upregulation, fold-changes (FC) > 2; green—no deregulation, 0.5 < FC < 2 and blue—CCND1 downregulation, FC < 0.5). (D) Kaplan–Meier plots for OS stratified according to CCND1 gene deregulation in the HPV(−) group. (E) Kaplan–Meier plot for OS by CCND1 deregulation in the HPV(+) group. Up—group with CCND1 upregulated, not—group without CCND1 deregulation and down—group with CCND1 downregulated. Tick marks and crosses in (A,D,E) indicate right censoring.
Figure 2
Figure 2
CCND1 gene locus amplification as estimated from expression changes between tumor and normal tissues in HPV(+) and HPV(−) patient groups. (A) Schematics of the CCND1 gene locus spanning ~ 2 Mb indicating position of the surrounding genes. Position of the CCND1 gene (red) is indicated by the arrowhead. Black rectangles indicate expressed genes, and beige rectangles indicate genes expressed below the detection threshold. Position on chromosome 11 is given in Mb, million base pairs. (B) Heatmap of gene expression changes between tumor and normal tissues in the HPV(−) group for expressed genes from the CCND1 locus. LFC—log2 fold-change in expression. (C) Heatmap of gene expression changes between tumor and normal tissues in the HPV(+) group for expressed genes from the CCND1 locus.
Figure 3
Figure 3
CCND2 gene expression changes between tumor and normal tissues and patient survival in HPV(+) and HPV(−) groups. (A) CCND2 gene expression in a cohort of 94 patients (left panel) and stratified according to the HPV status (middle and right panels). The boxplot displays interquartile range with the whiskers indicating the greatest and smallest observations, excluding outliers. (B) CCND2 deregulation between paired tumor and normal tissues. Paired samples are connected by the lines color-coded according to the change of CCND2 expression (red—CCND2 upregulation, FC > 2; green—no deregulation, 0.5 < FC < 2 and blue—CCND2 downregulation, FC < 0.5). (C,D) Kaplan–Meier plots for OS stratified according to CCND2 gene deregulation in HPV(−) and HPV(+) groups. Up—group with CCND2 upregulated, not—group without CCND2 deregulation and down—CCND2 group with CCND2 downregulated. Tick marks in (C,D) indicate right censoring.
Figure 4
Figure 4
CCND3 gene expression changes between tumor and normal tissues. (A) CCND3 gene expression in a cohort of 94 patients (left panel) and stratified according to the HPV status (middle and right panels). The boxplot displays interquartile range with the whiskers indicating the greatest and smallest observations, excluding outliers. (B) CCND3 deregulation between paired tumor and normal tissues. Paired samples are connected by the lines color-coded according to the change of CCND3 expression (red—CCND3 upregulation, FC > 2; green—no deregulation, 0.5 < FC < 2 and blue—CCND3 downregulation, FC < 0.5).
Figure 5
Figure 5
Compensatory expression of CCND2 in tumors with deregulated CCND1. (A) D-type cyclins expression changes presented as log2 fold-change between tumor and normal tissues in a cohort of 82 patients (left panel) and stratified according to the HPV status (middle and right panels). For clarity, only tumors with FC > 2 (red dots) and FC < 0.5 (blue dots) are shown. Lines connect the same patients. (B) D-type cyclins deregulation between paired tumor and normal tissues in The Cancer Genome Atlas (TCGA) cohort of 39 HPV(−) patients. Paired samples are connected by the lines color-coded according to the change in D-type cyclin expression (red—upregulation, FC > 2; green—no deregulation, 0.5 < FC < 2 and blue—downregulation, FC < 0.5). (C) D-type cyclins expression changes presented as log2 fold-change between paired tumor and normal tissues in the TCGA cohort of 39 HPV(−) patients. For clarity, only tumors with FC > 2 (red dots) and FC < 0.5 (blue dots) are shown. Lines connect the same patients.
Figure 6
Figure 6
Immunohistochemistry of cyclin D1 and cyclin D2 expression in head and neck squamous cell carcinomas (n = 10). (A) Low-to-medium intensity staining of cyclin D1 was detected in all tumor samples. The staining of cyclin D2 was negative in three cases. (B) Nuclear and cytoplasmic distribution of cyclin D1 and cyclin D2 staining in the tumor samples. (C,D) In cases with high nuclear intensity of cyclin D1 (panel C), the nuclear staining of cyclin D2 was weak or negative (panel D). (E,F) Vice versa, higher intensity of cyclin D2 (panel F) was observed in tumor buds with a lack of nuclear cyclin D1 (panel E). Inset in panel E shows a negative control. The bar is 0.1 mm.

References

    1. Ferlay J., Shin H.R., Bray F., Forman D., Mathers C., Parkin D.M. Estimates of worldwide burden of cancer in 2008: GLOBOCAN 2008. Int. J. Cancer. 2010;127:2893–2917. doi: 10.1002/ijc.25516. - DOI - PubMed
    1. Ferlay J., Steliarova-Foucher E., Lortet-Tieulent J., Rosso S., Coebergh J.W.W., Comber H., Forman D., Bray F. Cancer incidence and mortality patterns in Europe: Estimates for 40 countries in 2012. Eur. J. Cancer. 2013;49:1374–1403. doi: 10.1016/j.ejca.2012.12.027. - DOI - PubMed
    1. Kalavrezos N., Bhandari R. Current trends and future perspectives in the surgical management of oral cancer. Oral Oncol. 2010;46:429–432. doi: 10.1016/j.oraloncology.2010.03.007. - DOI - PubMed
    1. Fung C., Grandis J.R. Emerging drugs to treat squamous cell carcinomas of the head and neck. Expert Opin. Emerg. Drugs. 2010;15:355–373. doi: 10.1517/14728214.2010.497754. - DOI - PMC - PubMed
    1. Hashibe M., Brennan P., Chuang S.C., Boccia S., Castellsague X., Chen C., Curado M.P., Dal Maso L., Daudt A.W., Fabianova E., et al. Interaction between Tobacco and Alcohol Use and the Risk of Head and Neck Cancer: Pooled Analysis in the International Head and Neck Cancer Epidemiology Consortium. Cancer Epidemiol. Biomark. Prev. 2009;18:541–550. - PMC - PubMed