. 2020 Mar 26;12(4):795.
doi: 10.3390/cancers12040795.

Tetraspanin CD9 is Regulated by miR-518f-5p and Functions in Breast Cell Migration and In Vivo Tumor Growth

Affiliations

Tetraspanin CD9 is Regulated by miR-518f-5p and Functions in Breast Cell Migration and In Vivo Tumor Growth

Danielle R Bond et al. Cancers (Basel). .

Abstract

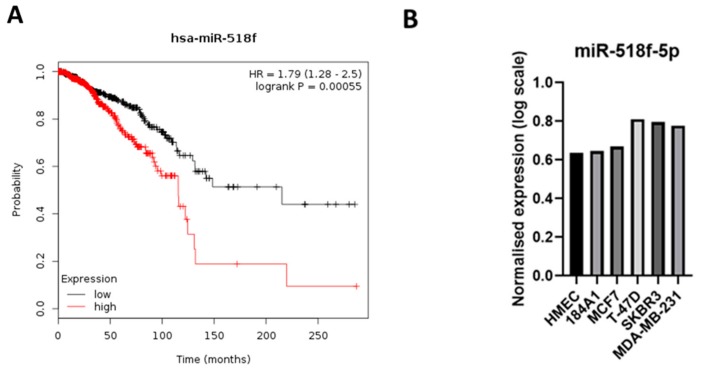
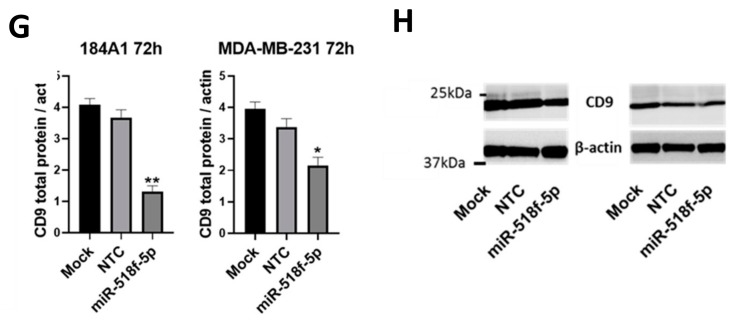
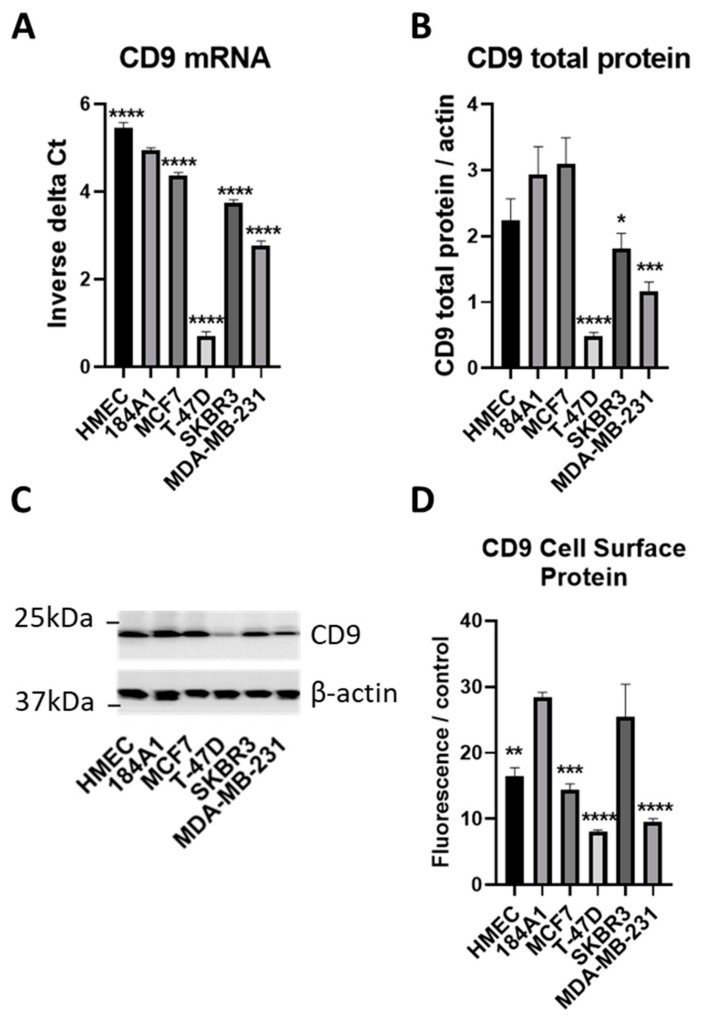
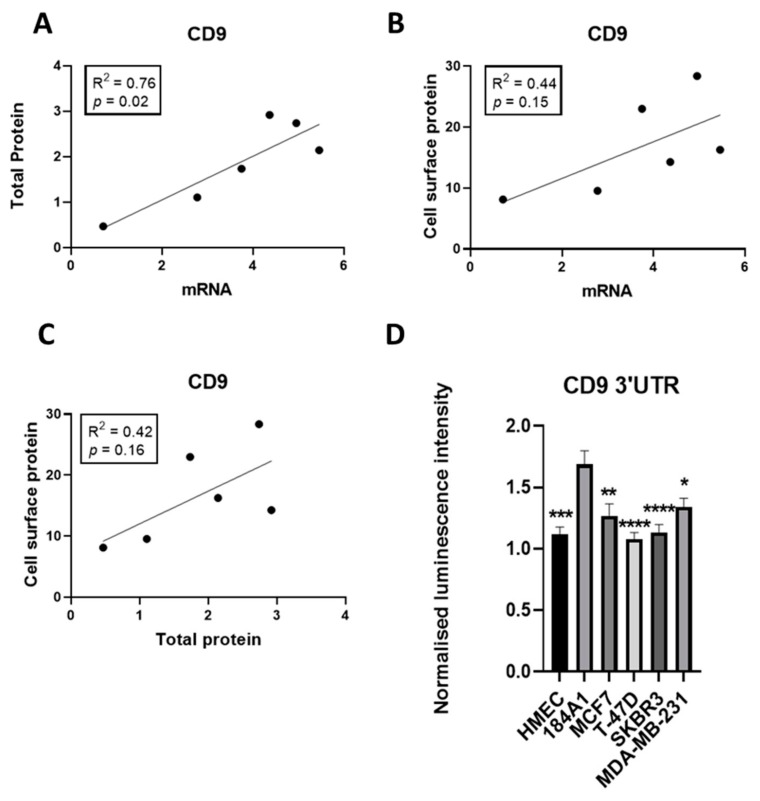
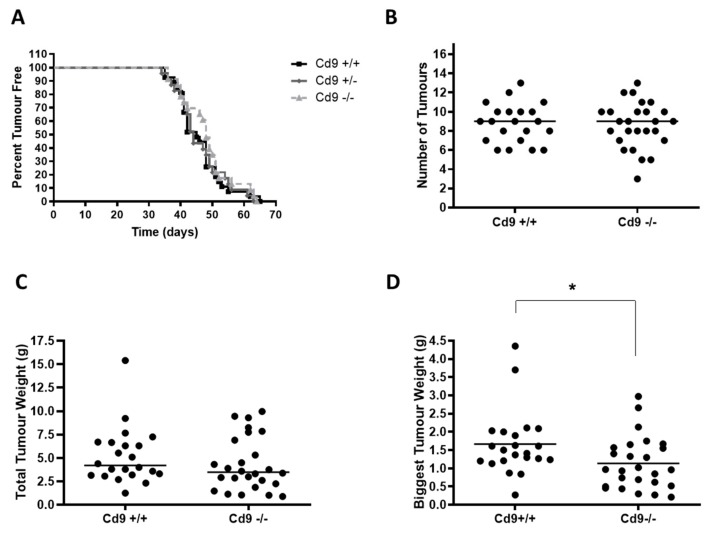
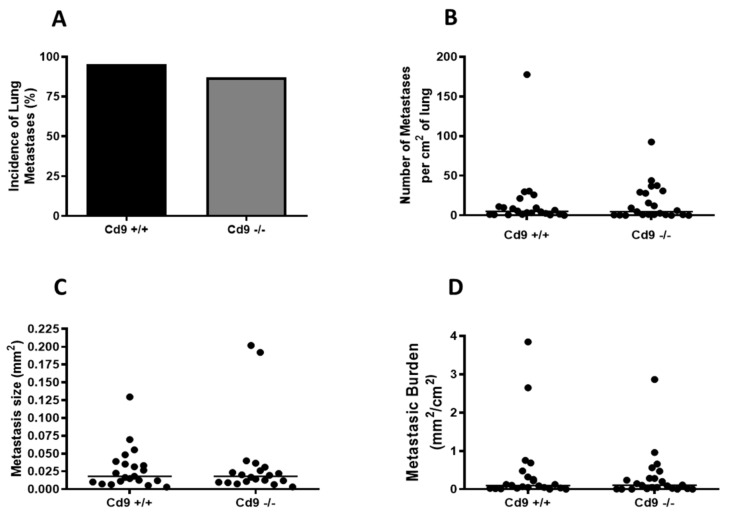
Breast cancer is the most commonly diagnosed and the second leading cause of cancer-related mortality among women worldwide. miR-518f-5p has been shown to modulate the expression of the metastasis suppressor CD9 in prostate cancer. However, the role of miR-518f-5p and CD9 in breast cancer is unknown. Therefore, this study aimed to elucidate the role of miR-518f-5p and the mechanisms responsible for decreased CD9 expression in breast cancer, as well as the role of CD9 in de novo tumor formation and metastasis. miR-518f-5p function was assessed using migration, adhesion, and proliferation assays. miR-518f-5p was overexpressed in breast cancer cell lines that displayed significantly lower CD9 expression as well as less endogenous CD9 3'UTR activity, as assessed using qPCR and dual luciferase assays. Transfection of miR-518f-5p significantly decreased CD9 protein expression and increased breast cell migration in vitro. Cd9 deletion in the MMTV/PyMT mouse model impaired tumor growth, but had no effect on tumor initiation or metastasis. Therefore, inhibition of miR-518f-5p may restore CD9 expression and aid in the treatment of breast cancer metastasis.

Keywords: CD9; breast cancer; miR-518f-5p; migration; regulation.


Conflict of interest statement

The authors declare no conflict of interest.

Figures

Figure 1
Figure 1
miR-518f-5p expression correlates with poor overall survival in breast cancer and its expression is increased in breast cancer cell lines. (A). Kaplan–Meier plot of miR-518f expression compared to the probability of overall survival of breast cancer patients (n = 1061 from TCGA), generated using miRpower [22]. (B). Micro-RNA microarray results which show miR-518f-5p expression across a panel of non-tumorigenic and tumorigenic breast cell lines (n = 1).
Figure 2
Figure 2
Transfection of miR-518f-5p mimic increases breast cell migration and decreases CD9 protein levels. (A). Cell migration in 184A1 cells following transfection of a miR-518f-5p mimic assessed using transwell migration assay. (B). Migration of MDA-MB-231 cells following transfection of miR-518f-5p mimic. Migration assay results are shown as fluorescence intensity (arbitrary units), * p = 0.02, ** p = 0.002. (C). Proliferation of 184A1 cells using the resazurin assay, after transfection of miR-518f-5p mimic. (D). MDA-MB-231 proliferation following transfection of a miR-518f-5p mimic, as measured using resazurin assay. Cell proliferation results are shown as fold change fluorescence relative to 24 h fluorescence (arbitrary units). (E). Changes in cell adhesion to basement membrane extract (BME) and fibronectin (FN) were assessed using an adhesion assay, following transfection with miR-518f-5p mimic in 184A1 cells. (F). Cell adhesion was assessed in MDA-MB-231 cells following transfection of miR-518f-5p mimic. Adhesion results are expressed as a ratio of adhesion (fluorescence intensity of adherent cells compared to total seeded cells, arbitrary units), FN: * p = 0.04, BME: * p = 0.01, n = 3. (G). Total CD9 protein expression was measured using SDS-PAGE and western blotting, following transfection of a miR-518f-5p mimic in 184A1 (left) and MDA-MB-231 cells (right) for 72 h. (H). Representative western blots of CD9 total protein expression following transfection with miR-518f-5p mimic for 72 h. Results shown as CD9 total protein normalized to beta actin protein expression, n = 3, * p = 0.04, ** p = 0.001. See Figure S1 for full western blotting images.
Figure 2
Figure 2
Transfection of miR-518f-5p mimic increases breast cell migration and decreases CD9 protein levels. (A). Cell migration in 184A1 cells following transfection of a miR-518f-5p mimic assessed using transwell migration assay. (B). Migration of MDA-MB-231 cells following transfection of miR-518f-5p mimic. Migration assay results are shown as fluorescence intensity (arbitrary units), * p = 0.02, ** p = 0.002. (C). Proliferation of 184A1 cells using the resazurin assay, after transfection of miR-518f-5p mimic. (D). MDA-MB-231 proliferation following transfection of a miR-518f-5p mimic, as measured using resazurin assay. Cell proliferation results are shown as fold change fluorescence relative to 24 h fluorescence (arbitrary units). (E). Changes in cell adhesion to basement membrane extract (BME) and fibronectin (FN) were assessed using an adhesion assay, following transfection with miR-518f-5p mimic in 184A1 cells. (F). Cell adhesion was assessed in MDA-MB-231 cells following transfection of miR-518f-5p mimic. Adhesion results are expressed as a ratio of adhesion (fluorescence intensity of adherent cells compared to total seeded cells, arbitrary units), FN: * p = 0.04, BME: * p = 0.01, n = 3. (G). Total CD9 protein expression was measured using SDS-PAGE and western blotting, following transfection of a miR-518f-5p mimic in 184A1 (left) and MDA-MB-231 cells (right) for 72 h. (H). Representative western blots of CD9 total protein expression following transfection with miR-518f-5p mimic for 72 h. Results shown as CD9 total protein normalized to beta actin protein expression, n = 3, * p = 0.04, ** p = 0.001. See Figure S1 for full western blotting images.
Figure 3
Figure 3
CD9 expression is decreased in non-tumorigenic and tumorigenic breast cell lines. (A). CD9 mRNA expression was measured using qPCR in a panel of non-tumorigenic and tumorigenic breast cell lines. Results are shown as inverse delta Ct. (B). CD9 total protein expression was assessed using SDS-PAGE and western blotting. Results expressed as CD9 total protein normalized to beta actin expression. (C). Representative western blot of CD9 total protein expression in the panel of breast cell lines. See Figure S2 for full western blotting images. (D). Flow cytometric analysis of CD9 cell surface protein expression in breast cancer cell lines compared to non-tumorigenic breast cells. Results shown as geometric mean fluorescence intensity of CD9 antibody normalized to geometric mean fluorescence intensity of IgG antibody control. n = 3; * p = 0.04, ** p = 0.002, *** p = 0.0008, **** p < 0.0001.
Figure 4
Figure 4
CD9 mRNA and total protein expression levels positively correlate and there is differential CD9 3′UTR activity in breast cancer cell lines. (A). Linear regression analysis of CD9 mRNA and total protein expression levels across the breast cell line panel. (B). Correlation between CD9 mRNA and CD9 cell surface protein levels as measured using linear regression analysis. (C). Linear regression analysis of CD9 total protein and CD9 cell surface protein expression levels. (D). Endogenous activity of the CD9 3′UTR was measured using a CD9 3′UTR dual luciferase reporter assay in non-tumorigenic and tumorigenic breast cell lines. n = 3; * p = 0.02, ** p = 0.002, *** p = 0.0001, **** p < 0.0001.
Figure 5
Figure 5
PyMT tumor growth is impaired in Cd9−/− mice, with no change in tumor onset. (A). Kaplan–Meier kinetic analysis of tumor occurrence in PyMT Cd9−/− (n = 23), Cd9+/− (n = 23) and Cd9+/+ (n = 27) mice. In order to assess the effect of Cd9 deletion on tumor initiation, mice were palpated twice a week to detect tumor onset. (B). PyMT tumors were analyzed at 14 weeks of age in PyMT Cd9+/+ and Cd9−/− mice and the total number of tumors per mouse was counted. (C). Total tumor weight was measured at 14 weeks of age in PyMT Cd9+/+ and Cd9−/− mice. (D). The weight of the biggest tumor was measured and compared between Cd9−/− and Cd9+/+ mice; * p = 0.02.
Figure 6
Figure 6
Cd9 deletion has no significant effect on pulmonary metastasis in the MMTV/PyMT breast cancer mouse model. Pulmonary metastasis was assessed in PyMT Cd9+/+ and Cd9−/− mice at 12–14 weeks of age. (A). Incidence of lung metastases in PyMT Cd9−/− and Cd9+/+ mice. (B). Number of metastases per mouse in PyMT Cd9+/+ and Cd9−/− mice. (C). Metastasis size in PyMT Cd9+/+ and Cd9−/− mice. (D). The metastatic burden of PyMT Cd9+/+ and Cd9−/− mice at 12–14 weeks of age.

References

    1. Siegel R.L., Miller K.D., Jemal A. Cancer statistics, 2020. CA Cancer J. Clin. 2020;70:7–30. doi: 10.3322/caac.21590. - DOI - PubMed
    1. Zoller M. Tetraspanins: Push and pull in suppressing and promoting metastasis. Nat. Rev. Cancer. 2009;9:40–55. doi: 10.1038/nrc2543. - DOI - PubMed
    1. Huang C.I., Kohno N., Ogawa E., Adachi M., Taki T., Miyake M. Correlation of reduction in MRP-1/CD9 and KAI1/CD82 expression with recurrences in breast cancer patients. Am. J. Pathol. 1998;153:973–983. doi: 10.1016/S0002-9440(10)65639-8. - DOI - PMC - PubMed
    1. Mimori K., Kataoka A., Yoshinaga K., Ohta M., Sagara Y., Yoshikawa Y., Ohno S., Barnard G.F., Mori M. Identification of molecular markers for metastasis-related genes in primary breast cancer cells. Clin. Exp. Metastasis. 2005;22:59–67. doi: 10.1007/s10585-005-4417-y. - DOI - PubMed
    1. Miyake M., Nakano K., Itoi S.I., Koh T., Taki T. Motility-related protein-1 (MRP-1/CD9) reduction as a factor of poor prognosis in breast cancer. Cancer Res. 1996;56:1244–1249. - PubMed