. 2020 Mar 26;9(4):805.
doi: 10.3390/cells9040805.

Autophagy Modulators Profoundly Alter the Astrocyte Cellular Proteome

Affiliations

Autophagy Modulators Profoundly Alter the Astrocyte Cellular Proteome

Affan Ali Sher et al. Cells. .

Abstract

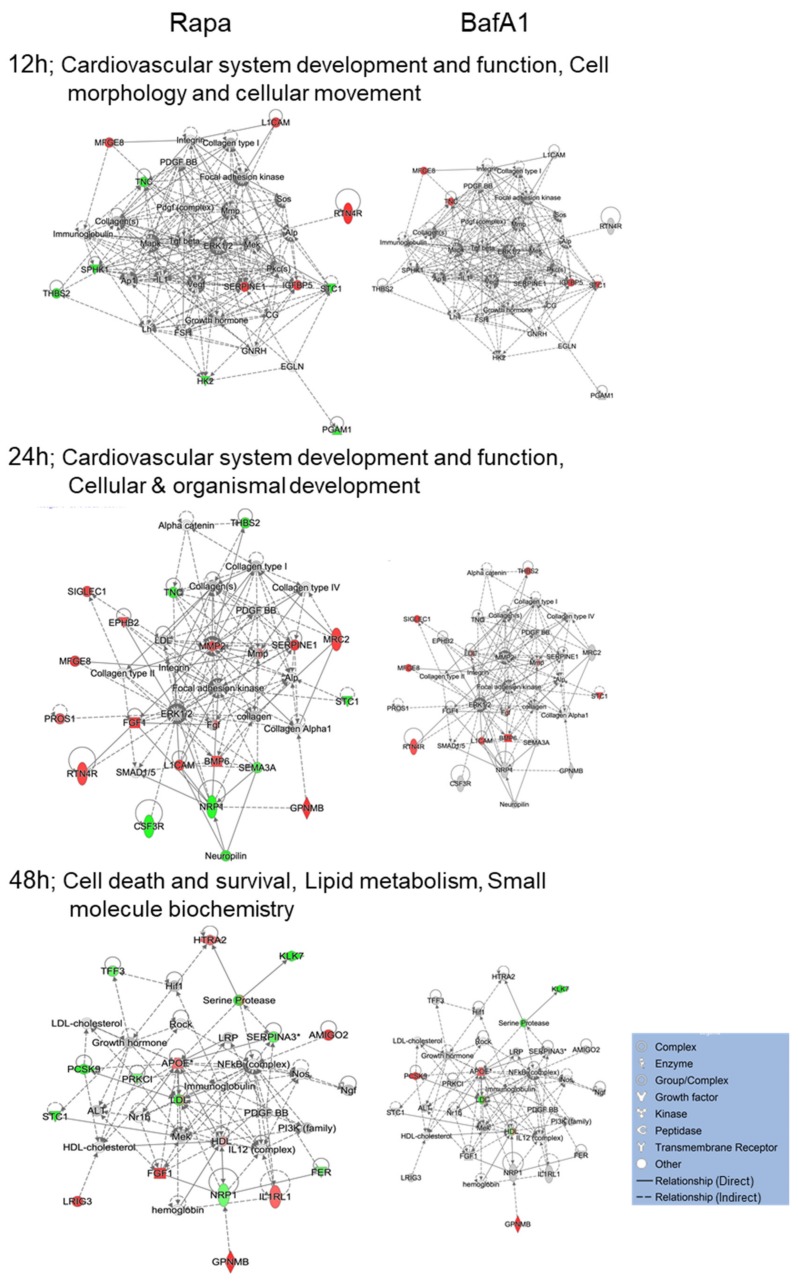
Autophagy is a key cellular process that involves constituent degradation and recycling during cellular development and homeostasis. Autophagy also plays key roles in antimicrobial host defense and numerous pathogenic organisms have developed strategies to take advantage of and/or modulate cellular autophagy. Several pharmacologic compounds, such as BafilomycinA1, an autophagy inducer, and Rapamycin, an autophagy inhibitor, have been used to modulate autophagy, and their effects upon notable autophagy markers, such as LC3 protein lipidation and Sequestosome-1/p62 alterations are well defined. We sought to understand whether such autophagy modulators have a more global effect upon host cells and used a recently developed aptamer-based proteomic platform (SOMAscan®) to examine 1305 U-251 astrocytic cell proteins after the cells were treated with each compound. These analyses, and complementary cytokine array analyses of culture supernatants after drug treatment, revealed substantial perturbations in the U-251 astrocyte cellular proteome. Several proteins, including cathepsins, which have a role in autophagy, were differentially dysregulated by the two drugs as might be expected. Many proteins, not previously known to be involved in autophagy, were significantly dysregulated by the compounds, and several, including lactadherin and granulins, were up-regulated by both drugs. These data indicate that these two compounds, routinely used to help dissect cellular autophagy, have much more profound effects upon cellular proteins.

Keywords: BafilomycinA1; Rapamycin; aptamers; autophagy; bioinformatics; cell responses.


Conflict of interest statement

The authors declare no conflicts of interest.

Figures

Figure 1
Figure 1
Effects of (a) BafilomycinA1 (BafA1) and (b) rapamycin (Rapa) on cell viability and (c,d) LC3-II conversion and p62 levels. (a,b) U-251 cells were treated with the compounds for indicated concentrations and periods of time, then cell viabilities determined by WST-1 assay. Results represent averages of four replicates; error bars are S.E.M. (c) Representative immunoblots of p62 and LC3 after treatment with indicated drugs for 24h. (d) Densitometric normalization to actin from three replicates. * p < 0.05; ** p < 0.01; *** p < 0.001; **** p < 0.0001.
Figure 2
Figure 2
Volcano plots of (a) BafA1- and (b) Rapa-treated U-251 proteins after indicated times of treatment. Each protein measured by SOMAscan® is represented by a circle. The dashed horizontal lines indicate p-value of 0.05 with circles above the lines being significantly dysregulated. Fold change cut-offs of +1.33 and -1.33 (± 0.415 Log2) are indicated with red and green filled circles, respectively. Values represent averages of three replicates.
Figure 3
Figure 3
Global dysregulation of U-251 proteins induced by Bafilomycin (BafA1) and Rapamycin (Rapa) treatment. U-251 cells were treated with the drugs for the indicated amounts of time, then cellular proteomes probed by SOMAscan® and compared to non-treated time-matched samples. (a) Global Ingenuity Pathway Analysis (IPA) default-determined alterations in “Diseases and Functions”. The “Cell Death and Survival” categories in (a) are enclosed in red boxes and expanded in (b). (b) Expanded Cell Death and Survival categories with each sub-category “Apoptosis”, “Cell death”, “Cell viability”, “Necrosis” and “Survival” separated. Each colored block within each sub-category refers to specific cellular nodes. Up-regulated (activated) nodes are indicated in orange; down-regulated (inhibited) by blue; not significantly regulated in grey. (c) Significantly dysregulated proteins associated with autophagy induced by BafA1 (B) or Rapamycin (R). Determinations based on three biological replicates.
Figure 4
Figure 4
IPA-determined top cellular Networks affected by 2 nM BafilomycinA1 (BafA1). Top BafA1-affected network at each time (left), with 200 nM rapamycin data overlaid (right). The top rapamycin-affected networks are shown in Figure 5. Red proteins are significantly up-regulated; green are down-regulated; grey proteins were not significantly dysregulated; white proteins are part of the network but not covered by the SOMA panel. Protein types indicated in legend.
Figure 5
Figure 5
IPA-determined top cellular Networks affected by 200 nM rapamycin (Rapa). Top Rapa-affected network at each time (left), with 2 nM BafA1 data overlaid (right). The top BafA1-affected networks are shown in Figure 4. Red proteins are significantly up-regulated; green are down-regulated; grey proteins were not significantly dysregulated; white proteins are part of the network but not covered by the SOMA panel. Protein types indicated in legend.
Figure 6
Figure 6
IPA-determined bio-functions altered by 2 nM BafA1 or 200 nM rapamycin. (a) Altered bio-functions with Z-Score > 1.96 (orange) or < −1.96 (blue) at each time point. (b) Some of the bio-functions (outlined in red in a) are shown in greater detail, with dysregulation of specific proteins indicated (red blocks indicate up-regulated; green indicates down-regulated).
Figure 7
Figure 7
IPA-determined upstream molecules altered by 2 nM BafA1 or 200 nM rapamycin. (a) Predicted affected upstream molecules with Z-Score > 1.96 (orange) or < −1.96 (blue) at each time point. (b) Some of the upstream molecules (outlined in red in a) are shown in greater detail, with dysregulation of specific proteins indicated (red indicates up-regulated; green indicates down-regulated).

References

    1. He C., Klionsky D.J. Regulation mechanisms and signaling pathways of autophagy. Annu. Rev. Genet. 2009;43:67–93. doi: 10.1146/annurev-genet-102808-114910. - DOI - PMC - PubMed
    1. Okamoto K. Organellophagy: Eliminating cellular building blocks via selective autophagy. J. Cell Biol. 2014;205:435–445. doi: 10.1083/jcb.201402054. - DOI - PMC - PubMed
    1. Klionsky D.J., Abdelmohsen K., Abe A., Abedin J., Abeliovich H., Acevedo-Arozena A., Adachi H., Adams C.M., Adams P.D., Adeli K., et al. Guidelines for the use and interpretation of assays for monitoring autophagy (3rd edition) Autophagy. 2016;12:1–222. doi: 10.1080/15548627.2015.1100356. - DOI - PMC - PubMed
    1. Ravikumar B., Futter M., Jahreiss L., Korolchuk V.I., Lichtenberg M., Luo S., Massey D.C.O., Menzies F.M., Narayanan U., Renna M., et al. Mammalian macroautophagy at a glance. J. Cell Sci. 2009;122:1707–1711. doi: 10.1242/jcs.031773. - DOI - PMC - PubMed
    1. Li W.-W., Li J., Bao J. Microautophagy: Lesser-known self-eating. Cell. Mol. Life Sci. 2011;69:1125–1136. doi: 10.1007/s00018-011-0865-5. - DOI - PMC - PubMed

Publication types

MeSH terms

LinkOut - more resources