. 2020 Mar 30;16(3):e1008340.
doi: 10.1371/journal.ppat.1008340. eCollection 2020 Mar.

Combination immunotherapy with anti-PD-L1 antibody and depletion of regulatory T cells during acute viral infections results in improved virus control but lethal immunopathology

Affiliations

Combination immunotherapy with anti-PD-L1 antibody and depletion of regulatory T cells during acute viral infections results in improved virus control but lethal immunopathology

Paul David et al. PLoS Pathog. .

Abstract

Combination immunotherapy (CIT) is currently applied as a treatment for different cancers and is proposed as a cure strategy for chronic viral infections. Whether such therapies are efficient during an acute infection remains elusive. To address this, inhibitory receptors were blocked and regulatory T cells depleted in acutely Friend retrovirus-infected mice. CIT resulted in a dramatic expansion of cytotoxic CD4+ and CD8+ T cells and a subsequent reduction in viral loads. Despite limited viral replication, mice developed fatal immunopathology after CIT. The pathology was most severe in the gastrointestinal tract and was mediated by granzyme B producing CD4+ and CD8+ T cells. A similar post-CIT pathology during acute Influenza virus infection of mice was observed, which could be prevented by vaccination. Melanoma patients who developed immune-related adverse events under immune checkpoint CIT also presented with expanded granzyme-expressing CD4+ and CD8+ T cell populations. Our data suggest that acute infections may induce immunopathology in patients treated with CIT, and that effective measures for infection prevention should be applied.


Conflict of interest statement

NO authors have competing interests.

Figures
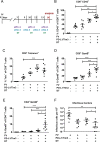
Fig 1
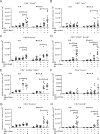
Fig 1. Reduced levels of FV and enhanced number of CD8+ and CD4+ T cells producing GzmB after Treg depletion and/or inhibitory pathway blockage in acutely infected mice.
DEREG mice were infected with FV and treated with DT and/or blocking antibodies against PD-L1 and TIM-3 as indicated (A). Flow cytometry was used for the determination of spleen CD8+ T cells which are expressing CD43 (B), positive for MHC class I H2-Db tetramers specific for FV GagL peptide (Tetr+) (C), and producing the GzmB (D), and the percentages of CD4+ T cells producing the GzmB (E). Spleens of chronically FV-infected mice from the different treatment groups were analyzed for viral loads by infectious center assays one day after termination of treatment (F). Each dot represents an individual mouse. Data were pooled from 3 to 5 independent experiments with similar results. Statistically significant differences are indicated by asterisks (* < 0.05; ** < 0.005; *** < 0.0005; one-way ANOVA with a Tukey post-test).
Fig 2
Fig 2. The death of FV infected mice within one week after Treg depletion and blocking of inhibitory pathways.
DEREG mice were infected with FV and were treated with DT and/or blocking antibodies against PD-L1 and TIM-3 as indicated during the second week of infection (A). Lymphadenopathy (B) and pathology of the intestine (C) in mice after Treg depletion and treatment with anti-PD-L1 and anti-TIM-3. The percentages of CD8+GzmB+ (D) or CD4+GzmB+ (E) T cells isolated from the intestine of mice infected with FV and treated with DT and/or blocking antibodies against PD-L1 and TIM-3. Data were pooled from 3 to 5 independent experiments with similar results. Statistically significant differences are indicated by asterisks (* < 0.05; ** < 0.005; one-way ANOVA with a Tukey post-test).
Fig 3
Fig 3. CD8+ and CD4+ T cell activity after combination immunotherapy.
Mice were infected with FV and were treated with DT and/or blocking antibodies against PD-L1 and TIM-3 as indicated (Fig 1A). 18 days after infection inguinal lymph nodes (ILN) and mesenteric lymph nodes (MesLN) were isolated and the flow cytometry analysis of CD8+ and CD4+ T cells was performed. Frequencies of CD8+ T cells expressing CD43 (A) or positive for MHC class I H2-Db tetramers specific for FV GagL peptide (Tetr+) (B), or Eomes (C), or GzmB (D), are presented. The frequencies of CD4+ T cells expressing CD62L- CD43+ phenotype (E), or positive for MHC class-II Ab FV-envelope specific tetramer (Tetr II+) (F), or expressing Eomes (G), or GzmB (H) were detected. Each dot represents an individual mouse. Data were pooled from 3 to 5 independent experiments with similar results. Statistically significant differences are indicated by asterisks (* < 0.05; ** < 0.005; *** < 0.0005; one-way ANOVA with a Tukey post-test).
Fig 4
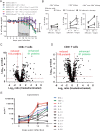
Fig 4. Functional properties of CD8+ and CD4+ T cells after combination immunotherapy.
A. Weight of non-treated FV-infected mice, and mice infected and treated with DT and blocking antibodies against PD-L1 and TIM-3, and mice received additionally to combined treatment anti-CD4 or anti-CD8 or both anti-CD4 and anti-CD8 antibody, and DEREG-GzmB KO mice treated with DT and blocking antibodies against PD-L1 and TIM-3. For the depletion of CD4+ or CD8+ T cells mice were inoculated three times every other day starting on day 12 after FV infection. B. Redirect killing of P815 cells that were loaded with anti-CD3 antibodies and co-incubated with CD4+ T cells (left), CD8+ T cells (middle) and CD4+ plus CD8+ T cells (right) isolated from naïve mice, FV-infected mice and infected mice receiving combination treatment. Data were pooled from 3 independent experiments with similar results. Statistically significant differences are indicated by asterisks (* < 0.05; ** < 0.005; *** < 0.0005; non-parametric Mann-Whitney test). CD3+ CD8+ CD43+ T cells and CD3+CD4+ CD43+ CD62L- T cells were sorted from spleens of FV-infected DEREG mice and from FV-infected DEREG mice treated with DT and anti-PD-L1/anti-Tim-3 antibodies at 18 days post infection. After sorting cells were lysed for proteome analysis. Volcano plot showing the comparison of protein expression in CD3+ CD8+ CD43+ (C) and CD3+CD4+CD43+CD62L- (D) T cells isolated from non-treated and T cells with the same phenotype isolated from combination treated mice. Numbers of significantly reduced or enhanced proteins in the group of treated mice are shown in volcano plots. Benjamini–Hochberg corrected one-way ANOVA was used for the calculation of the p-values. E. FV infected mice from group received the combination treatment were bled at day 0, day 7, day 14 and day 18 after infection and the concentration of cytokines was analyzed. Data were pooled from 2 independent experiments with similar results.
Fig 5
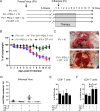
Fig 5. Lethality of chronic FV infected mice after Treg depletion and/or blocking of inhibitory pathways and infected with low doses of influenza virus.
A. Chronically FV infected mice were treated with DT for Treg depletion and/or treated with anti-PD-L1 antibody. One day after starting the treatment mice were infected with IV. The weight of the analyzed group of mice (B) and the lungs of non-treated and combination treated mice (C). The numbers of RNA copies of IV in lung homogenate (D). The dashed line reflects the detection limit of the method. The percentage of CD4+ (E) and CD8+ (F) T cells in the BALF cells was calculated by flow cytometry. Each dot represents an individual mouse. Data were pooled from 2 to 3 independent experiments with similar results. Statistically significant differences are indicated by asterisks (** < 0.005; one-way ANOVA with a Tukey post-test).
Fig 6
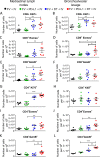
Fig 6. Characterization of CD8+ T cells and CD4+ T cells isolated from mediastinal lymph nodes and from bronchoalveolar lavage.
Mice chronic infected with FV were treated with DT (DEREG mice) and/or blocking antibodies against PD-L1. One day after the start of treatment mice were infected with IV and, 12 days after IV infection, were killed and mediastinal LN and BALF were analyzed by flow cytometry. Frequencies of CD8+ T cells positive for Ki67+ in MLN (A) and in BALF (B), numbers of CD8+ T cells positive for Eomes in MLN (C) and in BALF (D), and numbers of CD8+ T cells producing GzmB in MLN (E) and in BALF (F). Frequencies of CD4+Foxp3- T cells positive for Ki67 in MLN (G) and in BALF (H), numbers of CD4+Foxp3- T cells positive for Eomes in MLN (I) and in BALF (J), and numbers of CD4+Foxp3- T cells producing GzmB in MLN (K) and in BALF (L). Each dot represents an individual mouse. Data were pooled from 2 to 4 independent experiments with similar results. Statistically significant differences are indicated by asterisks (* < 0.05; ** < 0.005; *** < 0.0005; one-way ANOVA with a Tukey post-test).
Fig 7
Fig 7. Vaccination prevents the development of immune-mediated pathology.
DEREG mice were immunized with an inactivated influenza virus and treated with DT and anti-PD-L1 antibody (A). Weight reduction of mice infected with IV (black line), IV-infected and treated (blue line), and vaccinated, IV-challenged and treated (red line) (B). Data were pooled from 2 independent experiments with similar results. Statistically significant differences are indicated by asterisks (*** < 0.0005; non-parametric Mann-Whitney test).
Fig 8
Fig 8. Characterization of CD8+ T cells and CD4+ T cells from PBMCs of melanoma patients with symptoms of AiRE after checkpoint blocking therapy.
Multiparameter flow cytometry was used for the analysis of CD8+ and CD4+ T cell differentiation and production of GzmA and GzmB. Representative dot plots of CD8+ T cells of a melanoma patient before combination therapy and during the therapy (A). Percentage of CD8+ T cells with the phenotype of effector-memory (EM) (CD45RO+ CCR7-) (B) or effector cells (E) (CD45RO- CCR7-) (C). Percentage of EM CD8+ produced GzmA (D) or GzmB (E); percentages of E CD8+ producing GzmA (F) or GzmB (G). Representative dot plots of CD4+ T cells of a melanoma patient before combination therapy and during the therapy (H). Percentage of CD4+ T cells with the phenotype of EM (CD45RO+ CCR7-) (I) or E (CD45RO- CCR7-) (J). Percentage of EM CD4+ T cells producing GzmA (K) or GzmB (L); percentages of E CD4+ T cells producing GzmA (M) or GzmB (N). Each dot represents data from an individual patient. Data from the same patient are connected. Statistically significant differences are indicated by asterisks (* < 0.05; paired nonparametric t-test).

References

    1. Kim PS, Ahmed R. Features of responding T cells in cancer and chronic infection. Current opinion in immunology. 2010;22(2):223–30. 10.1016/j.coi.2010.02.005 - DOI - PMC - PubMed
    1. Barber DL, Wherry EJ, Masopust D, Zhu B, Allison JP, Sharpe AH, et al. Restoring function in exhausted CD8 T cells during chronic viral infection. Nature. 2006;439(7077):682–7. Epub 2005/12/31. nature04444 [pii] 10.1038/nature04444 . - DOI - PubMed
    1. Dong H, Strome SE, Salomao DR, Tamura H, Hirano F, Flies DB, et al. Tumor-associated B7-H1 promotes T-cell apoptosis: a potential mechanism of immune evasion. Nature medicine. 2002;8(8):793–800. 10.1038/nm730 . - DOI - PubMed
    1. Iwai Y, Ishida M, Tanaka Y, Okazaki T, Honjo T, Minato N. Involvement of PD-L1 on tumor cells in the escape from host immune system and tumor immunotherapy by PD-L1 blockade. Proceedings of the National Academy of Sciences of the United States of America. 2002;99(19):12293–7. 10.1073/pnas.192461099 - DOI - PMC - PubMed
    1. Thommen DS, Schumacher TN. T Cell Dysfunction in Cancer. Cancer Cell. 2018;33(4):547–62. 10.1016/j.ccell.2018.03.012 . - DOI - PMC - PubMed

Publication types

MeSH terms