

Bifurcation analysis of an SIRS epidemic model with a generalized nonmonotone and saturated incidence rate
- PMID: 32226129
- PMCID: PMC7094459
- DOI: 10.1016/j.jde.2019.03.005
Bifurcation analysis of an SIRS epidemic model with a generalized nonmonotone and saturated incidence rate
Abstract
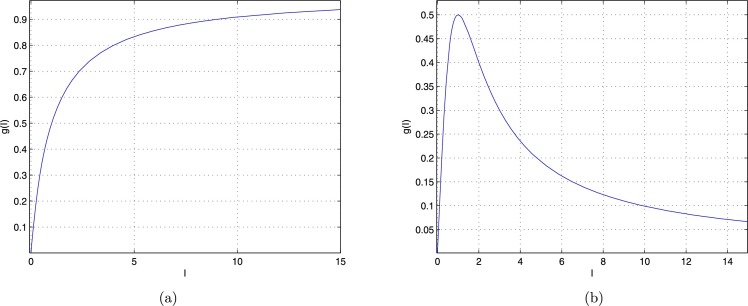
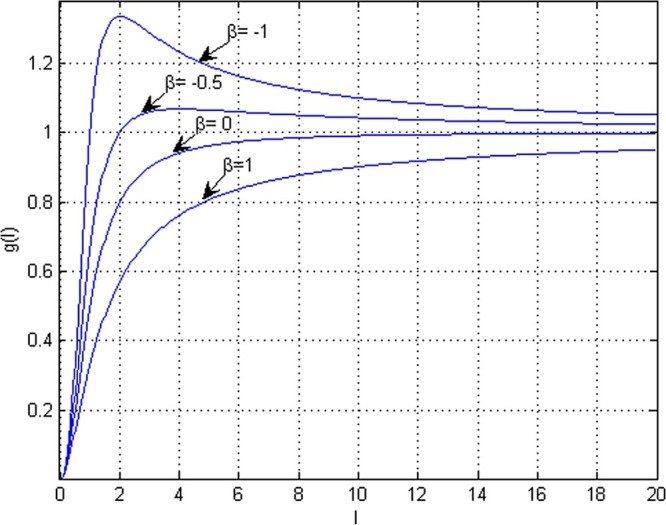
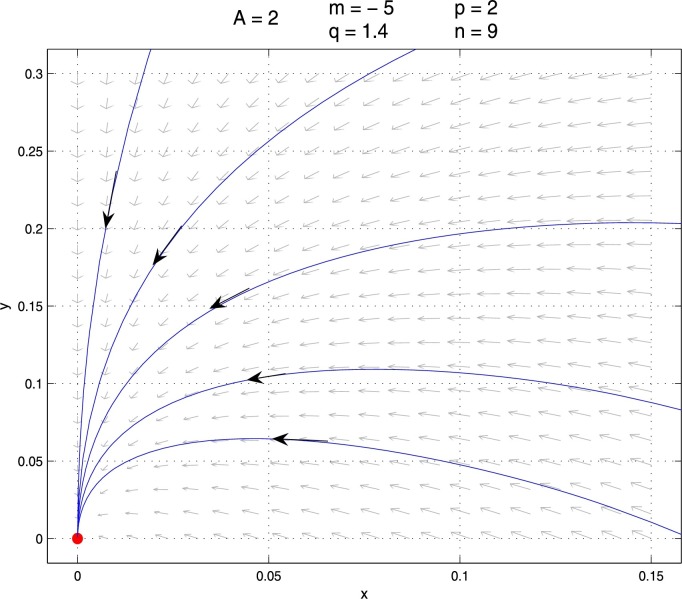
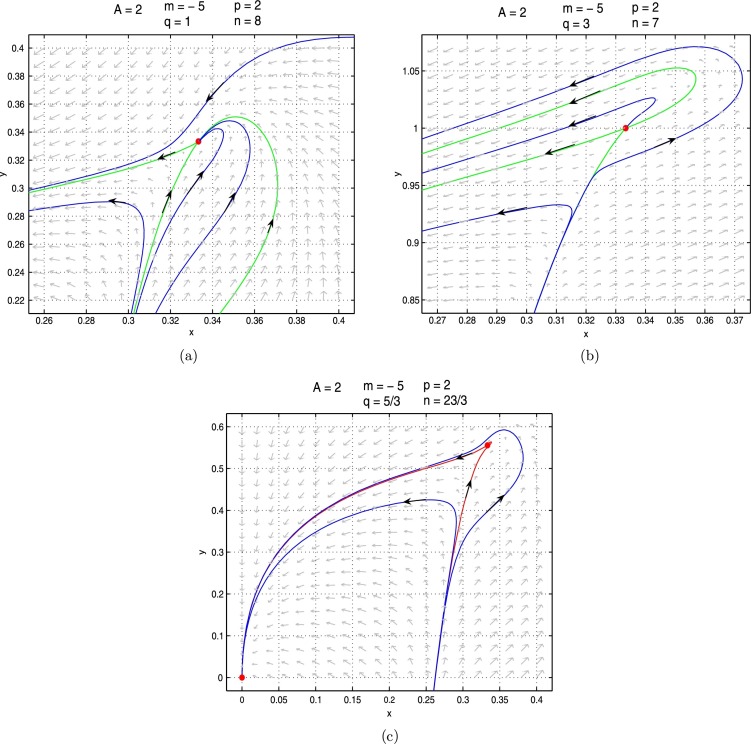
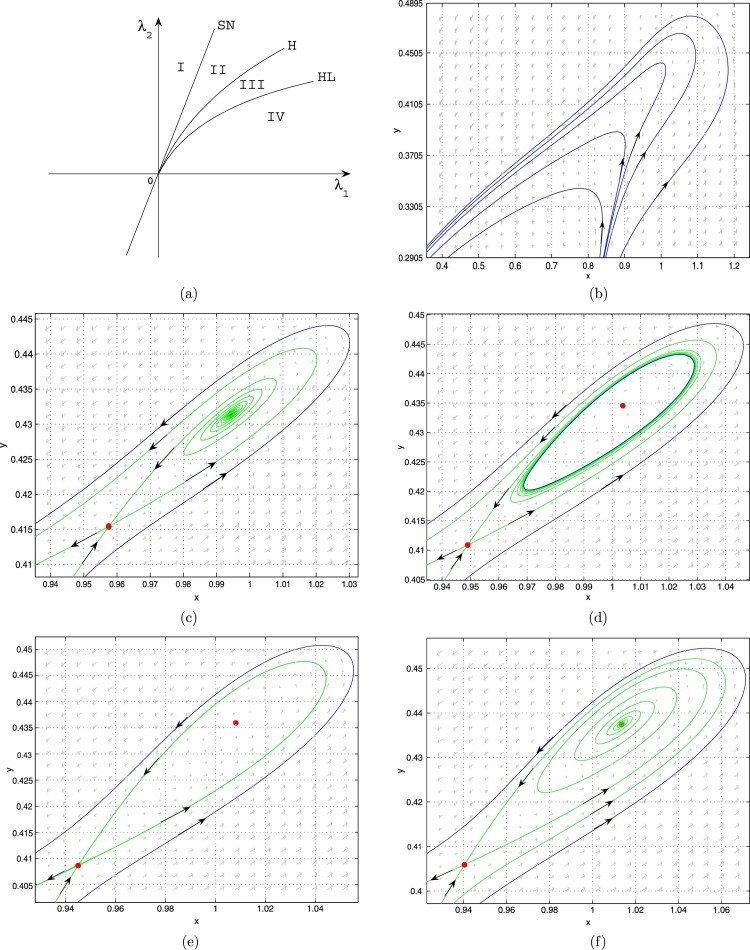
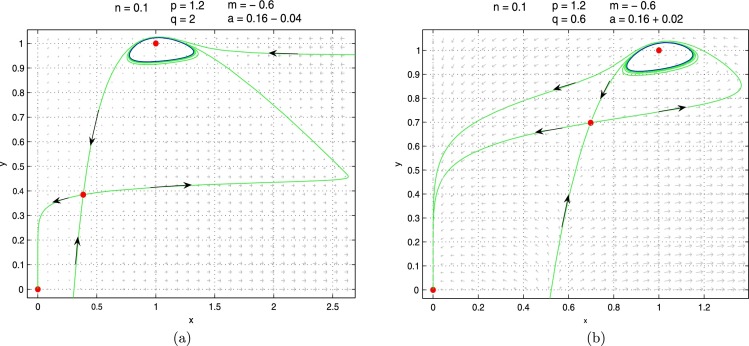
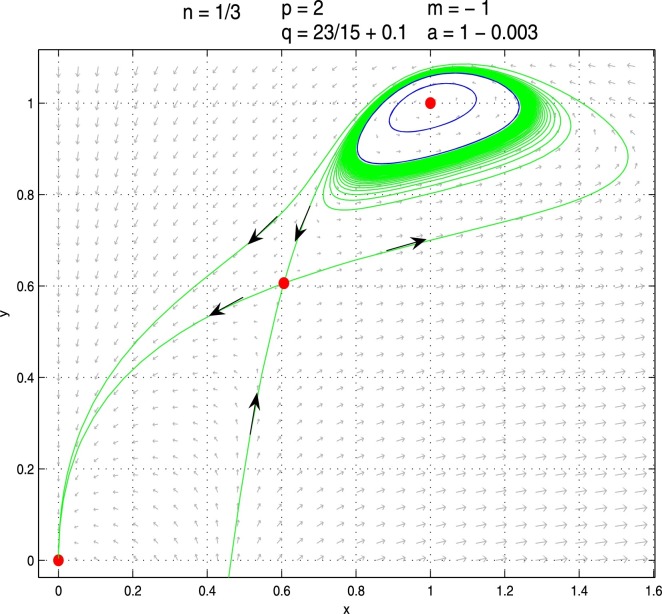
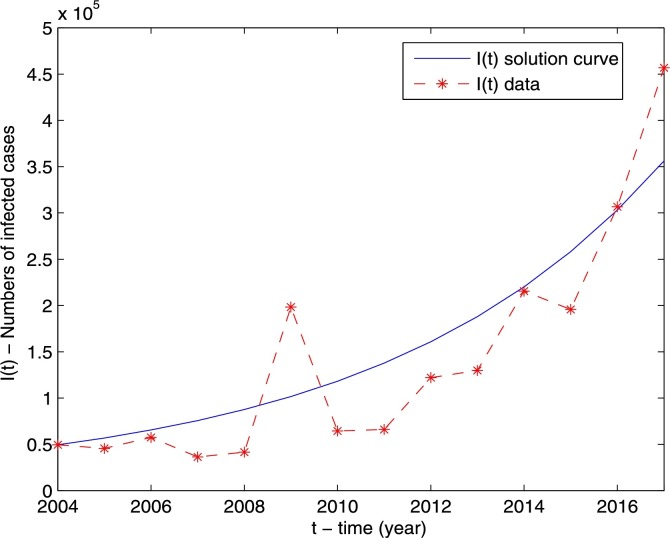
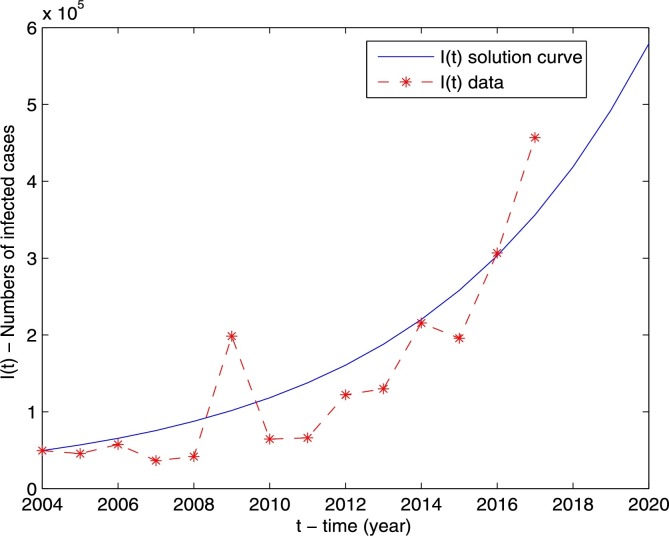
In this paper, we study a susceptible-infectious-recovered (SIRS) epidemic model with a generalized nonmonotone and saturated incidence rate , in which the infection function first increases to a maximum when a new infectious disease emerges, then decreases due to psychological effect, and eventually tends to a saturation level due to crowding effect. It is shown that there are a weak focus of multiplicity at most two and a cusp of codimension at most two for various parameter values, and the model undergoes saddle-node bifurcation, Bogdanov-Takens bifurcation of codimension two, Hopf bifurcation, and degenerate Hopf bifurcation of codimension two as the parameters vary. It is shown that there exists a critical value for the psychological effect, and two critical values for the infection rate such that: (i) when , or and , the disease will die out for all positive initial populations; (ii) when and , the disease will die out for almost all positive initial populations; (iii) when and , the disease will persist in the form of a positive coexistent steady state for some positive initial populations; and (iv) when and , the disease will persist in the form of multiple positive periodic coexistent oscillations and coexistent steady states for some positive initial populations. Numerical simulations, including the existence of one or two limit cycles and data-fitting of the influenza data in Mainland China, are presented to illustrate the theoretical results.
Keywords: Bogdanov-Takens bifurcation; Degenerate Hopf bifurcation; Hopf bifurcation; SIRS epidemic model; Saddle-node bifurcation.
© 2019 Elsevier Inc. All rights reserved.
Figures
References
-
- Alexander M.E., Moghadas S.M. Periodicity in an epidemic model with a generalized nonlinear incidence. Math. Biosci. 2004;189:75–96. - PubMed
-
- Alexander M.E., Moghadas S.M. Bifurcation analysis of an SIRS epidemic model with generalized incidence. SIAM J. Appl. Math. 2005;65:1794–1816.
-
- Bogdanov R. Bifurcations of a limit cycle for a family of vector fields on the plane. Sel. Math. Sov. 1981;1:373–388.
-
- Bogdanov R. Versal deformations of a singular point on the plane in the case of zero eigen-values. Sel. Math. Sov. 1981;1:389–421.
-
- Capasso V., Crosso E., Serio G. I modelli matematici nella indagine epidemiologica. I Applicazione all'epidemia di colera verificatasi in Bari nel 1973. Ann. Sclavo. 1977;19:193–208. - PubMed
LinkOut - more resources
Full Text Sources