. 2020 Mar 26:15:28.
doi: 10.1186/s13020-020-00307-z. eCollection 2020.

Anti-colorectal cancer effects of scutellarin revealed by genomic and proteomic analysis

Affiliations

Anti-colorectal cancer effects of scutellarin revealed by genomic and proteomic analysis

Liu-Lin Xiong et al. Chin Med. .

Abstract

Background: Colorectal cancer, one of the most common digestive tumors with high mortality and morbidity worldwide, currently lacks effective therapies available to improve the prognosis. This study was aimed to investigate the potency of Scutellarin against colorectal cancers, and explore the related mechanism via genomic and proteomic analysis.

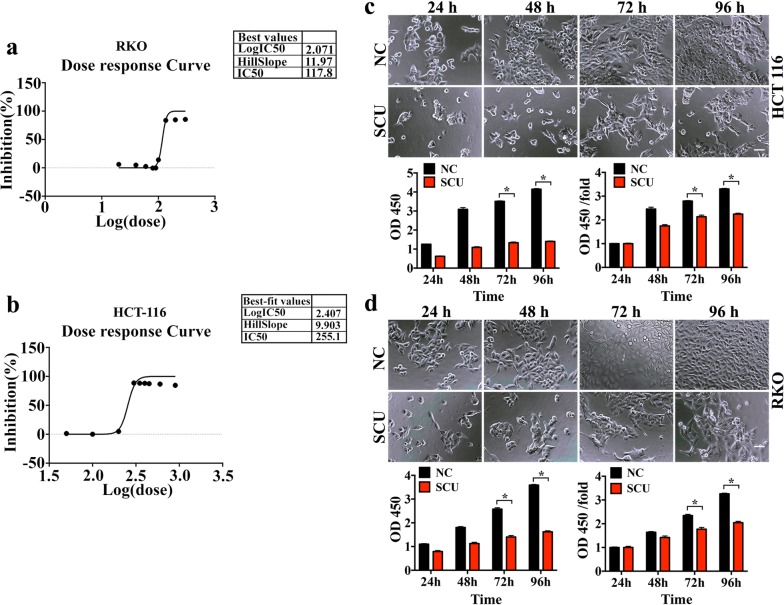
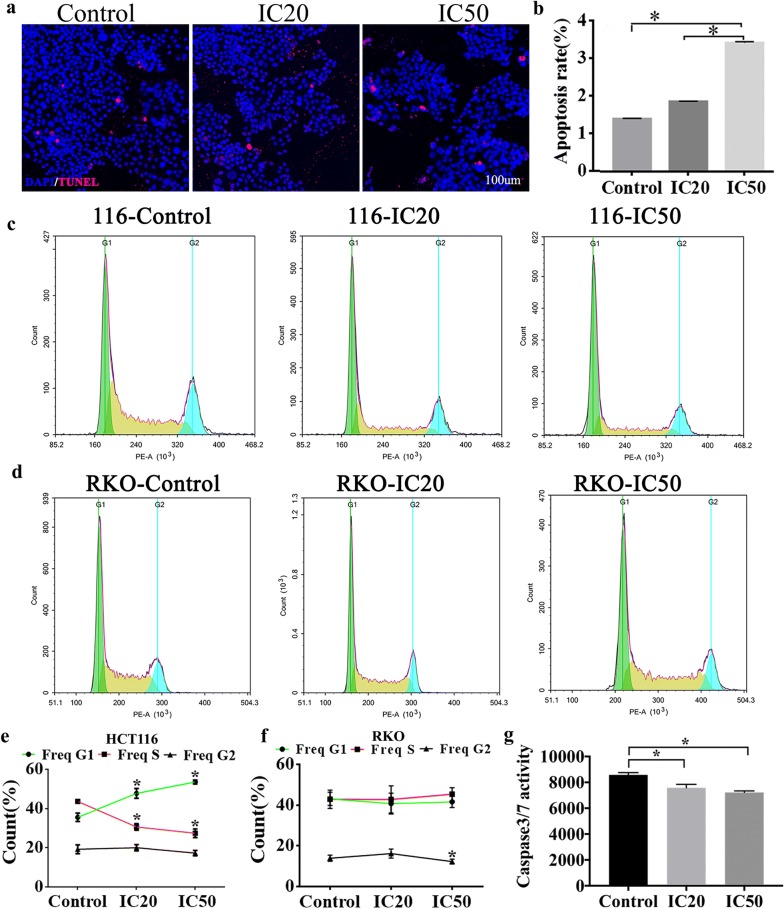
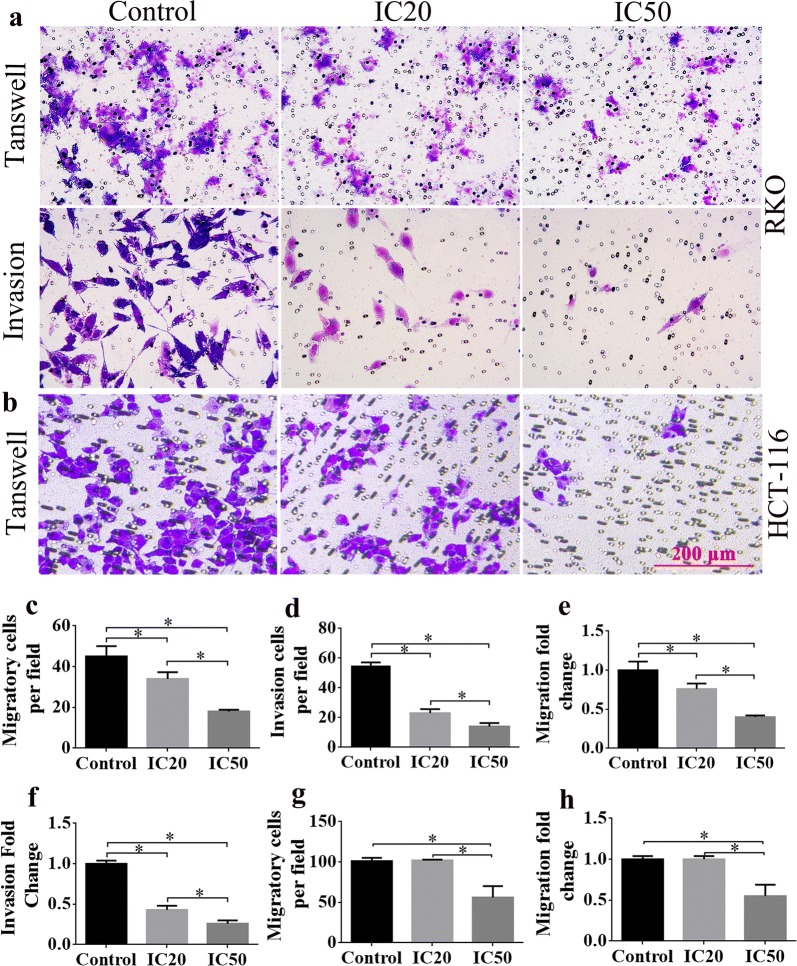
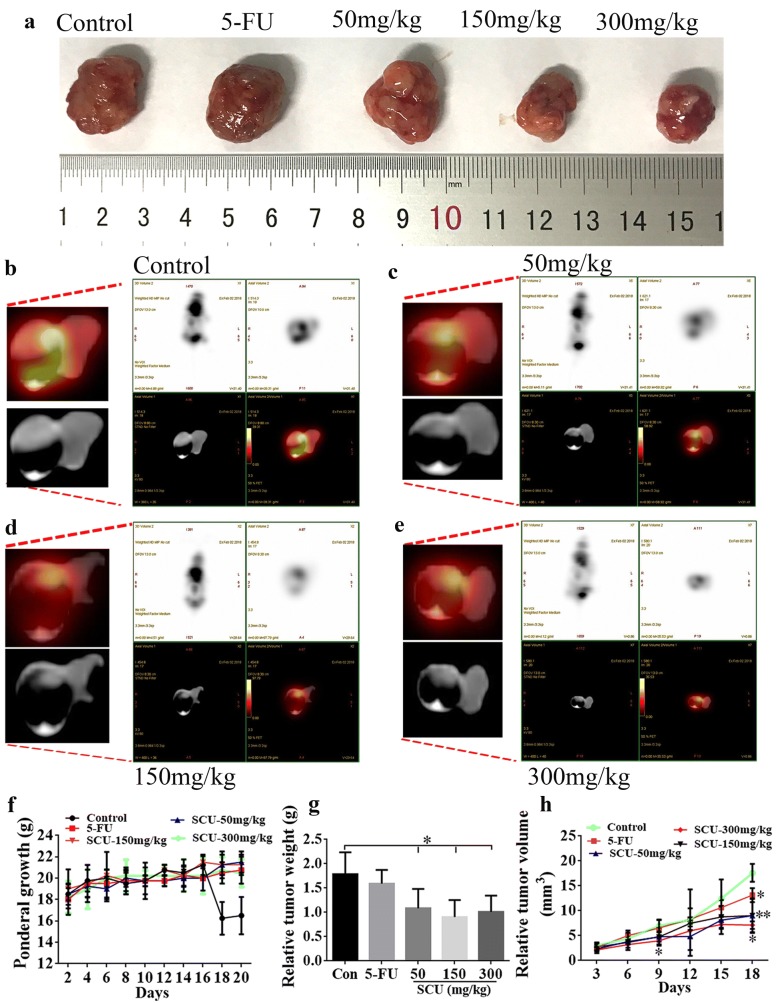
Methods: Cell counting kit-8 assay was employed to detect the viability of HCT-116 and RKO cell lines treated with Scutellarin. The apoptosis of HCT-116 and RKO cells after Scutellarin administration was determined by TUNEL staining and Caspase 3/7 activity. Cell cycle was detected by flow cytometry analysis. The wound healing and transwell invasion test detected the role of Scutellarin in migration and invasion of HCT-116 and RKO cells. Meanwhile, the energy metabolism and growth of tumor tissues in vivo at day 28 were observed by PET-CT after Scutellarin administration with 50 mg/kg, 100 mg/kg and 300 mg/kg into 4-week-old nude mice. Blood routine and liver functions were also detected to evaluate the side effect of Scutellarin. Furthermore, the disease and function classifications which the differentially expressed genes and proteins involved after Scutellarin treatment were determined by genomic and proteomic analysis respectively.

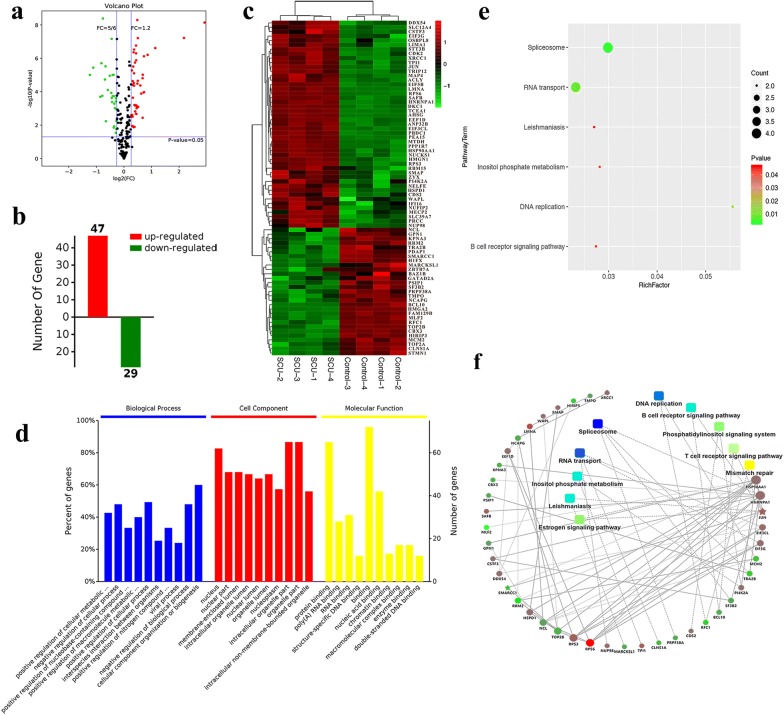
Results: The Scutellarin inhibited the migration and increased apoptosis of HCT-116 and RKO cell lines. Besides, Scutellarin treatment substantially decreased the growth and volume of colorectal tumors in nude mice without side effects on the blood routine and liver function. The differentially expressed genes in RKO cells after Scutellarin administration were mainly enriched in cell death and survival, organismal injury and abnormalities, and cancer. In addition, forty-seven upregulated and twenty-nine downregulated proteins were identified. Functional clustering analysis exhibited enriched biological processes, cellular components, molecular functions and related pathways of these proteins in cellular metabolic. Then protein-protein interactions analysis showed the regulatory relationship among these differentially expressed proteins.

Conclusions: Taken together, the present findings revealed that Scutellarin exerted significant antitumor effect with no side effects in the blood and liver by regulating various important molecules in tumor proliferation, apoptosis and metastasis.

Keywords: Antitumor effect; Colorectal cancer; Genomics, proteomics; Scutellarin.


Conflict of interest statement

Competing interestsThe authors declare that there is no conflict of interest regarding the publication of this paper.

Figures

Fig. 1
Fig. 1
The effects of SCU on cell viability of RKO and HCT-116 cells. a, b The dose response curve of IC50 from log (0) to log (2) for RKO cells and from log (1.5) to log (3.5) for HCT-116 cells, n = 3. c, d Cell viability variation of RKO and HCT-116 cells following SCU treatment in NC group and SCU group respectively shown by open field images and line charts of OD value, n = 5. SCU: Scutellarin; NC: negative control; h: hours; IC50: 50% inhibition concentration. All data are analyzed by GraphPad Prism 6 software shown as mean ± SD. Scale bar = 50 μm.*p < 0.05
Fig. 2
Fig. 2
The effects of SCU on the proliferation and apoptosis of HCT-116 and RKO cells. a Immunofluorescent staining of TUNEL in Control, IC20 and IC50 groups. Apoptotic cells are stained by red color, and the nucleus is stained by blue. b The apoptosis rate (TUNEL/DAPI) comparison among these three groups. The flow cytometry detection of c HCT-116 cells and d RKO cells in the indicated groups. The cell count variation of e HCT-116 cells and f RKO cells in Control, IC20 and IC50 groups. g The variation of Caspase3/7 activity in control, IC20 and IC50 groups. IC20: 20% inhibition concentration; IC50, 50% inhibition concentration; SCU, Scutellarin; TUNEL, Terminal-deoxynucleoitidyl Transferase Mediated Nick End Labeling; DAPI, 4′,6-diamidino-2-phenylindole. All data are shown as mean ± SD, n = 5. *p < 0.05. Scale bar = 100 μm
Fig. 3
Fig. 3
The effects of SCU on migration rate of HCT-116 and RKO cell lines. The cell migration was measured by wound healing assays in a HCT-116 cells at 0 h, 12 h and 36 h, and c RKO cells at 0 h, 8 h and 24 h. Scale bar = 100 μm. b The quantitative analysis of the migration rate of HCT-116 cells and d RKO cells. SCU, Scutellarin; IC20, 20% inhibition concentration; IC50, 50% inhibition concentration; h, hours. All data are shown as mean ± SD, n = 5. *p < 0.05
Fig. 4
Fig. 4
The effects of SCU on the migration and invasion capacities of HCT-116 and RKO cells. The cell migration and invasion in a RKO cells and b HCT-116 cells were analyzed by transwell assay. Scale bar = 50 μm. c, d The migratory cells per field and invasion cells per field of RKO cells in control, IC20 and IC50 groups. e, f The migration fold change and invasion fold change of RKO cells. g, h The migratory cells per field and invasion cells per field of HCT-116 cells. SCU, Scutellarin; IC20, 20% inhibition concentration; IC50, 50% inhibition concentration. All data are shown as mean ± SD, n = 5. *p < 0.05
Fig. 5
Fig. 5
The inhibitory effect of SCU administration on tumor growth in nude mice in vivo. a The morphology of tumor in nude mice after the administration of DMSO (control) and 25 mg/kg 5-FU as well as 50 mg/kg, 150 mg/kg and 300 mg/kg SCU. Scale bar = 1 cm. PET-CT assay of tumor size in b control, c Scu-50 mg/kg, d Scu-150 mg/kg and e Scu-300 mg/kg groups. f Variation of ponderal growth in control, 5-FU, Scu-50 mg/kg, Scu-50 mg/kg and Scu-50 mg/kg groups from 2 d to 20 days. g The relative weight of tumor in nude mice after the administration of DMSO (control) and 25 mg/kg 5-FU as well as SCU with 50 mg/kg, 150 mg/kg and 300 mg/kg. h The relative volume changes of tumor after the administration of DMSO (control) and 25 mg/kg 5-FU as well as SCU with 50 mg/kg, 150 mg/kg and 300 mg/kg at 3, 6, 9, 12, 15, 18 d. Con: Control; 5-FU: 5-Fluorouracil; SCU, Scutellarin; d, day. All data are shown as mean ± SD, n = 10, *p < 0.05; **p < 0.01
Fig. 6
Fig. 6
Ingenuity pathway analysis of genes function in RKO cells. The concentration of a AST and ALT, b HGB as well as c WBC and PLT in control, 5-FU as well as SCU with 50 mg/kg, 150 mg/kg and 300 mg/kg. All data are shown as mean ± SD, n = 4/group. d Disease and function bar graph of differentially expressed genes in classification of diseases. e The heat maps of relationship between upregulated and downregulated genes in activation or inhibition of diseases. The orange stands for z-score > 0; the blue stands for z-score < 0; the gray means no Z-score value. Con control, 5-FU 5-fluorouracil, Scu scutellarin, d day, HGB hemoglobin, AST aspartate aminotransferase, ALT alanine transaminase, WBC white blood cell, PLT platelet
Fig. 7
Fig. 7
Proteomic analysis of differentially expressed proteins. a Differentially expressed proteins shown by volcano plot. Fold change > 1.2 or < 5/6 and P < 0.05 is considered to be a significant differentially expressed protein. Red for up-regulated proteins, green for down-regulated ones, and black for no differentially expressed proteins. b Number of identified up- or down regulated proteins. c Heat maps of identified proteins in control and SCU groups. d GO analysis of DEPs’ biological functions. e Statistics of KEGG pathway enrichment of DEPs. Rich Factor is the ratio of DEP number annotated in this pathway term to all protein number annotated in this pathway term. Greater Rich Factor means greater effect of the inhibitors on the analyzed pathway. f Red dot represents upregulated protein, green for down-regulated one. Rectangles represent biological processes, cellular localization, molecular functions or signaling pathways. Blue for higher P value while yellow for the lower. Solid lines represent protein (genes)-proteins (genes) are interrelated, and dashed lines represent metabolic pathways-proteins (genes) are interrelated. All data are shown as mean ± SD, n = 4. SCU scutellarin

References

    1. Hu XQ, et al. Plasma metabolic profiling on postoperative colorectal cancer patients with different traditional Chinese medicine syndromes. Compl Ther Med. 2018;36:14–19. doi: 10.1016/j.ctim.2017.11.006. - DOI - PubMed
    1. Yang DH. Recent advances in understanding colorectal cancer and dysplasia related to ulcerative colitis. Korean J Gastroenterol. 2015;66(6):312–319. doi: 10.4166/kjg.2015.66.6.312. - DOI - PubMed
    1. Shaw E, et al. Effects of physical activity on colorectal cancer risk among family history and body mass index subgroups: a systematic review and meta-analysis. BMC Cancer. 2018;18(1):71. doi: 10.1186/s12885-017-3970-5. - DOI - PMC - PubMed
    1. Butterworth AS, Higgins JPT, Paul P. Relative and absolute risk of colorectal cancer for individuals with a family history: a meta-analysis. Eur J Cancer. 2006;42(2):216–227. doi: 10.1016/j.ejca.2005.09.023. - DOI - PubMed
    1. Taylor DP, et al. Population-based family history-specific risks for colorectal cancer: a constellation approach. Gastroenterology. 2010;138(3):877–885. doi: 10.1053/j.gastro.2009.11.044. - DOI - PMC - PubMed