. 2020 Jun 30;30(8):4544-4562.
doi: 10.1093/cercor/bhaa056.

Changes in the Proportion of Inhibitory Interneuron Types from Sensory to Executive Areas of the Primate Neocortex: Implications for the Origins of Working Memory Representations

Affiliations

Changes in the Proportion of Inhibitory Interneuron Types from Sensory to Executive Areas of the Primate Neocortex: Implications for the Origins of Working Memory Representations

Santiago Torres-Gomez et al. Cereb Cortex. .

Abstract

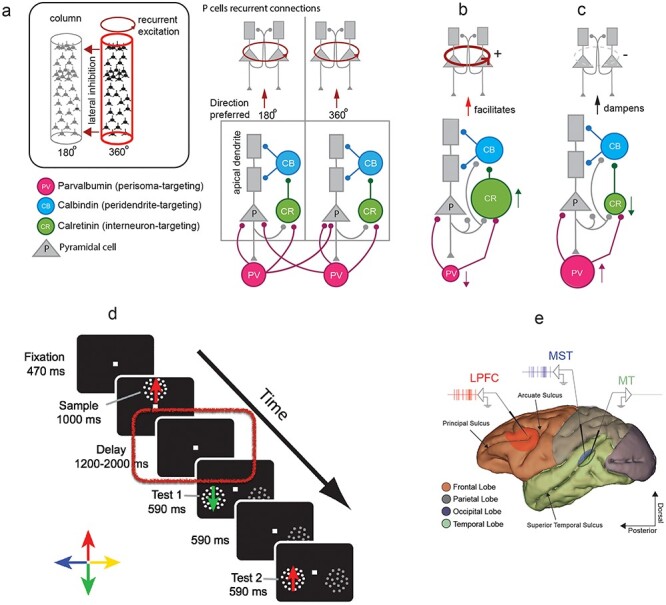
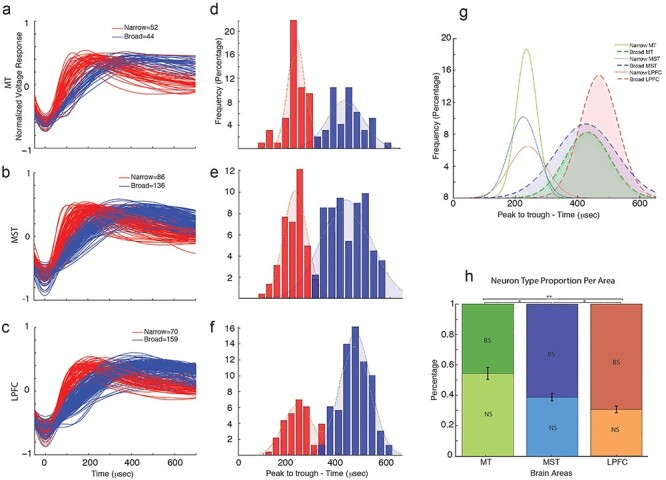
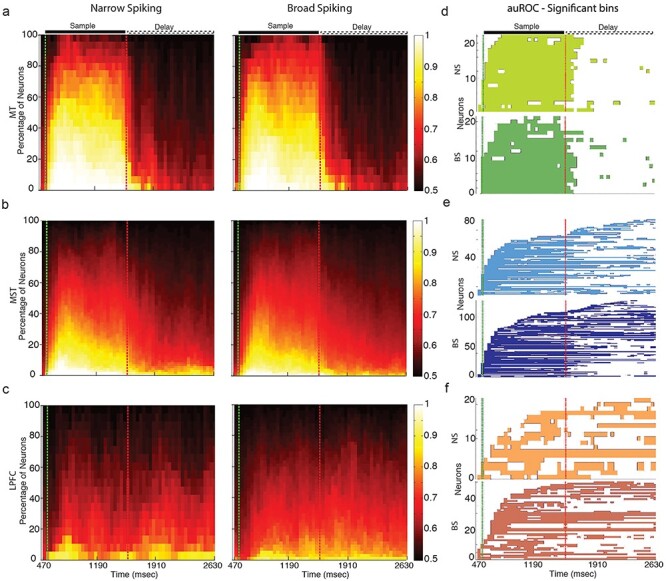
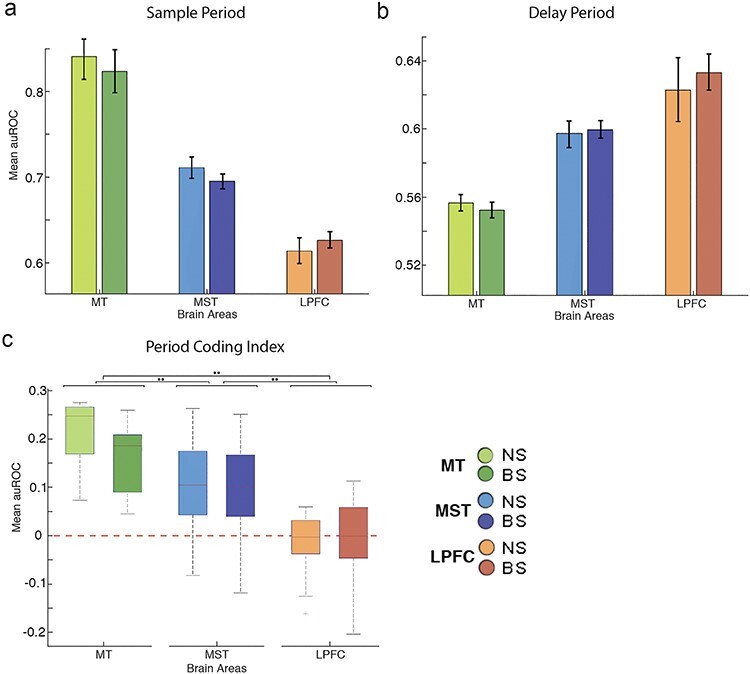
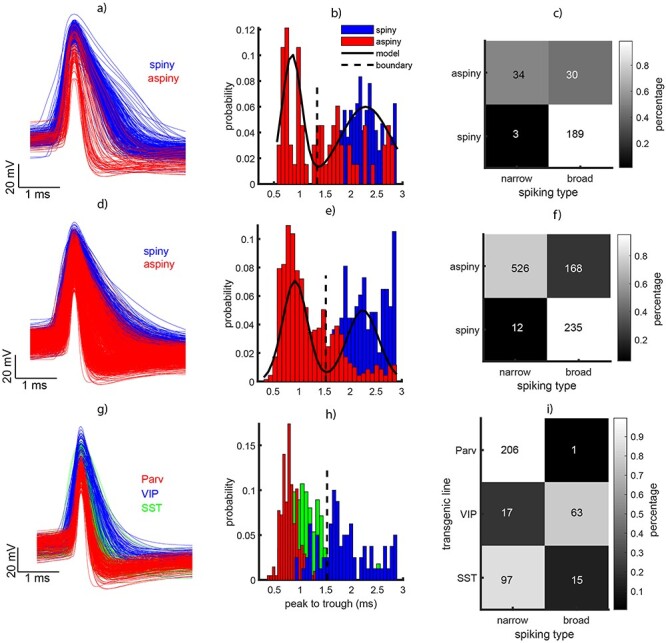
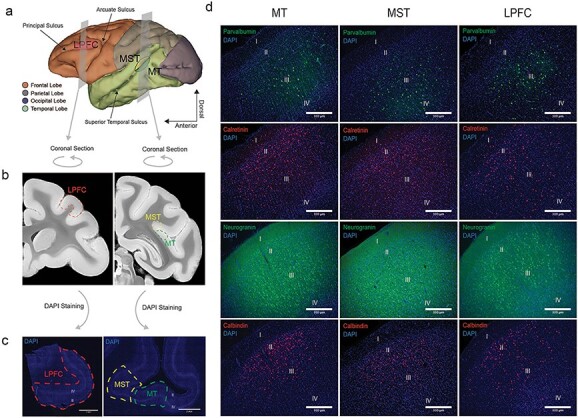
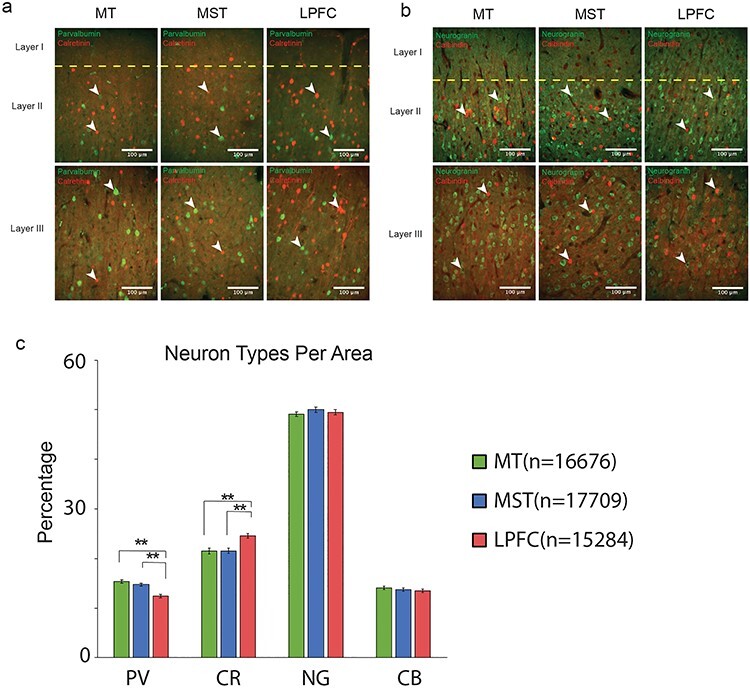
Neuronal spiking activity encoding working memory (WM) is robust in primate association cortices but weak or absent in early sensory cortices. This may be linked to changes in the proportion of neuronal types across areas that influence circuits' ability to generate recurrent excitation. We recorded neuronal activity from areas middle temporal (MT), medial superior temporal (MST), and the lateral prefrontal cortex (LPFC) of monkeys performing a WM task and classified neurons as narrow (NS) and broad spiking (BS). The ratio NS/BS decreased from MT > MST > LPFC. We analyzed the Allen Institute database of ex vivo mice/human intracellular recordings to interpret our data. Our analysis suggests that NS neurons correspond to parvalbumin (PV) or somatostatin (SST) interneurons while BS neurons are pyramidal (P) cells or vasoactive intestinal peptide (VIP) interneurons. We labeled neurons in monkey tissue sections of MT/MST and LPFC and found that the proportion of PV in cortical layers 2/3 decreased, while the proportion of CR cells increased from MT/MST to LPFC. Assuming that primate CR/CB/PV cells perform similar computations as mice VIP/SST/PV cells, our results suggest that changes in the proportion of CR and PV neurons in layers 2/3 cells may favor the emergence of activity encoding WM in association areas.

Keywords: CR interneurons; PV interneurons; inhibition–excitation balance; medial superior temporal; middle temporal; narrow and broad spiking; prefrontal cortex; working memory (WM).


Figures

Figure 1
Figure 1
(a) Hypothetical circuit illustrating the different cell types and their connectivity in the primate neocortex. The basic circuit involving different cell types is at the bottom. The inset at the top illustrates the recurrent connections between P cells encoding the same feature (motion direction in this case) and inhibitory connection between neurons/columns encoding different features. (b) Consequences on recurrent excitation of groups of P cells when increasing the proportion of CR interneurons (increase in the size of the green circle) and decreasing the proportion of PV interneurons (decrease in the size of the red circle). (c) Consequences on recurrent excitation of groups of P cells when increasing the proportion of PV interneurons (increase in the size of the red circle) and decreasing the proportion of CR interneurons (decrease in the size of the green circle). (d) Visual sequence of events for delayed match-to-sample task (DMTS). (e) Image of the macaque brain reconstructed from MRI showing the recorded cortical areas, with MT in green, MST in blue, and LPFC in red.
Figure 2
Figure 2
Classification of neurons into narrow spiking (NS) and broad spiking (BS). (a–c) Normalized average action potential waveforms for MT, MST, and LPFC, displaying NS (red) and BS (blue) waveforms. (d–f) Histograms showing the distribution of the trough-to-peak distance of the AP waveform. A Gaussian fit for each distinct population, with NS neurons in red and BS neurons in blue, is shown, with a bimodal distribution being observed for all areas. Hartigan’s dip and P value are shown for each area. (g) Gaussian functions fit to the different populations of neurons per area. Filled dashed lines represent BS distributions, solid lines represent NS distributions, and colors represent different brain areas. (h) Proportion of NS and BS neurons per area.
Figure 3
Figure 3
Proportions of neuron type (NS and BS) per area ((a) MT, (b) MST, and (c) LPFC) as a function of task period (abscissa). (df) Single neuron significance of auROC for NS and BS neurons for all three areas during the sample and delay periods.
Figure 4
Figure 4
Period coding index (PCI). (a) Boxplot figures for PCI for all areas and neuron types. A value above 0 indicates a predominance of sensory coding over mnemonic coding. (b) Bar plot showing the proportion of neurons with reverse tuning per area. (c) Percentage of neurons displaying reverse tuning per neuron type for all areas.
Figure 5
Figure 5
Analysis of waveform type in a sample of human and mouse neurons obtained during intracellular recordings (patch clamp) experiments. (a, d, g) Action potential waveforms at rheobase aligned to the deepest deflection of the waveform for human, mouse, and transgenic mouse, respectively. In a and d narrow spiking (NS) is shown in red and broad spiking (BS) neurons are shown in blue. In g the red indicates PV/PV cells, the green SST cells, and the blue VIP cells. (b, e, h) Histograms of waveform peak-to-trough for the data in the first column. (c, f) Dendritic type (spiny and aspiny) as a function of waveform type (NS and BS). The colors indicate the percentage of neurons. (i) Interneuron type from the transgenic lines (Parv/PV, VIP, and SST) as a function of spiking phenotype (NS and BS).
Figure 6
Figure 6
Landmarks for tissue extraction and immunohistochemistry images identifying the areas, layers, and neuronal types. (a) MRI reconstruction of the macaque monkey brain with coronal planes representing the regions of MT, MST, and areas 8A/46 that were extracted. (b) coronal images taken from the Calabrese et al. (2015) brain atlas that represent the cut surfaces of the extracted tissue blocks. (c) DAPI images of the sectioned tissue. Layers 2 and 4 can be identified as lighter bands. (d) Example immunohistochemistry images of PV, CR, P cells (Neurogranin), and CB (rows, from top to bottom) across areas MT, MST, and LPFC (columns, from left to right). The different cortical layers are labeled in each image.
Figure 7
Figure 7
Immunohistochemistry, cell counting, and proportions. (a) Example magnified images of PV and CR used for cell counting. The different cortical layers and brain regions are labeled accordingly. (b) Example magnified images of P cells (Neurogranin) and CR interneurons used for counting. (c) Average percentages of PV, CR, P cells, and CB across MT, MST, and LPFC.

References

    1. Ascoli GA, Alonso-Nanclares L, Anderson SA, Barrionuevo G, Benavides-Piccione R, Burkhalter A, Buzsaki G, Cauli B, DeFelipe J, Fairen A, et al. 2008. Petilla terminology: nomenclature of features of GABAergic interneurons of the cerebral cortex. Nat Rev Neurosci. 9(7):557. - PMC - PubMed
    1. Akaike H. 1974. A new look at the statistical model identification. IEEE T Automat Contr. 19:716–723.
    1. Amatrudo JM, Weaver CM, Crimins JL, Hof PR, Rosene DL, Luebke JI. 2012. Influence of highly distinctive structural properties on the excitability of pyramidal neurons in monkey visual and prefrontal cortices. J Neurosci. 32:13644–13660. - PMC - PubMed
    1. Ardid S, Vinck M, Kaping D, Marquez S, Everling S, Womelsdorf T. 2015. Mapping of functionally characterized cell classes onto canonical circuit operations in primate prefrontal cortex. J Neurosci. 35:2975–2991. - PMC - PubMed
    1. Bartho P, Hirase M, Monoconduit L, Zugaro M, Harris KD, Buzsaki G. 2004. Characterization of neocortical principle cells and interneurons by network interactions and extracellular features. J Neurophysiol. 92:600–608. - PubMed

Publication types